Technology (IJRASET)
Preprocessing of Brain Hemorrhage Using CT scan
Warda M. Shaban1, Dr. M. Morsy2, Prof. Mohy ELdin A. Abo_ Elsoud3 Al Mansoura University Faculty of Engineering Electronics&Comm. Dept
Abstract---- One of the most common degradations in medical images is their poor contrast quality and noise. The idea of image enhancement technique is to improve the quality of an image for early diagnosis, and then followed by a noise reduction. This suggests the use of contrast enhancement methods as an attempt to modify the intensity distribution of the image such as histogram analysis which is performed manually and also this paper introduce a new approach for DICOM image is done by applying contrast stretching which is performed automatically, finally spatial filters applied to remove noise.
Keywords___ Preprocessing, Image Enhancement, Histogram analysis, Contrast stretching, and Noise removal.
I. INTRODUCTION
Generally medical images were poor quality in contrast and contain a lot of uncertainties (Fig.1) Show unenhanced CT image. Medical image enhancement improves visual appearance and enables identification of the desired region of the image. Medical imaging plays a leading role in modern diagnosis and contrast enhancement of medical images is useful in helping the radiologist or surgeons to detect pathologic or abnormal regions [1].The effectiveness image can be evaluated by comparing before and after results . All the algorithms of enhancement are carried out in MATLAB 2013b.
II. RELATED WORK
Image enhancement process consists of a collection of techniques that seek to improve the visual appearance of an image or to convert the image to a form better suited for analysis by a human or machine [2].The principal objective of image enhancement is to modify attributes of an image to make it more suitable for a given task and a specific observer. During this process, one or more attributes of the image are modified. Digital Image enhancement techniques provide a multitude of choices for improving the visual quality of images. A familiar example of enhancement is in which when we increase the contrast of an image and filters it to remove the noise "it looks better". Improvement in quality of these degraded images can be achieved by using application of enhancement techniques
Fig.1 Unenhanced CT image.
In the following section we aim to introduce the preprocessing algorithm of CT brain image.
A. Preprocessing
Since the dynamic range of the Hounsfield unit (H.U.) values for CT images is very large (1000 to +1000 H.U.), the first task is to select the appropriate range of gray level for extracting soft tissue regions. The relationship between gray level ( ( , )) and H.U given as:
HU = I (x, y) + intercept (1)
(a) (b)
(C) (d)
Fig.2 Preprocessing results a) Original dicom image, b) Histogram of original dicom image, c) Mat2gray of original image, d) Normalized histogram(0-1) .
1) Image Enhancement: This section aim to improve the contrast of the image to find the region of interest(ROI).
a) Histogram Analysis: CT scans produce 16-bit images consisting of 65, 536 different grayscale values. Only a small portion of
these grayscale values contain information useful for the radiologists. Windowing in medical images refers to selecting the required range of grayscale values.
To get ROI which contain hemorrhage we can do that manually by using Matlab program and function (Imcontrast).
Imcontrast creates an Adjust Contrast tool in a separate figure that is associated with the grayscale image called the target image. The Adjust Contrast tool is an interactive contrast and brightness adjustment tool, in the following figure that you can use to adjust the black-to-white mapping used to display the image. When you use the tool, imcontrast adjusts the contrast of the displayed image by modifying the axes CLim property. To modify the actual pixel values in the target image..(fig.3)Explain the operation of manual analysis.
(a)
Technology (IJRASET)
(c)
(d)
Fig.3 Explain the operation of manual analysis : a) Original dicom image with full range of gray level, b) Original image with gray level range (Min=0.0103, Max=0.0448) c) ROI with gray level(Min=0.3842, Max=0.4149), d) Hard tissue(Min=0.8622,
Max=0.9214).
So the resulted image which contain ROI with gray level range (Min=0.3842, Max=0.4149).
Fig.4 Show the resulted image which contain ROI and its histogram.
2) Automatic method
a) Contrast stretching: This process basically improves the contrast in an image by stretching range of intensity values it encloses
with the purpose to cover a desire variety of values [4].We need to make a contrast stretching for CT brain image with the same tolerance range. By using MATLAB program and function stretchlim, imadjust we select the optimum tolerance (try and error). The tolerance range we use low-high 0.7, 0.916 (Fig.4) shows the original dicom image after contrast stretching and its histogram.
Error=|Approximate Value − Exact Value| (2)
Percentage error =| | – | | × 100% (3)
Accuracy= (1- Percentage error)×100 (4) The efficiency of the proposed method is 97.08% .
B. Noise Removal
Noise reduces the quality of an image, if the brain CT image is very noisy then it will be very difficult to differentiate normal tissue and abnormal tissue and because of this there may be possibility of misdiagnosis. So image de-noising represents the crucial step in medical image analysis, so suitable filters are required for removing the noise[5].
CT images collected from the hospital were very smooth and noise level is very low so we can add noise (Gaussian noise and Speckle noise) to CT brain image to test which filter is perfect to remove.
By using MATLAB program and function (imnoise) we can add Gaussian noise and speckle noise at different variance (0.05-0.09-0.1).
First adding Gaussian noise to tested image as shown in the following figure:
(a) (b) (c)
Fig.6 Shows test image with Gaussian noise at a) Variance=0.05, b) Variance=0.09, c) Variance=0.1. Adding Speckle noise to tested image as shown in the following figure:
(a) (b) (c)
Fig.7 Shows test image with Speckle noise at a) Variance=0.05, b) Variance=0.09, c) Variance=0.1.
Technology (IJRASET)
[6]:
1) Median filter
Median filtering is a nonlinear method used to remove noise from images. It is widely used as it is very effective at removing noise while preserving edges. The main idea of the median filter is to run through the signal entry by entry, replacing each entry with the median of neighboring entries.
( , ) = { ( , )} (5)
2) Wiener filter
The wiener filter is used to convert the input image to desired output image in the best way as impossible. The best first solution is taken to be when the sum of the squares of the error is minimum.
3) Gaussian filter
Gaussian filter is a filter whose impulse response is a Gaussian function (or an approximation to it). Gaussian filters have the properties of having no overshoot to a step function input while minimizing the rise and fall time. Gaussian filter is a linear filter and it is given by the equation:
( , ) = (6)
The mask size is the function of σ. It controls the amount of smoothing, as σ increases more samples must be obtained to represent the Gaussian function accurately.
We can measure the performance of filter by using statistical parameters. The statistical parameters are calculated from the original I(i,j) and filtered image f(i,j). The parameters are Signal to Noise Ratio (SNR), Mean Square Error (MSE) and Peak Signal to Noise Ratio (PSNR)[7].
C. Estimation of SNR
SNR compares the level of desired signal to the level of background noise. The higher the ratio of SNR, the background noise is less obtrusive. SNR is defined as:
= 10 log ∑ ∑∑ ∑ [ ( , )]
[ ( , ) ( , )] (7)
If I(i,j) is the original image, f(i,j) is the filtered image and M * N is the dimension of the images.
D. Peak Signal to Noise Ratio (PSNR)
Power of corrupting noise that affects the fidelity of its representation. PSNR is defined as: = 10 log ( ( , )) (8) Where Max(I(i,j)), is the maximum possible pixel value of the image.
MSE (Mean square error) is an estimator in many ways to quantify the amount by which a filtered image differs from noisy image. If the value of MSE is low, we can say the quality of the image is better. The MSE is defined as:
=
∗ ∑ ∑ [I(i, j)−f(i, j)] (9)
If the value of PSNR is high, so the image quality is better.
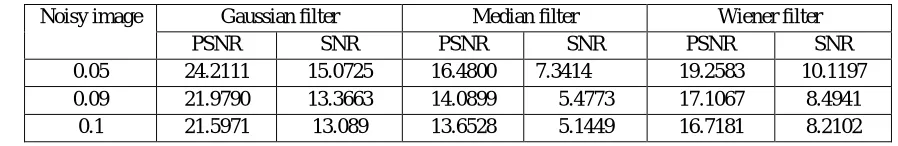
Table (1): Image quality parameters after applying Gaussian noise and filtered image
Noisy image Gaussian filter Median filter Wiener filter PSNR SNR PSNR SNR PSNR SNR 0.05 24.2111 15.0725 16.4800 7.3414 19.2583 10.1197 0.09 21.9790 13.3663 14.0899 5.4773 17.1067 8.4941
[image:6.612.77.526.640.713.2]Noisy image Gaussian filter Median filter Wiener filter PSNR SNR PSNR SNR PSNR SNR 0.05 31.7001 21.4805 25.2879 15.2879 31.5389 21.3252 0.09 30..910 20.7384 23.1589 12.7681 30.8130 20.4402 0.1 30.7007 20.4602 22.8037 12.3873 30.6810 20.2646
Table(1) & Table(2) showing that Gaussian filter is more suitable filter to remove noise as it give higher peak signal to noise ratio than other filters.
III. SIMULATED RESULTS
A. Removing Gaussian noise
Filter
Variance
Variance=0.05 Variance=0.09 Variance=0.1
Median filter
Wiener filter
[image:7.612.51.538.209.686.2]Gaussian filter
Technology (IJRASET)
B. Removing Speckle noiseFilter
Variance
Variance=0.05 Variance=0.09 Variance=0.1
Median filter
Wiener filter
Gaussian filter
Fig.9 shows noise removal of Speckle noise at different variance(0.05,0.09,0.1) using Median, Wiener and Gaussian filter.
The last step is apply the selective filter to the original test image, (Fig. 10)show a) the original tested image, b) tested image after applying gaussian filter with peak signal to noise ratio PSNR=38.8164 and signal to noise ratio SNR=29.1086.
(a) (b)
This study describes the method to improve the image quality of DICOM image. The goal of the image
enhancement technique is to improve a characteristic or quality of an image, such that the resulting image is better than the original image, then removing noise that appear after enhancement.
V. FUTURE WORK
We will develop an algorithm for hemorrhage lesion region pre_segmentation and calculating area of the hemorrhage according to area of the brain.
REFERENCES
[1] D Nirmala, Sathyabama University, Tamil Nadu, India,” Medical Image Contrast Enhancement Techniques”, 2015. [2] S.S. Bedi 1, Rati Khandelwal 2 ,"Various Image Enhancement Techniques- A Critical Review", Vol. 2, Issue 3, March 2013. [3] Saurabh Sharma, “Analysis of Stroke on Brain Computed Tomography Scans- M.S”, October 2013
[4] Mussarat Yasmin, Muhammad Sharif, Saleha Masood, Mudassar Raza and Sajjad Mohsin,“Brain Image Enhancement – A Survey”,2012.
[5 ] Bhavna Sharma Department of Computer Science, Mohanlal Sukhadia University, Udaipur.” Noise Removal From Brain CT Image”, Volume : 3, Issue: 8, Aug 2014.
[6 ] Kale Vaishanw Assistant Professor, Department of E&TC, P.D.V.V.P. College of Engineering, university of Pune,Ahmednagar, Maharashtra, India","X-Ray Lung Image Enhancement by Spatial Filtering","Volume 3, Special Issue 4, April 2014".