©IJRASET: All Rights are Reserved
Page 1086
Buffer Allocation and Performance Evaluation of
Job Shop System using Simulation
Rishu Sharma
Assistant Prof, Department of Mechanical & Automation Engineering, G.B.Pant Engineering College, Delhi-110020
Abstract: The placement of buffers has important implications for system effectiveness and inventory cost. Transfer lines and automated flexible flow lines are capital intensive and must be kept running to be feasible. Breakdowns of single workstations or the entire line are particularly important in designing these systems. Buffers allow workstations to operate more independently, cushioning against machine failures, worker or part shortages and production rate differences. Buffers provide a means for insulating workstations from failures elsewhere in the line, thus improving station utilizations. In present paper, need of buffer allocation and advantages obtained with its proper allocation for job shop system is done. A real life Automobile Service Centre is taken as the case of Job Shop Systems.
Keywords: Simulation, Job Shop, Buffer Allocation
I. INTRODUCTION
In the present day global competition, there is tremendous pressure on any manufacturing unit of a company to perform at peak efficiency so that the price of the products could be kept at a low level. The pressure is exacerbated by the fact that the modern day customers want a variety of product models, and as is well known, increasing a product variety increases complexities, and decreases the efficiency of the manufacturing unit. The manufacturing unit thus has to simultaneously deal with product variety and keeping high levels of productivity. This has lead to increased application of Job Shop Production system.
A particular industrial sector which has attracted much interest due to its quality problems is the automobile industry. In particular, customer perceptions of the vehicle and the manufacturer evolve during vehicle ownership, and depend upon both vehicle and after sales services. The automotive after sales service/repair shops, here after called Automobile Service Centre (ASC), are the authorized service shops responsible for service and repair operations after the purchase of car. As every car enter different repair and service needs, the system handles large job variety and hence ASC resembles to job shop system.
For smooth working of workstations and avoid the delays, proper buffer allocation is needed. A buffer is storage place between two successive workstations, which can hold up to a particular number of semi-serviced cars when succeeding station are still busy in processing earlier car. In present paper buffer allocation at workstation of ASC is done.
Because of the complexities of present day systems, the traditional optimization methods are either not capable or inefficient in handling such system. Simulation is now considered an indispensable tool to study the system behavior as it gives valuable understanding of system under dynamic conditions. Prakash and Chen (1995) advocated simulation as useful and powerful tool for system analysis and evaluation. They found that very important information can be generated from simulation runs that may be difficult to acquire from other analytical tools. In spite of the fact that generating a solution about a system in simulation technique may not give optimum result, it is more convenient in modeling complex system than analytical technique (Kesen & Baykoc, 2007). The paper presents results of investigation of the performance of ASC using simulation.
II. LITERATURE REVIEW
This section reviews some of the work done previously in the area of job shops and simulation. The research related to job shop production system is mainly focused on the studying performance with respect to customers and efficiency of the system. Various
techniques like optimization models and simulation models have seen used to study such parameters.Haskose et al (2004) enables
©IJRASET: All Rights are Reserved
Page 1087
generated, through analysis of multiplexing, adoption decision by firms in automobile industry and suggested need formore robust consideration of opportunities to adopt advance technologies. The performance measures of shops are extremely
sensitive to arrival rate and product mix in terms of WIP, workstation utilization, throughput time etc (Habachi, 1995). Morris and Tersne (1990) considered mean throughput time and WIP as observed system performance measures with respect to series of test
factors such as demand stability, setup time and positive flow direction. Monch and Zimmernamm (2007) presented a
computational experiment based on the simulation of dynamic environment for appropriate selection of machine criticality measures. They described adaptation techniques for a hierarchy organized multi agent system applied to production control of
complex shops. From the review many indications about the demand variability were found. In order to cope with the
variability associated with the system proper allocation of buffer is required in the stochastic environments. The presents paper deals with this issue and takes automobile service centre as the job shop for analysis.
III. THE MODEL
The ASC considered for the present study (figure 1) consists of seven workstations capable of performing variety of service operations. Variations, in terms of service requirement; and inter arrival time of cars are considered as components of demand variability. For choosing the performance measures, discussions were held with experts from industry and academia and the following three performance measures are selected for present research:
1) Shipped: This is the total number of cars that have been serviced by ASC and taken as cars serviced per day. This measure is most relevant factor for ASC and is taken as indicator of capacity of the shop. Greater the number of cars serviced, better is the performance.
2) Av Throughput Time (TT): It is defined as the average time vehicles spent in the ASC. Throughput time estimates the waiting of vehicle at ASC. For better performance of ASC, smaller throughput time is desired.
3) Av utilization: It is average percentage utilization of work stations. The following assumptions are made in formulating the model:
a) Service time at a station is deterministic.
b) There is no alternate routing i.e. an operation of job can be performed by only one type of machine
c) Pending previous day jobs are taken next day.
d) Machine breakdown, power breakdown, workers absenteeism not considered.
e) Due dates not considered as mostly vehicles are delivered on the same day.
f) Shortage of spare parts is not considered as the ASC group has four more shops in the same city and spare parts can be shared
in case of shortages.
g) Each machine can perform only one operation at a time on any job.
h) Changeover time is ignored as most of the activities are manual.
i) Inter machine transportation time is negligible.
IV. RESULTS AND DISCUSSION
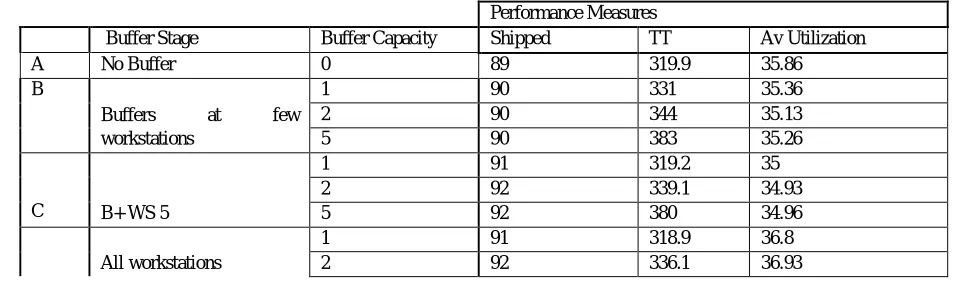
[image:3.612.64.554.598.743.2]The results of simulation for finding the buffer capacity are given in table 1. Due to space considerations, the maximum of 5 vehicles can wait outside the workstation for processing. So, buffer capacity level of 1, 2 and 5 is selected for the purpose of experimentation.
Table 1: Mean values for observed dependent variables for each experimental model
Performance Measures
Buffer Stage Buffer Capacity Shipped TT Av Utilization
A No Buffer 0 89 319.9 35.86
B
Buffers at few
workstations
1 90 331 35.36
2 90 344 35.13
5 90 383 35.26
C B+ WS 5
1 91 319.2 35
2 92 339.1 34.93
5 92 380 34.96
All workstations
1 91 318.9 36.8
©IJRASET: All Rights are Reserved
Page 1088
D 5 92 370.4 37
It is found from the simulation that, when buffer capacity is zero, the numbers of cars shipped are least. The possible cause for this is deadlock which occurs when different parts with different routes compete for finite number of resources. Deadlocks occur due to the finite capacity of resources such as buffers and workstations causing low down time and low utilization of critical and expensive
resources (Abdallah et al., 2002). One way to solve the deadlock problem is to eliminate the possibility of deadlock in the design of
the physical system. A study by Kundu and Akyildiz (1989) approached the deadlock problem in closed queuing networks through physical design (or, more specifically, design of the buffer capacities) of the networks.
From table 1, case C with buffer capacity 2is found to be buffer combination for the system. The decision is based on the fact that
maximum cars are serviced by this combination. Also not significant difference in other performance parameters is seen when compared with other cases of experimentation.
With case C (refer table 1), buffers are not present at workstation WS 6 & 7. The quantity of these workstations is sufficient for the present system and no blockage is observed at these workstations; hence requirement of buffers is not seen at these stations. The application of the buffers at these stations will increase the overall storage cost without increase in the production output. The case C (shown bolded in table 1), however, is not able to meet the demand fully due of lack of other resources. The possible solution to solve this is by analyzing the bottleneck station.
It is found from simulation results of case C, that WS 3 & 4.a-d are blocked during the run. The blockage is observed due to the fact that the car is not able to move to its next station as the next station is occupied with processing of some other car. Though car is waiting for service operation (either at buffer or at the workstation itself), yet it cannot move into its next station as some operation is taking place at this station and hence this station becomes the bottleneck station. The blockage in the system can be reduced; to increase the work stations utilization, by either increasing the capacity of bottleneck station or increasing the size of the buffer. The bottleneck station for the present model WS 5, with percentage utilization of 99, is identified as source for blockage at WS 3 and 4.a-d. No improvement is seen (refer table 1) in the number of cars shipped when buffer capacity is increased from 2 to 5. Thus, the performance can be further improved by increasing the quantity at bottleneck station.
The simulation experiments were further conducted and found that increasing the number of workstation increases the capability of shop for meeting the demand. It is also expected that the suggested configuration will help to meet the demand variations appreciably.
V. CONCLUSION AND FUTURE DIRECTION
The present paper reports the results of simulation study of job shop systems. Simulation experiments has been conducted for an automobile service centre using simulation package WITNESS 2006 since it offers sufficient flexibility to simulate the job shop systems. The study deals with planning of resources (workstations and buffers) for an ASC. In this paper, the opportunities for buffer allocation for a job shop system are investigated. The placement of buffer is an important criteria for system effectiveness and inventory cost. The investigation shows that designing of buffer capacities improves the performance of job shop system. The analysis on bottleneck station suggests a proper combination of workstation and buffers is required to increase the production rate of shop. For future directions, increase in demand conditions can be studied. The design of buffer allocation and capacities could be done to meet the fluctuating demand conditions.
REFERENCES
[1] Kesen, E.R. and Baykoc, O.F. (2007), “Simulation of automated guided vehicles systems based JIT philosophy in job shop environment”, Simulation Modeling and Practice Theory, Vol 15, pp 272-284.
[2] Prakash, A. and Chen, M. (1995), “A simulation study of Flexible Manufacturing Systems”, Computers Industrial Engineering, Vol 28, No 1, pp 191-199. [3] Abdallah, I.B., Elmaraghy, H.A. and Elmekkawy, T. (2002), “Deadlock-free scheduling in Flexible manufacturing systems using Petri nets” International
Journal of Production Research, Vol 40, No 12, pp 2733-2756.
[4] Kundu, S. and Kundu and Akyildiz, I.F. (1989), “Deadlock free buffer allocation in closed queuing networks”, Queuing networks, Vol 4, No 1, pp 47-56. [5] Haskose, A., Kingsman, B.G., and Worthington, D. (2004), “Performance analysis of make to order manufacturing system under different work head control
regimes”, International Journal of Production Economics, Vol 94, pp 169-186.
[6] Habchi, G., and Laburine, C.H. (1995), “Study of lot sizes on job shop system using simulation”, Simulation Practice and Theory, Vol 2, pp 227-289.
[7] Morgan, L.O., and Daniel, R.L. (2001), “Integrating product mix and technology adoption decision: a portfolio approach for evaluating advanced technologies in automobile industry”, Journal of Operation management, Vol 19, pp 210-218.
©IJRASET: All Rights are Reserved