Development Of An Optimized Hybrid System
Based On PV And Biomass
Ankit Bhatt1, Ishan Kaushik2
1
Assistant Professor, 2Student, Department of Electrical and Electronics Engineering G.E.U., Dehradun (India)
Abstract: Renewable energy can be seen as one of the important prospect of today’s research, as it enlightens the lives of millions of people by fulfilling multiple necessities of their daily life and simultaneously overcomes the ill effects caused by the non-renewable sources. Present study is based on the development of a hybrid energy system for supplying the load demand of an Institution (Graphic Era University), India with the help of the available resources of the area such as solar, biomass and biogas with the addition of diesel generator by using HOMER software. HOMER software is used to analyze the best configuration among a set of systems for electricity requirement for fulfilling the load demand of the institution. The system is designed to fulfill the daily and the peak demand of each day as per the load estimation. The resources that could be avail could not match the load demand hence a partial load was considered. From the optimization results, it is found that an optimum HES comprising of: 20kW PV, 7kW diesel generator, 10kW biogas generator, 400 batteries and 350 kW of converter has been found suitable for the study area. The COE and renewable fraction are 1.902 $/kWh as minimum and 100% as maximum respectively. Keywords: Cost of Energy (COE), Hybrid Energy System (HES), HOMER, Net Present Cost (NPC), and Renewable Fraction (RF).
I. INTRODUCTION
Renewable energy resources are environment friendly, in exhaustive and easily available energy sources in nature. They contribute almost 13.5% of the global energy demand. Hybrid energy systems (HES) can be competitively supplies the power. The introduction of DG decreases the dependency on PV or wind component due to which operating hours and running costs of diesel generator also reduces [1]. Introduction of battery storage also limits the diesel generators from maximum start/stop cycles so that fuel can be less consumed [2, 3]. From the past several years, the HES have become the most reliable system for isolated areas [4]. The main objective of a HES is to attain fuel saving and provide reliable power supply. To overcome the alternating nature of some renewable energy resources like solar and wind, it is necessary to combine two or more power generating sources with battery so that system performance can be improved. The areas are mostly rich in renewable energy resources like hydro, solar, biomass, biogas, wind etc. Several researchers explained the techno economic viability of biogas plants in the areas [2, 3]. Hybrid Energy System (HES) are found cost effective solutions to energize such areas and can remove the infeasibility related to a single energy source by taking advantages of all the available resources [4]. Due to the intermittent nature of most of the renewable energy sources, conditions may arise, when the demand exceeds the generation. The use of battery, as storage may improve the power quality and can store the excess energy required during the peak time. DG can be an another solution to such problem as it can meet the demand by manipulating the DG operation that can improve battery life and charge it if a lower set point is reached. The system size can also be reduced by effectively selecting suitable combination of generators [5]. A proper tuning of DG and battery storage may also help to reduce the fuel consumption [6, 7].
The present paper deals with the development of HES for the Institution (Graphic Era University). The area is prone to few renewable resources such as solar, biomass, biogas etc. The paper covers the assessment of demand and potential of available renewable energy. Optimization of cost effective HES for the area has been carried out using HOMER [8-12]. Based on load following strategy, HOMER found the best combination of components for the development of HES in terms of NPC (Net Present Cost) and COE (Cost of Energy) for the study area.
II. PROFILE OF THE STUDY AREA
III. LOAD ASSESSMENT
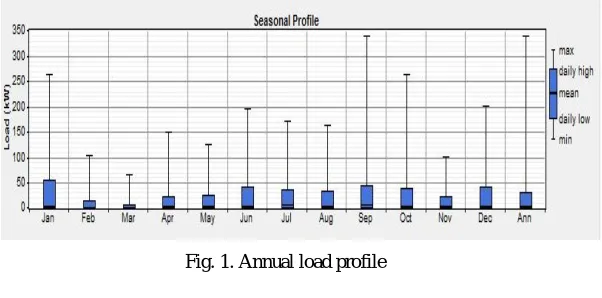
The energy demand was estimated by considering the partial load that could be fulfilled at the time of roasting. The energy demand has been considered by taking the running load of the generator set. The load of the whole institute was a bulk load and cannot be fulfilled by the amount of the resources available in the site location. Thus the project focused in fulfilling the load at the time of roasting.
[image:3.612.163.464.143.292.2]
Fig. 1. Annual load profile
IV. RESOURCE ASSESSMENT
In this area, solar and biomass are the major resources. The estimation of potential of available energy resources as well as the energy demand of the study area is carried out as follows:
A. Solar Energy
Based on the location of the study area i.e. Latitude 30.590N and Longitude 77.590E, HOMER provides the monthly average daily solar radiation. Based on this data the annual average daily solar radiation comes out to be 5.34kWh/m2/day. Table 1 shows daily and monthly solar radiation data. Fig. 2 shows monthly average daily solar radiation and clearness index. From fig. it is clear that in the month of May solar radiation is highest i.e. 7.38kWh/m2/day whereas in the month of December solar radiation is lowest i.e. 3.59kWh/m2/day.
Table 1. Daily and monthly solar radiation data
Month Clearness index
Daily Total Radiation
(kWh/m2)
Monthly Total Radiation (kWh/m2)
January 0.662 3.966 122.95
February 0.651 4.694 131.43
March 0.662 5.827 180.64
April 0.669 6.848 205.44
May 0.665 7.38 228.78
June 0.586 6.684 200.52
July 0.463 5.201 161.23
August 0.471 4.952 153.51
September 0.566 5.242 157.26
October 0.7 5.364 166.28
November 0.687 4.292 128.76
December 0.641 3.587 111.19
[image:3.612.155.458.477.685.2]Fig. 2. Monthly average daily solar radiation and clearness index
B. Biogas Energy
Biogas potential can be assessed by dungs of animals like cows, buffalos, goats, horses, mules etc. On the basis of the survey the total population of cattle was found to be 100. In order to assess the biogas potential, survey of cattle population of institute has been carried out and the assessment of biogas has been made on the basis of dung yield (biomass) as presented. Fig. 3 shows the availability of biomass. Here collection efficiency has been assumed to be 70%, gas yield per kg of wet dung 0.036 m3/kg, calorific value of biogas 4700 kcal/m3, conversion factor 860 [14], generator efficiency 95% and diesel engine efficiency has been assumed to be 28%.The composition of biogas varies depending upon the origin of the anaerobic digestion process. Landfill gas typically has methane concentrations around 50%. Advanced waste treatment technologies can produce biogas with 55% – 75% methane, which for reactors with free liquids can be increased to 80% - 90% methane using in-situ gas purification techniques. As produced, biogas contains water vapour. The fractional volume of water vapour is a function of biogas temperature; correction of measured gas volume for water vapour content and thermal expansion is easily done via simple mathematics which yields the standardized volume of dry biogas. In some cases, biogas contains siloxanes. They are formed from the anaerobic decomposition of materials commonly found in soaps and detergents. During combustion of biogas containing siloxanes, silicon is released and can combine with free oxygen or other elements in the combustion gas. Deposits are formed containing contain calcium, sulfur, zinc, phosphorus. Such white mineral deposits accumulate to a surface thickness of several millimeters and must be removed by chemical or mechanical means. Practical and cost-effective technologies to remove siloxanes and other biogas contaminants are available. For 1000 kg (wet weight) of input to a typical bio digester, total solids may be 30% of the wet weight while volatile suspended solids may be 90% of the total solids. Protein would be 20% of the volatile solids, carbohydrates would be 70% of the volatile solids, and finally fats would be 10% of the volatile solids.
Fig. 3. Biomass Resource
Energy yield = 36.63 kWh/day
Therefore, based on the biogas availability in the study area, the energy yield is 36.63kWh/day.
V. CONFIGURATION OF THE PROPOSED HYBRID ENERGY SYSTEM COMPONENTS
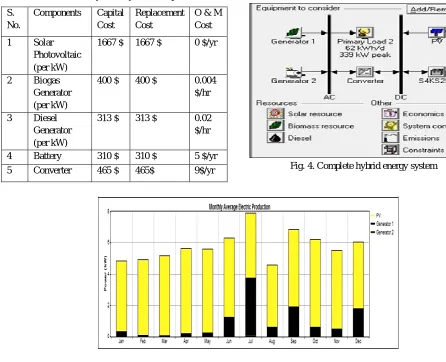
The major components of hybrid energy system are SPV, biogas generator, batteries and converters. For economic analysis, capital costs, replacement and O&M costs of each unit is defined in HOMER software in order to simulate the system. Table 2 shows different economic parameters of system components used for the development of HES. The sizes of SPV module are considered as 0, 10, 15, 20, 25, 30, 60, 65 and 70 kW. Life of 20 years and derating factor of 80% are considered with no tracking system. Size of biogas generator is considered as 7 kW. Operating hours for biogas generator is taken as 15000 hrs and minimum load ratio as 30%. Sizes of diesel generator are considered as 0, 10, 15, 16, 18, 20 and 22 kW. Surrette 6CS25P battery is considered whose manufacturer is Rolls/Surrette.
VI. RESULT AND DISCUSSION
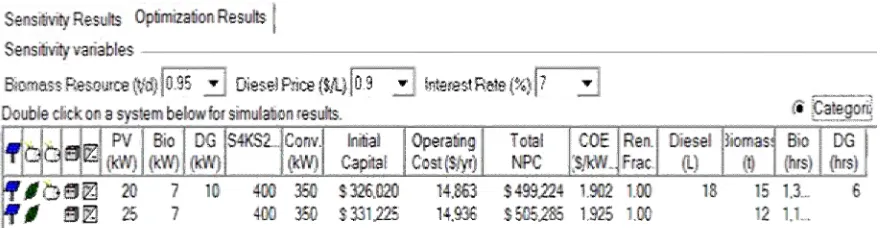
[image:5.612.57.503.343.705.2]The HES given by HOMER is shown in Fig. 4. Table 3 shows the optimized results of hybrid energy system. It is found that several configurations are possible on the basis of minimum net present cost (N.P.C.) and cost of energy (C.O.E.). Result shows that the total cost of first configuration i.e. PV -Diesel-Biogas, NPC is 499,224 $ with COE 1.902 $/kWh, renewable fraction as 100% and the second configuration i.e. PV-biogas, NPC is 505,285 $ with COE 1.925 $/kWh, renewable fraction as 100%. This shows that from both the configurations first configuration is considered as the best configuration having less COE and less NPC with system specifications as 20 kW SPV, 10 kW diesel generator, 7 kW biogas generator, 400 storage batteries in addition to 350 kW capacity converter.
Table 2. Economic analysis of System Components
Fig. 4. Complete hybrid energy system
S. No.
Components Capital Cost
Replacement Cost
O & M Cost
1 Solar Photovoltaic (per kW)
1667 $ 1667 $ 0 $/yr
2 Biogas Generator (per kW)
400 $ 400 $ 0.004 $/hr
3 Diesel Generator (per kW)
313 $ 313 $ 0.02 $/hr
4 Battery 310 $ 310 $ 5 $/yr
Fig. 5. Electricity production by different components of HES
Table 3: Results of Optimization of Hybrid Energy System for Study Area
From Fig. 5 it is observed that the share of electricity from SPV is 34,054 kWh/yr (78%), 53 kWh/yr from diesel generator and 9,443 kWh/yr from the biogas (22%). Monthly average electricity production from different resources is shown in Fig. 5. Minimum average production months are June, July and September. The paper signifies the involvement of various available energy resources and their role in the development of HES for a sited area. An optimum HES consisting of 20 kW SPV, 7 kW biogas generators and 10 kW diesel generators and 350 kW of converter with 400 storage batteries, has been taken for HES for the Instution. Optimization and simulation has been done using HOMER software. The results indicate that the proposed HES offer the most economically feasible solution for the study area. The COE of the optimal HES comes around 1.902 $/kWh with NPC 499,224 $ as minimum and the renewable energy fraction accounts for about 100% of the total generation which is found to be the most economical solution.
REFERENCES
[1] M. Muralikrishna, and V. Lakshminarayana, “Hybrid (solar and wind) Energy System for Rural Electrification”, ARPN Journal of Engineering and Applied Sciences, vol. 3, no. 5, pp. 50-57, October 2008.
[2] H. Katuwal, and A.K. Bohara, “Biogas: a promising renewable technology and its impact on rural households in Nepal”, Renew Sustain Energy Rev 13, pp. 2668-74, 2009.
[3] P.C. Ghimire, “SNV supported domestic biogas programmes in Asia and Africa”, Renew Energy 49, pp. 90-4, 2013.
[4] J.L. Bernal-Agustín, and R. Dufo-López, “Simulation and optimization of stand-alone hybrid renewable energy systems”, Renewable and Sustainable Energy Reviews 13(8), pp. 2111–8, 2009.
[5] M. Muselli, G. Norton, and A. Louche, “Design of hybrid photovoltaic power generator with optimization of energy management”, Sol Energy 65(3), pp. 143–57, 1999.
[6] M.A. Elhadidy, and S.M. Shaahid, “Optimal sizing of battery storage for hybrid (wind & diesel) power systems”, Renew Energy 18, pp. 77–86, 1999. [7] M.A. Elhadidy, “Performance evaluation of hybrid (wind/solar/diesel) power systems”, Renew Energy 18, pp. 401–13, 2002.
[8] O. Guler, S.A. Akdag, and M.E. Dincsoy, “Feasibility analysis of medium-sized hotel’s electrical energy consumption with hybrid systems”, Sustainable Cities and Society 9, pp. 15–22, 2013.
[9] U.S. Kumar, and P.S. Manoharan, “Economic analysis of hybrid power systems (PV/diesel) in different climatic zones of Tamil Nadu”, Energy Conversion and Management 80, pp. 469–476, 2014.
[10] R. Sen, and S.C. Bhattacharyya, “Off-grid electricity generation with renewable energy technologies in India: An application of HOMER”, Renewable Energy 62, pp. 388-398, 2014.
[11] A. Asrari, A. Ghasemi, M.H. Javidi, “Economic evaluation of hybrid renewable energy systems for rural electrification in Iran—A case study”, Renewable and Sustainable Energy Reviews 16, pp. 3123– 3130, 2012.
[12] G. Rohani, and M. Nour, “Techno-economic analysis of stand-alone hybrid renewable power system for Ras Musherib in United Arab Emirates”, Energy 64, pp. 828-841, 2014.
[13] http://en.wikipedia.org/wiki/Uttarakhand.