Technology (IJRASET)
Optimization in Turning of Ti-6AL-4V Using
Anova and Regression Analysis
V G Aswathy1, Dr. N.Rajeev2 1,2
Department of Mechanical Engineering, NSS College of Engineering, Palakkad, Kerala 678008, India
Abstract-Surface roughness is an important factor to evaluate cutting performance. The primary factors such as speed, feed, depth of cut, type of material, tool geometry etc. have high impact on surface roughness. So it is a measure of product quality since it greatly influences the performance of mechanical parts as well as production cost. This paper developed a regression model and carried out Analysis of variance (ANOVA) to investigate the machining parameters such as cutting speed, feed rate, depth of cut and nose radius, affecting the roughness of surface produced in wet turning process of Ti-6Al-4V work material using CVD coated carbide inserts. The experiment has been designed and carried out on the basis of a three level, Taguchi’s 27 Orthogonal Array ((OA) design.
Key words: Wet turning, ANOVA, Regression analysis
I. INTRODUCTION
Titanium alloys are considered to be difficult-to-machine metals in the industry. The low thermal conductivity, low elastic modulus, high temperature strength, and high chemical reactivity of titanium alloys induce many challenges in machining processes. Ti-6Al-4V one of the most important titanium alloy. Ti-6Al-Ti-6Al-4V alloy belongs to the group of + titanium alloys (E O Ezugwu et al.,2003). Ti-6Al-4V are light weight metals with excellent material properties such as high strength-to-weight ratio at elevated temperatures, excellent creep strength, corrosion resistant, good thermal stability, heat treatable, good forge-ability, and good fabricability. These material properties offer the performance required by the aerospace industry (Vinayagamoorthy R and Anthony Xavior M, 2013). Engine manufacturing industries are also use titanium alloys to make most of the front section of the engine. Most of the titanium products within the engine manufacturing industries are produced by turning and milling processes. Due to inherent material properties of this alloy, it has many machining problems occur. To ensure quality of machined products at minimum machining costs and maximum machining effectiveness, it is very important to select optimum parameters when metal cutting machine tools are employed. Process modeling and optimization are the two important issues in manufacturing products. The selection of optimal cutting parameters, like depth of cut, feed, cutting speed and tool insert, is a very important issue for every machining process. In today‘s manufacturing environment, many industries have attempted to introduce flexible manufacturing systems (FMS) as their strategy to adapt to the ever changing competitive market requirements. To ensure quality of machined products to reduce the machining costs and to increase the machining effectiveness, it is very important to select appropriate machining parameters when machine tools are selected for machining.
Optimal combination of machining parameters in machining process gives the lower surface roughness. Surface finish is an essential requirement in determining the surface quality of a product.
II. LITERATURE REVIEW
Technology (IJRASET)
TiN) inserts. They found that the effect of process parameters such as cutting speed, feed, depth of cut and nose radius on surface finish and material removal rate. Analysis Of Variance (ANOVA) were carried out for finding the percentage contribution of process parameters. Their study showed that the feed is the most dominant factor followed by nose radius for surface roughness. In case of material removal rate, depth of cut is the significant one followed by the feed. Also they developed a multiple linear regression model. Sudhansu Ranjan Das et al.,(2013) developed the prediction model for surface roughness in turning operation. The regression model was developed based on the cutting parameter. By using multiple regression and Analysis of Variance (ANOVA) a strong linear relationship among the parameters (velocity, feed rate and depth of cut) and the response (surface roughness) was found.
Krishan Prasad D V V (2013) investigated the influence of cutting parameters on turning process using ANOVA analysis. The machining parameters chosen for the study are rake angle, speed, feed and depth of cut. Using ANOVA analysis he revealed that feed is the most significant parameter for surface roughness. Rishu Gupta and Ashutosh Diwedi (2007) applied Taguchi method for finding out the optimal value of surface roughness and material removal rate under optimum cutting condition in turning of Aluminium Alloy 6061. The experiment was designed by using Taguchi method and experiments were conducted and results were analyzed with the help of ANOVA. After the analysis of experimental observations they found that the depth of cut followed by cutting speed influence material removal rate. They also found that feed and nose radius influences the surface roughness.
Nexhat Qehaja etal. (2014), presented the effect of feed rate, tool geometry, nose radius, and machining time on surface roughness by developing model based on response surface method during dry turning of cold rolled steel using coated tungsten carbide tool inserts. The experiment has been designed and carried out on the basis of a three level factorial design. Also the regression analysis in modeling of surface roughness was carried out. Based on the regression equation generated, they found that the best combination of independent variables for achieving the optimization of cutting processes. Many research works are carried out based on the regression analysis and ANOVA. But only few researchers taken the input parameters cutting speed, feed, depth of cut and nose radius in the turning of Ti-6Al-4V using regression and ANOVA analysis. Therefore proposed work fill this research gap by including the machining parameters cutting speed, feed, depth of cut and nose radius. The methodology adopted for generating results are regression and ANOVA.
III. EXPERIMENTAL SETUP
[image:3.612.249.401.597.703.2]Ti-6Al-4V cylindrical piece of 37.9 mm diameter and 125 mm length was used as a work piece material. Chemical composition of work piece material is shown in Table 1.
Table 1: Chemical composition of Ti-6Al-4V Chemical composition of Ti-6Al-4V
Elements Ti Al V Fe O C N Y H
Percentage 89.598 6.1 4 .16 .11 .02 .01 0.001 0.001
The multi layered CVD coated carbide inserts which produced by Taegutech, Japan were used in turning tests. Different nose radius of 0.1mm, 0.4mm, 0.5mm are selected for this study. The inserts were clamped with a designation of TDJNR 2525 M15 tool holder. The turning tests were performed (Figure 1) on Schaublin 130-CNC lathe having a maximum spindle speed of 3000 rpm in wet conditions. Surface roughness (Ra) was measured by using Taylor/Hobson Precision Form Talysurf. Before and after the machining diameter of work piece are taken for finding the material removal rate.
Technology (IJRASET)
[image:4.612.128.488.146.252.2]Cutting speed, feed, depth of cut and nose radius are chosen as the input parameters. The machining parameters and their levels used in the machining tests are given in Table 2. Design of experiment was determined with the help of the statistical software Minitab 16. Taguchi’s L27 Orthogonal Array was selected for the experimental work.
Table 2: Experimental machining parameters
Machining Parameters Levels
1 2 3
Cutting speed (m/min) 50 60 70
Feed rate(mm/rev) 0.010 0.020 0.030
Depth of cut(mm) 0.02 0.035 0.05
Nose radius(mm) 0.1 0.4 0.5
IV. RESULTS AND DISCUSSIONS
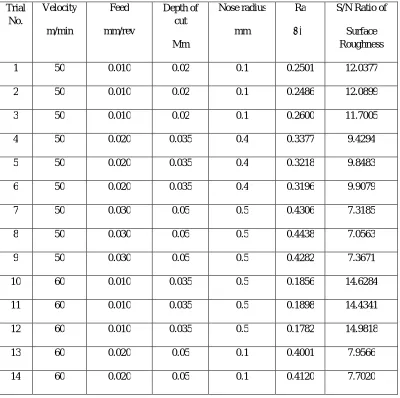
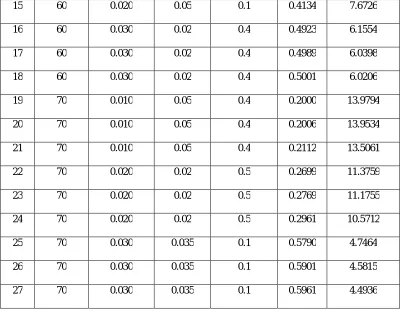
Experimental results and its S/N ratio values are given in the below Table 3. “Lower the better” criteria were used to finding the S/N Ratio values of surface roughness. Taguchi’s S/N Ratio for (LB) Lower-the-better is expressed as / = −10 log ∑ .
Table 3: Experimental observations and S/N values
Trial No.
Velocity
m/min
Feed
mm/rev
Depth of cut
Mm
Nose radius
mm
Ra S/N Ratio of
Surface Roughness
1 50 0.010 0.02 0.1 0.2501 12.0377
2 50 0.010 0.02 0.1 0.2486 12.0899
3 50 0.010 0.02 0.1 0.2600 11.7005
4 50 0.020 0.035 0.4 0.3377 9.4294
5 50 0.020 0.035 0.4 0.3218 9.8483
6 50 0.020 0.035 0.4 0.3196 9.9079
7 50 0.030 0.05 0.5 0.4306 7.3185
8 50 0.030 0.05 0.5 0.4438 7.0563
9 50 0.030 0.05 0.5 0.4282 7.3671
10 60 0.010 0.035 0.5 0.1856 14.6284
11 60 0.010 0.035 0.5 0.1898 14.4341
12 60 0.010 0.035 0.5 0.1782 14.9818
13 60 0.020 0.05 0.1 0.4001 7.9566
[image:4.612.108.508.324.722.2]Technology (IJRASET)
15 60 0.020 0.05 0.1 0.4134 7.6726
16 60 0.030 0.02 0.4 0.4923 6.1554
17 60 0.030 0.02 0.4 0.4989 6.0398
18 60 0.030 0.02 0.4 0.5001 6.0206
19 70 0.010 0.05 0.4 0.2000 13.9794
20 70 0.010 0.05 0.4 0.2006 13.9534
21 70 0.010 0.05 0.4 0.2112 13.5061
22 70 0.020 0.02 0.5 0.2699 11.3759
23 70 0.020 0.02 0.5 0.2769 11.1755
24 70 0.020 0.02 0.5 0.2961 10.5712
25 70 0.030 0.035 0.1 0.5790 4.7464
26 70 0.030 0.035 0.1 0.5901 4.5815
27 70 0.030 0.035 0.1 0.5961 4.4936
[image:5.612.106.512.77.388.2]A. ANOVA Analysis
Table 4: ANOVA for Surface Roughness
Parameters DF Seq SS Adj SS Adj MS F Value P Value
Cutting speed 2 0.437 0.437 0.218 3.85 0.040
Feed rate 2 253.635 253.635 126.817 2237.15 0.000
Depth of cut 2 0.027 0.027 0.014 0.24 0.790
Nose radius 2 37.969 37.969 18.984 334.90 0.000
Error 18 1.020 1.020 0.057
Total 26 293.088
S = 0.238090 R-Sq = 99.65% R-SQ(adj) = 99.50%
Technology (IJRASET)
3 2 1 40 30 20 10 0 3 2 1 3 2 1 40 30 20 10 0 3 2 1 A M e a n B C DMain Effects Plot for Ra
[image:6.612.177.432.83.269.2]Fitted Means
Figure 2: Main effect plots for surface roughness
B. Regression Analysis
A general multiple linear regression equation is implemented to explore the relationship between the machining parameters and the measured surface roughness (Vikas Upadhyay et al.,2013). The regression equation is as follows:
Ra = 0.0881014 + 0.000997222 Velocity + 14.6389 Feed + 0.174074 DOC -0.281449 NR (R-Sq = 98.06%)
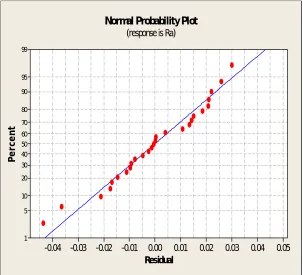
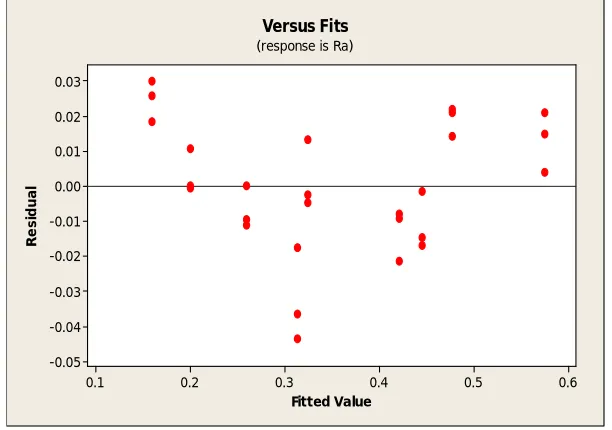
[image:6.612.153.456.420.695.2]For finding the statistical validity of the model, normal probability plot and residuals plot for surface roughness is developed. The residuals are found to follow a straight line in normal plot which indicated that the errors are distributed normally which is shown in Figure 3. However the residuals versus predicted plot found randomly scattered within constant variance are shown in Figure 4.
Figure 3: Normal probability plots of the residuals
0.05 0.04 0.03 0.02 0.01 0.00 -0.01 -0.02 -0.03 -0.04 99 95 90 80 70 60 50 40 30 20 10 5 1 Residual P e rc e n t
Normal Probability Plot
Technology (IJRASET)
0.6 0.5
0.4 0.3
0.2 0.1
0.03
0.02
0.01
0.00
-0.01
-0.02
-0.03
-0.04
-0.05
Fitted Value
R
e
s
id
u
a
l
Versus Fits
[image:7.612.153.459.79.294.2](response is Ra)
Figure 4: Residuals versus Fitted Values for surface roughness
V. CONCLUSION
The experimental investigation conducted to turn Ti-6Al-4V using CVD coated carbide inserts at three levels. Analysis of variance revealed that the feed rate is the most significant factor followed by nose radius for the selected output parameter, surface roughness. The machining parameter depth of cut has less effect on surface roughness. The optimal combination of process parameters for minimum surface roughness is obtained at 70m/min cutting speed, 0.010 mm/rev feed rate, 0.02 mm depth of cut and 0.5mm nose radius. A multiple linear regression model is developed for surface roughness. The developed model is found reasonably accurate and can be used for prediction within the limit.
REFERENCES
[1] E O Ezugwu, J Bonney, Y Yamane, 2003, An Overview Of The Machinability Of Aeroengine alloys, Journal Of Materials Processing Technology, pp.233-253. [2] Ersan Aslant, Necip Causcu,Burak Birgoren, 2006. Design Optimization Of Cutting Parameters When Turning Hardened AISI 4140 Steel (63 HRC) With
Al2O3+ TiCN Mixed Ceramic Tool, Material and Design 28, pp.1618-1622.
[3] Al-Refaie A, Al-Durgham L, and Bata N, 2010, Optimal Parameter Design by Regression Technique and Grey Relational Analysis, Proceedings of the World Congress on Engineering, Vol.3.
[4] Kaladhar M, Venkata subbaiaha K, Srinivasa Rao, 2012, Determination of Optimum Process Parameters during turning of AISI 304 Austenitic stainless steel using Taguchi method and ANOVA, International Journal Of Lean Thinking, Vol.3.
[5] Sudhansu Ranjan Das, Amaresh Kumar, and Debabrata Dhupal, 2013, Effect of Machining Parameters on Surface Roughness in Machining of Hardened AISI 4340 Steel Using Coated Carbide Inserts, International Journal of Innovation and Applied Studies, Vol. 2, pp. 445-453.
[6] Vinayagamoorthy R and Anthony Xavior M, 2013, Significant the Effect of Cutting Parameters on Surface Roughness in Precision Turning in TI-6AL-4V, Middle-East Journal of Scientific Research, pp. 1586-1590.
[7] Krishnan Prasad D V V, 2013, Influence of Cutting Parameters on Turning Process Using Anova Analysis, Research Journal of Engineering Sciences, Vol.2. [8] Vikas Upadhyay , Jain P K, Mehta N K,2013, In-Process Prediction Of Surface Roughness In Turning Of Ti–6Al–4V Alloy Using Cutting Parameters And
Vibration Signals, Measurement 46, Vol. pp. 154–160 .
[9] Rishu Gupta and Ashutosh Diwedi , 2014,Optimization Of Surface Finish And Material Removal Rate With Different Insert Nose Radius For Turning Operation On CNC Turning Center, International Journal of Innovative Research in Science, Engineering and Technology, Vol. 3,pp.13540-13547.