5
X
October 2017
Taguchi Analysis of Process Parameter in
Resistance Spot Welding For Coated Steel S460mc
Material: Ultimate Tensile Strength
Vipul M. Pate
1, Dr. Mohammad Israr
21
Research Scholar, Department of Mechanical engineering, Rai University, Ahmedabad, India
2
Principal, Dungarpur College of Engineering and Technology, Dungarpur, Rajasthan, India
Abstract: A review of the resistance spot welding process is given, followed by a literature study of the known issues when
welding galvanized coated steels and some of the methods explored to address those issues. This study presents a systematic
approach to determine effect of process parameters on ultimate tensile strength as a primary & initial measure of weld quality
and subsequently tip diameter. To achieve the objective an attempt has been made to select important welding parameters like
weld current, weld cycle, hold time using quality tools, available literature and on scientific reasons. On the selected parameters,
Experiment have been conducted as per Taguchi method and fixed the levels for the parameters. The experiment has three
factors and all factors are at two levels. To have wide spectrum of analysis and variability with time experiments are conducted.
Taguchi Analysis has been used for determining most significant parameters affecting the spot weld parameters. Study of the
degradation mechanisms of the uncoated electrode revealed that electrode tip life was due to more thnthe typical alloying and
material loss as well as gross electrode deformation.
Keywords
:
resistance spot welding; coated steel; process parameters; taguchi analysis; electrode; ultimate tensile strength
I.
INTRODUCTION
Resistance Spot Welding is one of the oldest and main method of the electric welding processes in use by industry today for
joining sheet steel components. In industries increased the use of zinc coated steels or galvanized coated steels because of their
good corrosion resistance and low cost. The weld is made by a combination of heat, pressure, and time. However, the Galvanized
coating has increased the difficulty of welding due to its lower electrical resistance and melting temperature. It has led to a drastic
reduction in Weldability as well as electrode tip life. Poor Weldability requires more care to be taken when setting weld
parameters. The purpose of this work is to explore the performance and behaviour of the electrode.
II.
ANALYSIS
OF
ULTIMATE
TENSILE
STRENGTH
In an experiment, purposeful changes are made to the independent variables and the resulting behavior of the dependent variable is
observed. A design of experiment (DOE) is a plan for doing the experiments. In the context of DOE, we will call the independent
variables as factors and the dependent variable as response. DOEs are performed mainly for two purposes:
A.
To identify important factors affecting the response, and
B.
To optimize the response.
In present study general full factorial method was adopted for the design of experiments to identify important factors affecting the
response and to optimize the response using MINITAB 18 software. Three factors i.e Weld Current (kA), Weld Time (cycle) and
Hold Time (cycle) are selected as variables and ultimate tensile strength is selected as response parameter.
Factor and Levels Information
T
ABLE1
F
ACTORS ANDL
EVELS VALUESSr. No.
Factors
Low
High
1
Weld Current(kA)
10.8
11.0
2
Weld Time(cycle)
20
35
T
ABLE2
E
XPERIMENTAL DATA FOR INDENTATIONExperiments
Weld Current
(kA)
Weld Time
(Cycle)
Hold
Time
(Cycle)
UTS
(N/mm^2)
1
10.8
20
45
81.176
2
10.8
20
45
85.450
3
10.8
20
45
87.320
4
10.8
20
45
82.780
5
10.8
20
50
98.224
6
10.8
20
50
95.120
7
10.8
20
50
102.605
8
10.8
20
50
98.120
9
10.8
35
45
90.132
10
10.8
35
45
91.540
11
10.8
35
45
88.392
12
10.8
35
45
92.455
13
10.8
35
50
100.560
14
10.8
35
50
105.230
15
10.8
35
50
102.205
16
10.8
35
50
101.870
17
11.0
20
45
90.560
18
11.0
20
45
93.110
19
11.0
20
45
95.210
20
11.0
20
45
93.420
21
11.0
20
50
105.620
22
11.0
20
50
104.230
23
11.0
20
50
101.540
24
11.0
20
50
102.211
25
11.0
35
45
95.210
26
11.0
35
45
96.321
27
11.0
35
45
98.230
28
11.0
35
45
100.101
29
11.0
35
50
105.211
30
11.0
35
50
107.542
31
11.0
35
50
109.127
32
11.0
35
50
108.628
III.
TAGUCHI
ANALYSIS:
ULTIMATE
TENSILE
STRENGTH
(N/MM^2)
VERSUS
WC,
WT
HT
T
ABLE3
R
ESPONSET
ABLE FORS
IGNAL TON
OISER
ATIOSLevel
WC
WT
HT
1
39.43
39.50
39.20
2
40.02
39.94
40.25
Delta
0.59
0.44
1.05
T
ABLE4
R
ESPONSET
ABLE FORM
EANSLevels
WC
WT
HT
1
93.95
94.79
91.34
2
100.39
99.55
103.00
Delta
6.44
4.75
11.66
Rank
2
3
1
T
ABLE5
R
ESPONSET
ABLE FORS
TANDARDD
EVIATIONLevels
WC
WT
HT
1
2.391
2.401
2.144
2
1.920
1.910
2.167
Delta
0.471
0.490
0.023
Rank
2
1
3
.
11.0
10.8
40.2
40.0
39.8
39.6
39.4
39.2
35
20
45
50
WC
M
e
a
n
o
f
S
N
r
a
ti
o
s
WT
HT
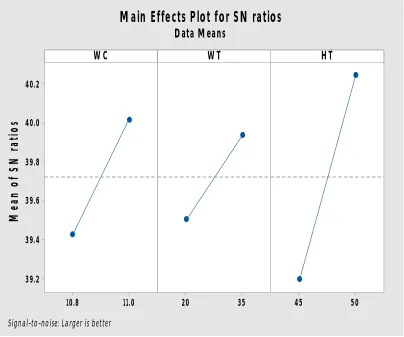
Main Effects Plot for SN ratios
Data Means
[image:4.612.187.425.108.191.2]Signal-to-noise: Larger is better
[image:4.612.110.514.358.695.2]11.0 10.8 104 102 100 98 96 94 92 90 35
20 45 50
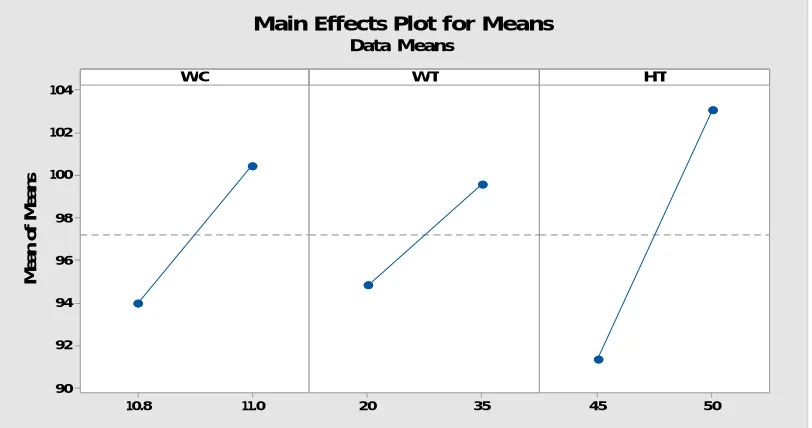
WC M e a n o f M e a n s WT HT
Main Effects Plot for Means
[image:5.612.82.539.65.740.2]Data Means
Fig. 2 Main effects plot for ultimate tensile strength
11.0 10.8 2.4 2.3 2.2 2.1 2.0 1.9 35
20 45 50
WC M e a n o f S tD e v s WT HT
Main Effects Plot for StDevs
[image:5.612.110.516.80.294.2]Data Means
Fig. 3 Main effects plot for ultimate tensile strength
T
ABLE6
T
ABLE FORP
REDICTEDV
ALUES FORP
REDICTIONS/N Ratio
Mean
StDev
Ln(StDev)
38.6818
85.7395
2.62483
0.951393
T
ABLE7
T
ABLE FORP
REDICTEDV
ALUES FORSETTINGS
WC
WT
HT
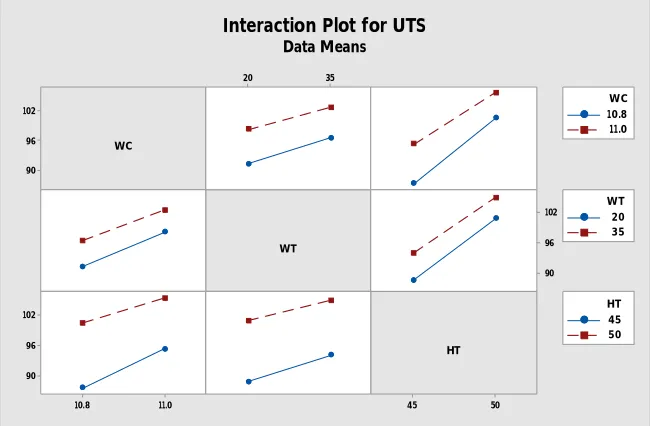
[image:5.612.105.519.328.550.2]102 96 90 50 45 35 20 102 96 90 11.0 10.8 102 96 90 WC WT HT 10.8 11.0 WC 20 35 WT 45 50 HT
Interaction Plot for UTS
[image:6.612.143.468.79.292.2]Data Means
Fig. 4 Interaction plot for ultimate tensile strength
WC WT HT 11.0 10.8 35 20 35 20 50 45 50 45 50 45 50 45 110 105 100 95 90 85 80 U T S
Interval Plot of UTS
95% CI for the Mean
[image:6.612.144.468.322.535.2]Individual standard deviations are used to calculate the intervals.
Fig. 5 Interval plot for ultimate tensile strength
IV.
CONCLUSIONS
Taguchi Analysis was performed to identify the process parameters that are statistically significant. The
purpose of the Taguchi Analysis is to investigate the significance of the process parameters which affect the
ultimate tensile strength of RSW joints. The Taguchi Analysis results for ultimate tensile strength is given in
Table. The results of Taguchi Analysis indicate that the UTS value is for weld current , weld time and hold
time. Weld current has significant effect on ultimate tensile strength.
Figure 4 shows that ultimate tensile strength increases with increase in weld current and weld time.
V.
ACKNOWLEDGMENT
I wish to thank my guide, Dr. Mohammad Israr for their time, guidance, support and assistance in this
endeavor. Their knowledge and wisdom have guided and encouraged me through the exploration of this
research into the realm of welding as well as my own character.
REFERENCES
[1] N. T. Williams and J. D. Parker, “Review of resistance spot welding of steel sheetsPart 1 - modeling and control of weld nugget formation,” International MaterialsReviews, 49 (2), 2004, pp. 45-75.
[2] D. W. Dickinson, J. E. Franklin and A. Stanya, “Characterization of spot weldingbehavior by dynamic electrical parameter monitoring,” Welding Journal, 59 (6), 1980,pp. 170 – 176.
[3] W. Lei, S. J. Hu, and J. Ni, “On-line quality estimation in resistance spotwelding,”ASME Journal of Manufacturing Science and Engineering, 122, 2000, pp. 511 – 512.
[4] N. Harlin, T. B. Jones and J. D. Parker, “Weld growth mechanisms during resistancespot welding of two and three thickness lap joints”, Science and Technology ofWelding and Joining, 7 (1), 2002, pp. 35 – 41.
[5] W. L. Chuko and J. E. Gould, ‘Development of appropriate resistance spot weldingpractice for transformation-hardened steels,” Welding Journal, 81 (1), 2002, pp. 1s – 7s. 27. M. Jou, “
[6] M. Jou, “Real time monitoring weld quality of resistance spot welding for the fabrication of sheet metal assembly”, Journal of Materials Processing technology, 132(1-3), 2003, 102 – 113.
[7] E. Bayraktar and D. Kaplan, “Parametric approach model for determining eldingconditions: new type of welding limit diagrams”, Journal of Materials Process [8] P. Howe and S. C. Kelly, “Coating weight effect on the resistance spotweldability ofelectrogalvanized sheet steels,” 1988, Welding Journal, 67 (12), 1988, pp.
271s –280s.
[9] R. Holliday, J. D. Parker and N. T. Williams, “Relative contribution of electrode tipgrowth mechanisms in spot welding zinc coated steels,” Welding in the world, 37 (4),1996, pp. 186 – 193.
[10] A. De, L. Dorn and O. P. Gupta, “Analysis and optimization of electrode life forconventional and compound tip electrodes during resistance spot welding ofelectrogalvanized steels,” Science and Technology of Welding and Joining, 5 (1),2000, pp. 49 – 57.
[11] C. Ma, S. D. Bhole, D. L. Chen, A. Lee, E. Biro, and G. Boudreau, “Expulsionmonitoring in spot welded advanced high strength automotive sheets”, Science andTechnology Welding and Joining, 11 (4), 2006, pp. 480 – 487.
[12] C. A. Roest and D. D. Rager, “Resistance welding parameter profile for spot weldingaluminum,” Welding Journal, 53 (2), 1974, pp. 529s – 536s.
[13] J. R. Auhl and E. P. Patrick, “A fresh look at resistance spot welding of aluminium automotive components,” SAE Paper No. 940160 / SAE Transactions: J. Materials &Manufacturing, 103, 1994, pp. 36 – 48.
[14] DONG Shijie, “Electrode degradation mechanism during resistance spot welding of zinc coated steel using Cu-TiB2 electrodes. Dec. 2005
[15] Tuna KESKINEL, Effect of Coating thickness on Electrode life in the Spot Welding of Galvanizes Steels. 02/02/2006 ,ERBORU A.S¸., Kdz.
Ere˘gli/Zonguldak-TURKEY
[16] Kevin Randall Chan, "Weldability and Degradation Study of Coated Electrodes for Resistance Spot Welding", Waterloo, Ontario, Canada © Kevin Randall Chan, 2005.