MATRIX PROTEINS
Thesis by
Eileen Fong
In Partial Fulfillment of the Requirements
For the Degree of
Doctor of Philosophy
California Institute of Technology
Pasadena, California
2010
2010
Eileen Fong
Acknowledgements
I would like to express my greatest gratitude to my advisor, David A. Tirrell,
without whom this thesis would not have been possible. Dave is one of the most brilliant
scientists I have ever met, and I am honored to have worked with him. Dave constantly
amazes me with his quick-wit and foresight; yet he is exceptionally humble. Dave has
inspired me tremendously with his passion for science, and has made graduate school
memorable (really!). He has not only taught me to be better scientist, but also how to be a
better person. I am grateful for all the guidance and support he has provided me
throughout my years at Caltech. I truly enjoyed my interactions with him, and will
treasure our many conversations about science and life. I will continue to hold him as my
role model as, and to inspire my students the way he has inspired me. Most importantly, I
am going to miss his humor.
I also had the pleasure to collaborate with Prof. Guo Chin-lin, an outstanding
scientist, teacher, and friend. I am inspired by his intelligence and creativity, and have
enjoyed collaborating with him and members of his lab. I enjoyed the many discussions
we have had about science and life. I am grateful for his guidance and friendship, without
which the last two chapters of my thesis would not have been possible.
My committee members have provided valuable advice and have helped me to
become a better scientist. I would also like to thank my committee members: Prof.
Marianne Bronner-Fraser has been extremely kind and she has not only introduced me to
Developmental Biology, but single-handedly ignited my interest in the field of wound
class, as well as provided valuable critique on my research. And to Prof. Mark E. Davis
who was an exemplary role model for young scientists like myself.
My graduate life has been made memorable (and fun!) by many friends and
colleagues at Caltech. In particular, I thank Beverly Lu and Shelly Tzlil for their life-long
friendship and contributing to fond memories of my 5 years at Caltech. I also like to
thank Stacey Maskarinec, who selflessly taught me everything she knew about cloning
and expressing the aECM proteins. I would also like to thank all past and present
members of the Tirrell laboratory, who have contributed in one way or another to making
my stay here at Caltech memorable. I would also like to thank members of the Guo and
Asthagiri lab for the friendship and generous support they have given me throughout the
years.
I would also like to thank my family for their love and sacrifices they have made
for me to pursue my dream. I am grateful for their patience and constant support, for
being with me all these years. I would also like to thank Benny Poon for the years of
laughter and being part of my memories at Caltech.
Lastly, I would like to acknowledge the Nanyang Technological University,
Singapore (NTU) for their generous funding for 4 years at Caltech. I am also grateful to
many mentors at NTU, who have provided me with valuable advice and support in my
WOUND HEALING ON ARTIFICIAL EXTRACELLULAR
MATRIX PROTEINS
June 2010
Eileen Fong, B. Mat. E., Nanyang Technological University, Singapore
Ph.D., California Institute of Technology
Supervised by David A. Tirrell
Abstract
Collective cell migration is a key process in tissue repair, and in drawing parallels
from complex multi-cellular events such as tumor morphogenesis and embryogenesis.
Mechanisms of wound healing have been studied extensively in vitro. Extracellular
matrix (ECM) is required to support cell migration and ensure rapid coverage of the
wound area. The main challenge in designing biomaterials for tissue repair is to provide
cells with the appropriate biological and mechanical cues. Hence, understanding key
cell-ECM interactions during wound healing is necessary for effective biomaterial design.
Genetic engineering provides a convenient avenue to customize materials for any
given application. The artificial protein-based biomaterials discussed in this work were
material properties that can be fine-tuned according to specific applications. The artificial
extracellular matrix (aECM) proteins prepared by previous members of our laboratory
have been shown to promote attachment of endothelial cells. In this work, we studied
extensively epithelial and fibroblast wound healing behavior on these aECM
biomaterials.
Crosslinked aECM protein films of varying RGD densities have been prepared by
mixing aECM proteins with the RGD cell binding domain with aECM proteins
containing the scrambled RDG sequence. Corneal epithelial wound healing was observed
on aECM films with 100% RGD but not on aECM films with 2.5% RGD. Surprisingly,
we found a five fold difference between the wound closure rates between these surfaces,
but individual cell speeds did not increase significantly. We proposed that the five fold
increase in wound closure rate was determined by the rate of crossing the boundary
between the wound area and the area underneath the cell sheet. Both simulation and
experimental data verified that the rate of boundary-crossing was sufficient to account for
five-fold difference in wound closure rates between 100% RGD and 2.5% RGD surfaces.
Full-length fibronectin domains have also been incorporated to improve the
overall cell binding properties of the aECM proteins. The aECM proteins containing
full-length fibronectin domains were shown to facilitate rapid spreading of Rat-1 fibroblasts.
The aECM protein containing both fibronectin domains 9 and 10 exhibited an increased
binding affinity to the 51 integrin. More importantly, these aECM proteins also
promoted rapid wound closure, which was comparable to that on fibronectin. We showed
phosphorylated levels of focal adhesion kinase (FAK) and extracellular signal-regulated
kinase (ERK), consistent with the faster cell migration and proliferation observed.
To try to understand how cells select wound healing mechanisms, wound healing
of Madin-Darby Canine Kidney (MDCK) epithelial cells were examined in vitro. On
surfaces containing the aECM protein bearing the fibronectin domain 10, characteristic
healing patterns were observed in MDCK wound healing. These patterns are defined by
the formation of leader cells at regular intervals of actomyosin purse strings. The spacing
between consecutive leader cell groups was also found to be independent of the wound
diameter. This spacing however, was found to decrease with increasing myosin II
inhibition. These observations could be explained using a simple force transmission
mechanical model. Consistent with the model predictions, we demonstrated that wounds
with a zigzag geometry biased the selection of the wound healing mechanism along the
wound edge. These zigzag wounds also healed nearly eight fold faster than wounds with
Table of Contents
Abstract ……….. vi
List of Figures and Tables ……….…. xii
1 Introduction 1.1 Wound healing ……….… 1
1.2 Challenges in tissue regeneration ……….…… 2
1.3 Artificial proteins as biomaterials ……… 3
1.4 Methods for studying wound healing in vitro ……….. 5
1.5 Thesis organization and description of contributions ………….…. 6
1.6 References ………... 9
2 The role of boundary-crossing in epithelial wound healing Abstract ……….……….…….. 12
2.1 Introduction ……….……. 13
2.2 Materials and methods ………..14
2.3 Results and discussion ……….……. 22
2.4 Conclusions .….……….…... 33
2.5 Acknowledgements ………..…… 34
2.6 References ………..….…. 34
3 Artificial extracellular matrix proteins for rapid wound healing
Abstract ……….…... 54
3.1 Introduction ……….…. 55
3.2 Materials and methods ……….. 57
3.3 Results and discussion ……….……. 64
3.4 Conclusions .……….……….…… 76
3.5 Acknowledgements ……….….…. 76
3.6 References ……….….……... 76
4 Early patterns in wound healing Abstract ………..…….. 79
4.1 Introduction ………..…… 80
4.2 Materials and methods ………. 81
4.3 Results and discussion ……….….… 87
4.4 Conclusions ..……….…... 95
4.5 Acknowledgements ……….……….… 95
4.6 References ……….…….….…. 95
Additional information for Chapter 4 ……….….. 97
5 Harnessing the purse string for accelerated wound healing Abstract ……….……… 107
5.1 Introduction ……….………. 108
5.3 Results and discussion ……… 112
5.4 Conclusions ..……….. 118
5.5 Acknowledgements …….……….…….. 119
5.6 References ……….……….….... 119
6 Conclusions and future work ……….………. 120
List of Figures and Tables
1 Introduction
1.1 Amino acid sequence of aECM proteins ………..……….. 4
2 The Role of Boundary Crossing in Epithelial Wound Healing
2.1 HCE cell spreading behavior on various substrates ………. 23
2.2 (A) Schematic of wound healing experiment
(B) Time course of wound healing on 2.5% RGD and 100% RGD substrates
(C) Schematic of the Monte-Carlo simulation ………. 25
2.3 Wound healing behavior observed in experiments and simulations ………… 28
2.4 Image of typical substrate with an interface imaged by atomic force
microscopy ……… 31
2.5 Interface crossing and simulated and experimental rate constants of interface crossing ………. 32
A1 Amino acid sequences of aECM proteins containing (A) RGD and (B) RDG cell-binding domains ……….… 36
A2 Rate constants of interface crossing, kc from 100% RGD to various test
surfaces ……….. 37
A3 A schematic illustration of the cell spreading and retraction model ………….. 38
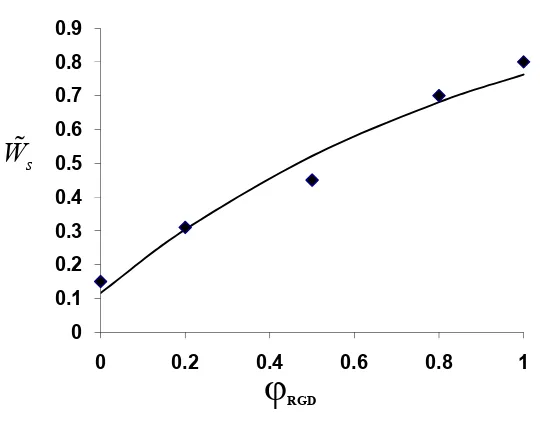
A4 The fit of the experimental spreading data to the theoretical expression for the relative spreading rate, Equation 10 ………... 42
A6 Schematic diagram of cell at an interface, showing two possible outcomes ….. 48
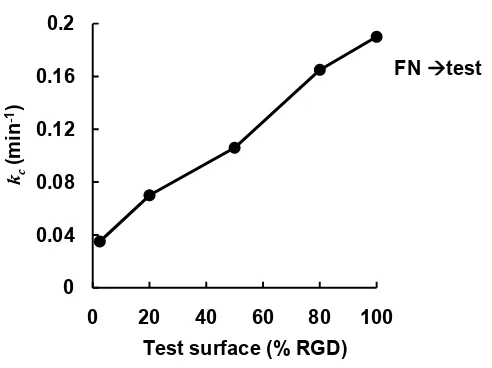
A7 The rate constants of interface crossing from FN to test surfaces obtained from simulation ……… 51
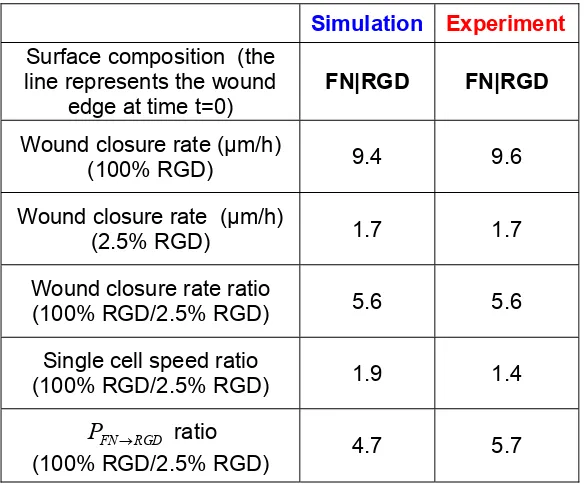
Table A1 Summary of the rates for 100% and 2.5% RGD surfaces ……… 52
3 Artificial Extracellular Matrix Proteins for Rapid Wound Healing
3.1 Amino acid sequences of the aECM proteins containing full length fibronectin domains ………..…………... 56
3.2 Coomassie SDS-PAGE gel of purified aECM proteins …………..….………... 65
3.3 Time course of cell spreading of Rat-1 fibroblasts on adsorbed protein
surfaces ……….…... 67
3.4 Time course of cell spreading of Rat-1 fibroblasts on crosslinked protein
surfaces ……….……...68
3.5 Binding of 51 integrin to fibronectin and aECM proteins by ELISA ….…... 70
3.6 Quantification of wound healing behavior on adsorbed protein surfaces ……... 72
3.7 Determination of FAK and ERK phosphorylation in Rat-1 fibroblasts on various surfaces ………..… 74,75
4 Early patterns in wound healing
4.1 The amino acid sequence of aECM protein containing the fibronectin 10
4.2 Design of micropatterned PDMS blocks for creating circular and
zigzag-shaped wounds ………..……… 83
4.3 Schematic of wound healing assay ………..………. 85
4.4 Removal of PDMS preserved aECM protein surface underneath ………….... 88
4.5 Time-lapse images of MDCK wound healing behavior on both aECM and untreated glass substrates ……….…. 89
4.6 Verification of leader cells and purse-string structures ………. 90
4.7 Quantification of wound healing behavior for circular wounds of increasing diameters ……… 91
4.8 Effect of myosin inhibition on leader cell formation ……….…… 92
4.9 Schematic of proposed mechanical model ………. 93
4.10 Wound curvature bias wound closure mechanisms ……….….. 94
B1 Model predictions ……….…… 103
5 Harnessing the purse string for accelerated wound healing 5.1 Schematic of wound closure in zigzag wounds and the effect of angles on purse string contractions ……….….. 109
5.2 Initial wound geometry determines mode of wound healing …………..…... 113
5.3 Time course of wound healing for zigzag wounds .....…..………... 115
Table 5.1 Wound closure rates as a function of 2θ ……….…... 116
1 INTRODUCTION
1.1 Wound
healing
The wound healing process has been studied for decades. It involves a series of
intricate cellular events involving cell migration, proliferation, and remodeling (1-2).
Upon the onset of the inflammatory response, fibroblasts begin to proliferate and migrate
into the wound area. Collagen and fibronectin are subsequently deposited in the wound
bed (3), serving as a temporary matrix on which epithelial cells can migrate (4-5).
Throughout the process, cells often migrate as groups (6-7). The mechanisms by which
they do so are under active investigation (8).
While understanding how cells move together in tissue repair is important, this
process is also fundamentally relevant to other complex events such as morphogenesis
and tumor metastasis (6, 9-10). Two mechanisms of collective migration have been
identified (11). Lamellipodial crawling involves active migration of cells at the wound
edge, mediated primarily through cell-ECM interactions in the wound area (12-14). This
process is commonly observed in adult wound healing and is well-studied in in vitro
wound healing models (15-17). The second mechanism is known as the “purse string”
model, and is the primary mode of cell movement in fetal wound healing (18-20). Upon
wounding, an actomyosin cable assembles around the periphery of the wound, and
contracts to close the wound by transmitting tension through intercellular junctions (21).
While the lamellipodial crawling mechanism results in rapid wound closure, the purse
involved in both wound healing mechanisms might enable us to achieve optimal wound
healing rates and to minimize scarring.
1.2 Challenges in tissue regeneration
The role of ECM in wound healing has been traditionally thought of as a passive
structural support for cells. It is now clear that cell-ECM interactions, in concert with
growth factors, are necessary for rapid wound healing (23-24). Hence, the main challenge
in wound therapeutics is to provide an ideal microenvironment for optimal cell migration
and proliferation (25).
Many strategies have been adopted for accelerating tissue repair. Exogenous
growth factors (26-27), ECM molecules (28), and short peptide sequences (29) targeting
specific integrin receptors have been shown to accelerate wound healing both in vitro and
in vivo. However, native ECM molecules or growth factors lack structural properties, and
are expensive to produce in large quantities. On the other hand, synthetic materials offer
excellent physical support, but do not possess any biological activity. To circumvent
these disadvantages, synthetic materials have also been functionalized with bioactive
peptide sequences (30-32) and growth factors (33). However, issues arising from steric
1.3 Artificial proteins as biomaterials
The advent of DNA recombinant technology has brought about the discovery of a
novel class of protein-based biomaterials (35). Using a series of genetic manipulations,
DNA sequences encoding functional moieties can be readily integrated into bacterial
hosts and artificial proteins containing user-specified functionalities can be easily
generated.
The genetic approach to biomaterial design allows the synthesis of complex
protein macromolecules, which are otherwise difficult to fabricate by chemical means.
Specific mechanical and biological functionalities can also be expressed combinatorially
to direct cell behavior. Biological domains in fibronectin, laminin, and other ECM
molecules have been widely incorporated into artificial proteins (35). The short
Arg-Gly-Asp (RGD) sequence found in fibronectin has been shown to promote cell spreading of a
multitude of cell types (36). Likewise, recombinant proteins derived from spider silk
(37), collagen (38), and elastin (39) have been shown to display mechanical properties
resembling their native proteins. In particular, Urry and coworkers have synthesized and
characterized a series of recombinant elastin-like materials bearing repetitive motifs
Val-Pro-Gly-X-Gly (VPGXG), where X can be any amino acid. These materials can be
designed to yield a range of viscoelastic properties, by substituting the appropriate amino
acid in the position X (40).
The artificial proteins prepared in our laboratory consist of functional domains
derived from fibronectin and elastin (41-44). The artificial extracellular matrix (aECM)
structural domains. Non-canonical amino acids have also been incorporated to introduce
alternative crosslinking chemistries (45) and to create novel materials with tunable
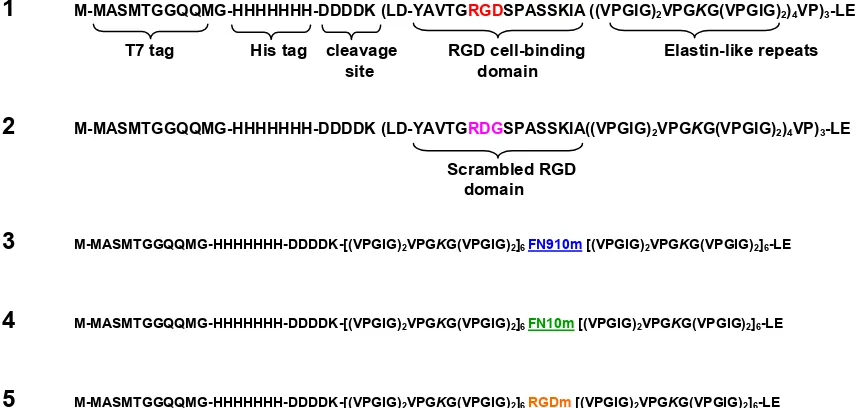
moduli (46). Figure 1.1 shows the amino acid sequences of the aECM proteins discussed
in this thesis. In all constructs 1 to 5, lysine residues were interspersed within the
elastin-like sequences, and subsequently crosslinked to form viscoelastic materials (41, 47).
These aECM proteins also exhibit the characteristic inverse transition temperature of
elastin (48), which allows simple and effective purification via thermal cycling (49).
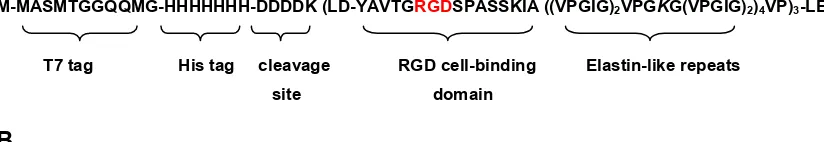
1 M-MASMTGGQQMG-HHHHHHH-DDDDK (LD-YAVTGRGDSPASSKIA ((VPGIG)2VPGKG(VPGIG)2)4VP)3-LE
T7 tag His tag cleavage RGD cell-binding Elastin-like repeats
2 M-MASMTGGQQMG-HHHHHHH-DDDDK (LD-YAVTGRDGSPASSKIA((VPGIG)2VPGKG(VPGIG)2)4VP)3-LE
3 M-MASMTGGQQMG-HHHHHHH-DDDDK-[(VPGIG)2VPGKG(VPGIG)2]6 FN910m [(VPGIG)2VPGKG(VPGIG)2]6-LE
4 M-MASMTGGQQMG-HHHHHHH-DDDDK-[(VPGIG)2VPGKG(VPGIG)2]6 FN10m [(VPGIG)2VPGKG(VPGIG)2]6-LE
[image:18.612.107.535.284.488.2]5 M-MASMTGGQQMG-HHHHHHH-DDDDK-[(VPGIG)2VPGKG(VPGIG)2]6 RGDm [(VPGIG)2VPGKG(VPGIG)2]6-LE
Figure 1.1 Amino acid sequences of aECM proteins. Each aECM protein contained a T7 tag, a
hexahistidine tag, an enterokinase cleavage site, and elastin-like domains containing lysine
residues (italicized) for crosslinking. Constructs 1 and 2 containing the short RGD sequence were
developed by Julie Liu in our laboratory. Constructs 3 to 5 were designed and cloned in this work
and will be discussed in greater detail in Chapter 3. The full amino acid sequences of the
underlined cell binding domains in constructs 3 to 5 can be found in Figure 3.1.
Scrambled RGD domain
In our work and that of others, cell responses on RGD surfaces were never
identical to those observed on native fibronectin (50). An obvious strategy to improve
biological activity of the existing aECM proteins is hence to expand the cell binding
region to include full-length fibronectin domains. Efforts to expand on the biological
activity of the aECM proteins are described in Chapter 3.
1.4 Methods for studying wound healing
in vitro
In vitro wound healing assays have been used for decades to study the major
signaling transduction pathways in wound healing (51-54). These assays have also been
used to examine various mechanisms responsible for cell sheet movement (12-13, 15).
The most commonly used setup is the “scratch” wound assay, which is performed by
denuding an area of a confluent cell sheet using a small tool (e.g., pipette tip). The
method is simple but often results in wounds that vary significantly between experiments.
More importantly, the method is unsuitable for studying cell-material interactions. A
major challenge in designing wound healing assays for studying cell-material interaction
is to allow cells to form a confluent monolayer without modifying the underlying surface.
A “barrier” wound healing assay not only allow precise control the surface chemistry of
the wound area (54), it has also been shown to trigger wound responses similar to those
observed in the scratch wound assays (16, 55). Recently, microfabrication has provided
new tools for fabricating barriers (55), micropatterns (56), and microfluidic systems (57)
The in vitro “barrier” wound healing assay discussed in Chapter 2 was adapted
from the work of Nikolić et al. (55). We used a polydimethylsiloxane (PDMS) block to
protect the underlying aECM protein surface, while allowing cells to grow around it.
Fibronectin was also added to allow cells to spread on surfaces that do not support cell
attachment (i.e., BSA and aECM proteins containing a scrambled “RDG” sequence).
When cells grow to confluence, the PDMS slab is removed, exposing the wounded cell
sheet to the initial protein surface. The same assay was used again in Chapter 3 to
compare different protein surfaces. The “barrier” assay provided a convenient way to
examine cell-aECM interactions in vitro, but the wound areas were too large to allow the
visualization of the entire wound periphery.
Attempts to study cell decisions along the periphery of the wound prompted
further development of the wound healing assay. Using standard lithography methods, we
prepared PDMS blocks bearing micron-sized barriers to replace the previous PDMS
blocks. These patterns were made to create wounds of precise wound size and shape,
allowing a systematic study of the role of wound geometry in wound healing.
1.5 Thesis organization and description of contributions
The thesis reports efforts towards understanding the fundamentals of cell-ECM
interactions in wound healing. We studied extensively epithelial and fibroblast wound
healing; both play distinct roles in the process of wound healing. The aECM proteins
healing. More specifically, Chapter 2 examines corneal epithelial wound healing on
crosslinked aECM protein with varying RGD densities. Crosslinked aECM films were
produced by mixing aECM proteins with the RGD cell-binding domain and aECM
proteins containing the RDG scrambled control (Figure 1.1; constructs 1 and 2). I
developed and performed the wound healing experiments, and analyzed the experimental
data. The theoretical portion of this chapter was performed by Dr. Shelly Tzlil. Details of
the simulation and data analysis were discussed jointly with Dr. Tzlil. I designed and
performed all the experiments. We collaborated on writing the manuscript.
Another aspect of this work was focused on improving the design of the artificial
extracellular matrix protein (aECM) materials to accelerate wound healing. In Chapter 3,
I re-engineered the existing aECM protein constructs to incorporate full-length
fibronectin domains 9 and 10 (Figure 1.1, constructs 3 to 5). Rat-1 fibroblasts spread
rapidly on these aECM protein surfaces. More importantly, aECM proteins containing
full-length fibronectin domains 9 and 10 promoted rapid wound healing by supporting
cell migration and proliferation, comparable to native fibronectin. I designed, cloned, and
expressed these aECM proteins. I also performed all experiments and wrote the chapter.
Using the aECM protein containing fibronectin domain 10 (Figure 1.1; construct
4) as described previously, we look to further understand how cells select the wound
healing mechanism along the periphery of the wound. Chapters 4 and 5 resulted from
collaborations with Dr. Chin-lin Guo. We used standard photolithography methods to
create wound patterns with controlled wound size and geometry. I fabricated the master
Chapter 4 was co-written by Jiang Bor-yuan and Dr. Guo. I acquired and analyzed all
experimental data. I performed all other experiments. Dr. Guo wrote the description of
the model while I wrote the experimental section. We co-wrote the rest of the chapter.
Chapter 5 describes how pre-disposing the cell sheets in a zigzag configuration
allows cells to exploit the contraction of actomyosin cables and accelerate wound
healing. I performed all the experiments and analyzed all the data with useful advice from
1.6 References
1. A. J. Singer, R. A. F. Clark, New Eng. J Med.341, 738 (1999).
2. C. Steele, Optometry Today, 28 (1999).
3. F. Grinnell, J. Cell Biochem.26, 107 (1984).
4. R. A. F. Clark et al., J. Invest. Dermatol.79, 264 (1982).
5. R. A. F.Clark et al., J. Invest. Dermatol.94, 128S (1990).
6. P. Friedl, Y. Hegerfeldt, M. Tusch, Int. J. Dev. Biol.48, 441 (2004).
7. P. Rorth, Trends in Cell Biol.17, 575 (2007).
8. R. B. Vaughan, J. P. Trinkaus, J. Cell Sci.1, 407 (1966).
9. P. Martin, S. M. Parkhurst, Development131, 3021 (2004).
10. M. J. Redd, L. Cooper, W. Wood, B. Stramer, P. Martin, Phil. Trans. R. Soc.
Lond. B.359, 777 (2004).
11. P. Martin, J. Lewis, Science360, 179 (1992).
12. R. Farooqui, G. Fenteany, J. Cell. Sci.118, 51 (2004).
13. X. Trepat et al., Nat. Phys. Lett.5, 426 (2009).
14. M. Zhao, B. Song, J. Pu, J. V. Forrester, C. D. McCaig, FASEB J.17, 397 (2003).
15. M. Bindschadler, J. L. McGrath, J. Cell Sci.120, 876 (2006).
16. E. R. Block et al., J. Biol. Chem.279, 24307 (2004).
17. K. Y. Chan, D. L. Patton, Y. T. Cosgrove, Invest. Opthalmol. Vis. Sci. 30, 2488
(1989).
18. W. M. Bement, P. Forscher, M. S. Mooseker, J. Cell. Biol.121, 565 (1993).
19. K. M. Bullard, M. T. Longaker, H. P. Lorenz, World J. Surg.27, 54 (2003).
20. Y. Danjo, I. K. Gipson, J. Cell Sci.111, 3323 (1998).
21. M. Tamada, T. D. Perez, W. J. Nelson, M. P. Sheetz, J. Cell. Biol.176, 27 (2007).
23. K. Watanabe, S. Nakagawa, T. Nishida, Invest. Opthalmol. Vis. Sci. 28, 205 (1987).
24. H. Brotchie, D. Wakefield, Australas J. Dermatol.31, 47 (1990).
25. R. Langer, D. A. Tirrell, Nature428, 487 (2004).
26. K. Hori et al., J. Control. Res.118, 169 (2007).
27. J. A. Hubbell, J. Control. Res.39, 305 (1996).
28. G. Maheshwari, A. Wells, L. G. Griffith, D. A. Lauffenburger, Biophys. J 76,
2814 (1999).
29. D. L. Livant et al., J. Clin. Invest.105, 1537 (2000).
30. L. Aucoin, C. M. Griffith, G. Pleizier, Y. Deslandes, H. Sheardown, J. Biomater.
Sci. Polymer Edn.13, 447 (2002).
31. A. Mardilovich, E. Kokkoli, Biomacromolecules5, 950 (2004).
32. U. Hersel, C. Dahman, H. Kessler, Biomaterials24, 4385 (2003).
33. J. A. Hubbell, Swiss Med. Wkly136, 387 (2006).
34. J. A. Neff, P. A. Tresco, K. D. Caldwell, Biomaterials20, 2377 (1999).
35. M. P. Lutolf, J. A. Hubbell, Nat. Biotechnol.23, 47 (2005).
36. M. D. Pierschbacher, E. Ruoslahti, Nature309, 30 (1984).
37. G. H. Altman et al., Biomaterials24, 401 (2003).
38. H. Kurihara, T. Morita, M. Shinkai, T. Nagamune, Biotechnol. Lett. 27, 665
(2005).
39. S. Zhang, Nat. Biotechnol.21, 1171 (2003).
40. D. W. Urry, J. Phys. Chem. B101, 11007 (1997).
41. K. Di Zio, D. A. Tirrell, Macromolecules36, 1553 (2003).
42. S. C. Heilshorn, K. A. Di Zio, E. R. Welsh, D. A. Tirrell, Biomaterials 24, 4245
(2003).
43. J. C. Liu, S. C. Heilshorn, D. A. Tirrell, Biomacromolecules5, 497 (2003).
45. I. S. Carrico et al., J. Am. Chem. Soc.129, 4874 (2007).
46. P. J. Nowatzki, C. Franck, S. A. Maskarinec, G. Ravichandran, D. A. Tirrell,
Macromolecules41, 1839 (2008).
47. P. J. Nowatzki, D. A. Tirrell, Biomaterials, 1261 (2003).
48. D. W. Urry, Angewandte Chemie-International Edition in English32, 819 (1993).
49. A. Panitch, T. Yamaoka, M. J. Fournier, T. L. Mason, D. A. Tirrell,
Macromolecules32, 1701 (1999).
50. H. B. Streeter, D. A. Rees, J Cell Biol105, 507 (1987).
51. G. Fenteany, P. J. T. Stossel Curr. Biol.10, 831 (2000).
52. Y. Matsubayashi et al., Curr. Biol.14, 731 (2004).
53. P. J. Sammak, L. E. Hinman, P. O. T. Tran, M. D. Sjaastad, T. E. Machen, J. Cell
Sci.110, 465 (1997).
54. R. van Horssen, N. Galjart, J. A. P. Rens, A. M. M. Eggermont, T. L. M. ten
Hagen, J. Cell. Biochem.99, 1536 (2006).
55. D. L. Nikolić, A. N. Boettiger, D. Bar-Sagi,J. D. Carbeck, S. Y. Shvartsman, Am J
Physiol Cell Physiol291, 68 (2006).
56. M. Poujade et al., Proc. Natl. Am. Soc. USA104, 15988 (2007).
57. A. D. van der Meer, K. Vermeul, A. A. Poot, J. Feijen, I. Vermes, Am. J. Physio.
Heart Circ. Physiol.298, H719 (2010).
2 THE ROLE OF BOUNDARY-CROSSING IN
EPITHELIAL WOUND HEALING
Abstract
The processes of wound healing and collective cell migration have been studied for
decades. Intensive research has been devoted to understanding the mechanisms involved
in wound healing, but the role of cell-substrate interactions is still not thoroughly
understood. Here we probe the role of cell-substrate interactions by examining in vitro
the healing of monolayers of human corneal epithelial (HCE) cells cultured on artificial
extracellular matrix (aECM) proteins. We find that the rate of wound healing is
dependent on the concentration of fibronectin-derived (RGD) cell-adhesion ligands in the
aECM substrate. The wound closure rate varies nearly six fold on the substrates
examined, despite the fact that the rate of migration of individual cells shows little
sensitivity to the RGD concentration (which varies 40-fold). To explain this apparent
contradiction, we study collective migration by means of a dynamic Monte-Carlo
simulation. The cells in the simulation spread, retract, and proliferate with probabilities
obtained from a simple phenomenological model. Results of the simulation reveal that
the overall wound closure rate is determined by the probability of crossing the boundary
between the matrix deposited underneath the cell sheet and the aECM protein.
Manuscript prepared for submission by Eileen Fong1, Shelly Tzlil,2 and David A. Tirrell1,2
(1) Department of Bioengineering, California Institute of Technology
2.1 Introduction
The collective migration of cells is fundamental to wound healing, morphogenesis
and many bioengineering applications. Wound healing in particular involves the
migration of cell sheets over adhesive surfaces. Two mechanisms of migration have been
identified in wound healing (1). First is the “purse string” mechanism where a marginal
actomyosin cable develops along the wound edge, and wound closure proceeds with
contraction of the actin belt (2). The second mechanism involves active spreading and
migration of cells at the wound edge, known commonly as “lamellipodial crawling”. The
latter mechanism is more commonly observed in vitro and has been characterized by
using scratch-wound models. In these models, cells experience an injury, which triggers
cell migration through various biochemical signaling events (3). It has also been argued
that the availability of free space is sufficient to initiate cell migration in the absence of
mechanical injury (4-6). Upon wounding, proliferation is up-regulated (7).
Adhesive cell-substratum interactions are required for sustained migration into the
wound area (8, 9). The rates of migration of individual cells are governed by surface
adhesivity in a biphasic fashion, at least under certain conditions (10). Surfaces modified
with adhesion ligands such as fibronectin (FN) (11, 12) and Arg-Gly-Asp (RGD)
peptides have been shown to facilitate wound healing, and it is reasonable to infer that the
observed increases in healing rates arise primarily from faster migration of individual
The substrates used in this work were prepared from artificial extracellular matrix
(aECM) proteins that combine domains derived from fibronectin and elastin (15) (Figure
A1). We and others have shown that such aECM proteins can be crosslinked to yield
materials with elastic moduli similar to those of natural elastins (13-15), and that
presentation of the fibronectin-derived RGD sequence promotes cell spreading and
adhesion (16-18).
Wound healing was examined in monolayers of human corneal epithelial cells
(HCE) cultured on aECM protein substrates that present controlled, varying densities of
the RGD sequence. HCE cells undergo rapid re-epithelization in vivo (19). Both the α5β1
and αvβ3 integrins, which bind RGD, are up-regulated by wounding (20). Crosslinked
films with varying RGD densities were prepared by mixing aECM proteins containing
RGD and “scrambled” (RDG) domains. Substrates are identified by specifying the
percentage of the RGD protein in the film (e.g., 100% RGD).
2.2 Materials and methods
Protein expression and purification
Standard methods for cloning, bacterial growth, protein expression, sodium
dodecyl sulfate-polyacrylamide gel electrophoresis (SDS-PAGE), and Western blotting
were used to prepare and characterize aE-RGD and aE-RDG (16). Typical yields of
protein obtained from 10 L fermentation cultures were approximately 500 mg. The molar
Preparation of spin-coated aECM Films
Round glass coverslips (12 mm diameter; No. 1, Deckgläser, Germany) were
sonicated in a mixture of ethanol and KOH for 15 min and rinsed several times with
distilled H2O. aECM protein solutions were prepared by dissolving mixtures of aE-RGD
and aE-RDG (100 mg/ml in ddH2O) for 3 4 h at 4 ºC. Protein solutions containing
2.5%, 5%, 20%, 35%, 50%, 70%, 75%, 80%, 90%, and 100% aE-RGD were prepared.
Bis[sulfosuccinimidyl] suberate (BS3) was used to crosslink the aECM protein substrates.
BS3 (2.0 mg; Pierce, Rockford, IL) was dissolved in 17 µl of sterile distilled H2O and
added to 150 l of protein solution, mixed, and centrifuged to remove bubbles. The
stoichiometric ratio of activated esters in BS3 to primary amines in the aECM proteins
was roughly 1:1. A 17 l volume of BS3-protein solution was then spin-coated on a 12
mm diameter round glass cover slip at 7000 rpm for 30 sec at 4 ºC. Each protein film was
stored overnight at 4 ºC before use.
Generation of aECM films containing boundaries
We prepared 100 µl of aECM protein solutions (25 mg/ml in distilled H2O)
containing 0%, 2.5%, 20%, 50%, and 100% aE-RGD and BS3 (0.29 mg in 2.5 µl ddH2O)
as previously described. The protein solution (17 µl) was spin-coated onto a 12 mm
diameter round glass coverslip at 5000 rpm 30 sec at 4 °C. Protein films were allowed to
dry overnight at 4 °C. Subsequently, 600 µl of aECM protein solution (15 mg/ml) was
mixed with 1.725 mg of BS3 dissolved in 12.75 µl distilled H2O. A small volume (2 µl)
spin-coated at 5000 rpm for 30 sec at 4 °C. Under these conditions, an interface was generated
between two distinct surface chemistries.
Characterization of substrates by atomic force microscopy (AFM)
Images and force curves were collected on an Asylum MFP-3D-BIO atomic force
microscope, with accompanying IGOR Pro v.5.05 software. Pyramidal-tipped silicon
nitride cantilevers (Veeco DNP-S) with nominal spring constant 0.58 N/m were used for
imaging. The tip of a pair of fine forceps was drawn lightly across the surface of the
protein film, prepared as described above, tearing away the protein along the scratch and
exposing the underlying glass substrate. The edge of the scratch was imaged by AFM
both dry and in water, and the thickness of the film was determined. Scans were made at
various positions along the scratch to obtain an average measurement. The average film
thickness was calculated by averaging the height measurements obtained from 5
positions, using the revealed glass as a baseline. Thicknesses measured on three separate
films were averaged.
For nanoindentation studies, tips with 600 nm SiO2 microspheres attached at the
tip end (Novascan Technologies, IA) were used (14). Protein films with pre-determined
thicknesses were immersed in water for at least 1 h at room temperature to allow
equilibrium water uptake. Both the films and the cantilever assembly were submerged in
water under ambient conditions during nanoindentation. Force curves were collected; the
instrument records z (piezo) displacement and force, the product of measured tip
nN relative to the contact point. The tip speed was 1 µm/sec, and data were collected at
0.5 Hz.
The spring constants of the tips used for nanoindentation were determined to be
about 0.3 N/m using thermal calibration in water. The Dimitriadis model (21) for
indentation of linear-elastic soft material films of finite height with a spherical indenter
was applied to the loading force data. Only force-indentation points between 20 nm and
10% maximum indentation were used to constrain the data to the near-linear response
range. The elastic modulus was obtained by averaging the calculated moduli at multiple
points in three separate films.
Human corneal epithelial (HCE) cell culture
Primary human corneal epithelial cells were obtained from ScienCell Research
Laboratories (San Diego, CA, #6510) and Cascade Biologics (Portland, OR, #C-019-5C).
All cells were maintained in serum-free EpiLife culture medium (with 60 M CaCl2,
Cascade Biologics) supplemented with Human Corneal Growth Supplement (HCGS
containing bovine pituitary extract, bovine insulin, hydrocortisone, bovine transferring,
and mouse epidermal growth factor, Cascade Biologics). Gentamicin (10 g/ml) and
amphotericin (0.25 g/ml) were also added to culture media. Serum-free EpiLife medium
was used in all experiments to exclude extracellular matrix proteins (i.e., fibronectin,
Cell spreading
Aliquots (500 l) of FN and BSA solutions were added to the wells of a
transparent 24-well plate (Falcon BD, VWR, Batavia, IL) and allowed to adsorb
overnight at 4 ºC. In these experiments, fibronectin (FN, 10 g/ml in PBS, Chemicon,
MA) was used as a positive control and bovine serum albumin (BSA, 2 mg/ml in PBS,
Sigma) was used as a negative control. Subsequently, wells were rinsed twice with
pre-warmed PBS solution and blocked with 500 l of 0.2 wt% heat-inactivated BSA solution
at room temperature for 30 min. At the same time, coverslips containing spin-coated
aECM protein films were mounted in empty wells by dotting sterile grease around the
circumference of the coverslips. Gentle pressure was applied to ensure firm adhesion to
the well. Finally, all wells were rinsed twice with pre-warmed PBS solution.
HCE cells were enzymatically passaged using 0.05 % Trypsin-0.25 % EDTA
(Cascade Biologics). To each well, 4.8 x 10⁴ cells were added together with 1 ml of fresh
EpiLife medium. The plates were swirled gently to prevent clustering of cells and placed
in an incubator at 37 ºC under 5% CO2/95 % air. Images of five random positions in each
well were acquired after 4 hours. 200 cells were traced for each surface using ImageJ and
their areas were recorded. Cells with projected areas above 300 m2 (based on the
average cell areas on BSA) were considered spread and the percentage of spread cells
Wound healing
The experimental setup was adapted from Nikolić et al. with modifications (6).
Slabs of polydimethylsiloxane (PDMS; Dow Corning, Midland, MI) were cast to 0.3 mm
thickness according to the manufacturer’s instructions. Briefly, PDMS was mixed at 10:1
PDMS base/curing agent ratio, poured into a 100 mm petri dish to 0.3 mm height,
degassed in a desiccator for at least 1 h and baked for at least 2 h at 65 C. Blocks of
PDMS with lateral dimensions roughly 2 mm x 2 mm were cut with a sterile scalpel,
sterilized with ethanol and air-dried. Use of thin (0.3 mm) blocks of PDMS allowed cells
to maintain confluence across the edge of the block and prevented contact between cells
and the underlying substrate surface.
The PDMS blocks were placed at the center of the coverslips containing
spin-coated aECM films. These coverslips were then subsequently mounted in 24-well tissue
culture plates by using sterile vacuum grease (Dow Corning, Midland, MI). To all wells,
500 l of FN was added overnight at 4 C to cover the entire surface to aid cell adhesion.
The next day, 2 x 10⁵ primary HCE cells were seeded into each well and allowed to grow
to confluence in 3 5 days. The medium was changed every two days. Once a confluent
monolayer formed, the PDMS blocks were lifted with sterile tweezers, creating a
wounded cell sheet. A schematic drawing of the experimental set up is shown in Figure
2.2A.
Each well was rinsed twice with fresh medium before the start of each experiment
to remove any cell debris. Meanwhile, a chamber was set up around the microscope to
sustain cells. A hole was made in the cover of one of the empty wells in the 24-well plate
and the air supply was attached to ensure that cells were maintained under the CO2/air
mixture. Water was also added to surrounding empty wells to prevent excessive
evaporation of the medium. Wound closure was followed for 30 h by time-lapse phase
contrast microscopy on a Nikon Eclipse TE300 microscope at 10 x magnification. Digital
images of at least 5 different spots of the wound edge for each substrate were acquired
every 15 min using MetaMorph v6.3.2 (Molecular Devices, Sunnyvale, CA).
The wound areas immediately after wounding (t = 0 h) and after 30 h (t = 30 h)
were traced manually using ImageJ v1.37 (NIH, USA, http://rsb.info.nih.gov/ij/). The
difference in the two areas was then divided by the length of the wound edge to yield the
distance traveled by the cell sheet. This distance was then divided by the total time (30 h)
to give the wound closure rate. The overall wound closure rates were obtained by
averaging the wound closure rates calculated from all the videos obtained from more than
three independent experiments.
Cell tracking was performed to explain the differences in overall wound closure
behaviors observed on surfaces with different RGD densities. Individual cells within the
cell sheet were also tracked manually using ImageJ, with MTrackJ, a plug-in created by
Meijering and colleagues at the University Medical Center Rotterdam, Netherlands
(http://www.bigr.nl/). Trajectories of individual cells were tracked frame by frame for the
determined by averaging the speeds calculated in each 15 min interval. Only the cells that
migrated on the test surface were included in the analysis.
The calculated cell speeds were slightly below the reported range of 60 80 µm/h
(19, 22). However, these differences could be characteristic of tissue culture monolayers
and the use of serum-free media.
Interface-crossing experiments
aECM surfaces containing substrate interfaces were mounted into the wells of a
24-well tissue culture plate. HCE cells (1 x 10⁴) were added to each well and allowed to
attach for 2 h at 37 °C at 5% CO2/ 95% air. Images of the interface at several positions on
the aECM film were acquired every 15 min for 24 h using phase contrast microscopy at
37 °C at 5% CO2/ 95% air.
Time-lapse videos were analyzed using ImageJ. We tracked cells that contacted
the interface and recorded the time spent at the interface before a “decision” was made
(i.e., the cell crossed the interface or moved away). We considered each encounter a
separate “event” (i.e., once the cell leaves the interface and re-contacts the interface
again, the timing restarts). The total amount of time spent at the interface and the
subsequent decision (i.e., to cross the interface or not) were recorded for at least 150
Statistical analysis
For all experimental data, the statistical significance of differences was estimated by
analysis of variance followed by the Tukey test. Differences were taken to be significant
at P ≤0.05.
2.3 Results and discussion
Dehydrated films were determined to be in the range of 192.64 19.27 nm (n =
70) in thickness; hydrated films were 349.15 26.27 nm (n = 36) thick. Based on
measured height differences, water content in hydrated films was estimated to be
approximately 45%. The elastic modulus of a hydrated film was determined to be 0.24
0.06 MPa (n = 21), which falls within the range previously determined for films of
similar aECM proteins (14). There were no discernible physical differences between
aE-RDG and aE-RGD films with varying RGD concentrations.
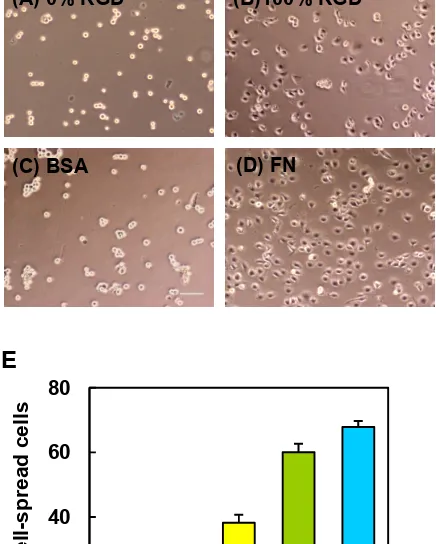
HCE cells were allowed to spread on spin-coated aECM films containing varying
RGD densities. After 4 h, HCE cells were well-spread on crosslinked 100% RGD and on
adsorbed FN, but remained rounded on the scrambled control (0% RGD) and on adsorbed
BSA surfaces (Figures 2.1A D). To quantify these differences, projected areas of 250
cells were measured at each of several time points over a 4 h period. Cells with projected
areas larger than 300 µm2 were considered well-spread. The percentage of well-spread
cells on aECM films increased with RGD density (Figure 2.1E). Although some cells
eventually spread on the scrambled control substrate, spreading on the control surface
E
Figure 2.1 HCE cell spreading behavior on various substrates. Phase contrast images of HCE
cells after 4 h on crosslinked spin-coated aECM films prepared from 0% RGD (A) or 100% RGD
(B), adsorbed bovine serum albumin (BSA, C) and adsorbed fibronectin (FN, D). Scale bar = 100
m. (E) Percent well-spread cells after 4 h on spin-coated aECM films with varying RGD
densities. Error bars represent SEM.
Conventional scratch wound assays are limited by interference from proteins
deposited by cells removed from the wound. Recent work of Nikolić et al. (6) and others
(25) showed that removal of a PDMS barrier triggered cell responses similar to those
0 20 40 60 80
0 20 50 80 100
Percent w
ell-spread
cells
% RGD
(A) 0% RGD (B)100% RGD
observed in scratch wound assays. Using a similar approach, we pre-coated glass
coverslips with the protein of interest and laid down a short PDMS slab to provide a
temporary platform for cell attachment. To facilitate cell attachment, fibronectin was
incubated in each well overnight prior to plating of HCE cells (Figure 2.2A). Removal of
the PDMS slab placed the edge of the wounded cell sheet in contact with the test surface.
HCE cells migrated collectively in the direction of the wound by lamellipodial
crawling on 100% RGD, consistent with previous reports (5, 26). On 2.5% RGD,
however, minimal advance of the cell sheet was observed, even though cells at the wound
edge were constantly extending protrusions (Figure 2.2B). Figure 2.3A shows the average
displacement of the cell sheet on various surfaces as a function of time. The overall
wound closure rate increases approximately 5.6-fold as the RGD density increases
(Figure 2.3B and Table A1). Individual cells within the cell sheet were also tracked for
the last 10 h of each video (Figure 2.3C). Cells were selected at random and only cells
that migrated on the test surface were included in the analysis. Surprisingly, the cells did
A
B
(1) 2.5% RGD (2) 100% RGD (3) 2.5% RGD (4) 100% RGD
0 h
10 h
18 h
30 h
C
Spreading
Retraction
Proliferation PDMS
peeled off Time Lapse
Microscopy Images of wound
edge were acquired every 15
minutes aECM protein
exposed aECM
protein Glass coverslip
Figure 2.2 (A) Schematic of wound healing experiment. Cross-linked aECM proteins were
spin-coated onto glass coverslips and mounted in tissue culture multi-well plates. A slab of PDMS was
laid on top of the protein film and fibronectin solution was allowed to adsorb overnight at 4 ºC to
aid cell attachment. HCE cells were grown to confluence and the PDMS was peeled off. The
protein film was rinsed twice with serum-free media and the wounded cell sheets were allowed to
migrate over the aECM protein. This process was monitored by time lapse microscopy. (B) Time
course wound healing on 2.5% RGD and 100% RGD substrates. (Panels 1 and 2) Experimental
images showing the progression of the wound edge on 2.5% and 100% RGD, respectively, at
various time intervals. (Panels 3 and 4) Comparative snapshots of wound edges for 2.5% RGD
and 100% RGD substrates. Cells that have divided are represented as red cells. The initial
positions of the wound edge (i.e., the position of the interface) are indicated by white lines in the
images at 30 h. (C) Schematic of the Monte-Carlo simulation. In the model, cells can either
spread with Wsto take up two lattice sites; retract to either one of the sites with Wr or undergo
proliferation with Wp.
This result was puzzling we expected the increase in wound closure rate with
RGD concentration to be a consequence of an increase in cell speed. How can the rate of
wound closure increase when cell speed does not? We imagined that the critical event
might be the “decision” made by each cell as it comes in contact with the test surface.
Does the cell cross to the test surface or retreat to the matrix deposited beneath the
confluent cell monolayer? If the rate of crossing depends on the adhesivity of the test
surface, it seemed likely that wound healing should occur more rapidly on surfaces
bearing higher RGD densities. In order to test this hypothesis, we performed computer
The surface was modeled as a 2D hexagonal lattice in which each lattice site was
either occupied by a cell or empty. Cell migration in the simulation proceeds via a
two-step mechanism; first, the cell spreads onto an adjacent lattice site, and then it retracts to a
single lattice site (Figure 2.2C). If retraction vacates the site occupied by the cell before it
spread, migration has occurred.
We define the x-axis as the axis perpendicular to the wound edge, and the initial
position of the wound edge (the boundary) as x = 0. Thus, in the initial configuration of
the simulation, cells occupy all the lattice sites whose x positions are smaller than zero,
and the rest of the sites are empty. As the simulation progresses, cells cross the boundary
into the wound area and the value of x at the wound edge position increases.
We denote the transition probabilities for spreading, retraction, and proliferation
by Ws, Wr, and Wp respectively. We use a simple model for spreading and retraction
behavior to estimate the values of Ws and Wr for the different surfaces, based on
experimental data (see supporting information for model details). Since FN is a major
component of the matrix deposited beneath the confluent monolayer, the probabilities for
spreading and retraction for lattice sites with x < 0 were taken to be those for FN. We
estimated the proliferation rate (Wp) by constructing rate equations according to the
simulation rules and solving them in the low cell concentration limit. The doubling time
was then compared to experimental data. Details of the simulation scheme can be found
Experiment Simulation
A D
B E
C F
0 100 200 300 400
0 10 20 30
Wound
edge displacement (µm)
Time (h) 100% 80% 50% 20% 2.5% 0 100 200 300 400
0 10 20 30
Wound
edge displacement (µm)
Time (h) 100% 80% 50% 20% 2.5% 0 2 4 6 8 10 12
0 20 40 60 80 100
Wound c los ure ra te (µ m/h) % RGD * * 0 2 4 6 8 10
0 20 40 60 80 100
Figure 2.3 Wound healing behavior observed in experiments (A to C) and simulations (D to F).
(A) Displacement of the wound edge for various surfaces over time. (B) Wound closure rate for
substrates with varying RGD densities. *, significant difference from 100% RGD (P < 0.05). (C)
Average cell speeds for individual cells migrating on the test surface for the last 10 h. (D)
Displacement of simulated wound edges as a function of time. (E) Wound closure rate as a
function of RGD percentage. The wound closure rate is five fold faster on 100% RGD than on
2.5% RGD, consistent with experimental observations. (F) Single cell speed as a function of
RGD concentration. Only cells on the test surface were included. Error bars represent SEM.
The cells in the simulation behaved similarly to those observed experimentally, in
the dynamic nature of their bonds and in the difference in cell behaviors observed on
surfaces that present different densities of RGD ligands. Figure 2.2B compares snapshots
taken from the simulation and from experiments for the 100% and 2.5% RGD surfaces.
The wound closure rates derived from the simulation are shown in Figure 2.3E. The
wound closure rate is defined as the average distance traveled by the wound edge per unit
time (Figure 2.3D). As observed experimentally, there is a 5.6-fold difference between
the wound closure rates on the 100% and on 2.5% RGD surfaces. Figure 2.3F shows the
single cell speeds calculated from the simulation for surfaces bearing various RGD
densities. At each time point, only cells on the test surface were included in the analysis.
The difference between the single cell speeds on 100% RGD and 2.5% RGD is only
1.9-fold.These observations are consistent with the experimental results, and confirm that the
The probability that a cell crosses the matrix boundary is given by its probability
to spread onto the RGD test surface multiplied by its probability to retract from the FN
surface, i.e., RGD FN
s r
W W . Hence, the ratio of the probabilities for crossing to the 100%
RGD and 2.5% RGD test surfaces is: PFN→100%RGD / PFN→2.5%RGD = Ws100%RGD/ Ws2.5%RGD = 5.3.
The second equality was obtained from the spreading rates used in the simulation. As
explained in detail in the supporting information, we used the cell spreading assay data
(Figure 2.1E) to determine these rates. Hence, the 5.3-fold difference in crossing
probability arises from the 5.3-fold difference in the rate of cell spreading. Following the
same logic, we can also explain the small differences in cell speed observed on surfaces
with different RGD concentrations. The ratio between single cell migration rates on
100% and 2.5% RGD is Ws100%RGD Wr100%RGD/ Ws2.5%RGD Wr2.5%RGD = 1.8.
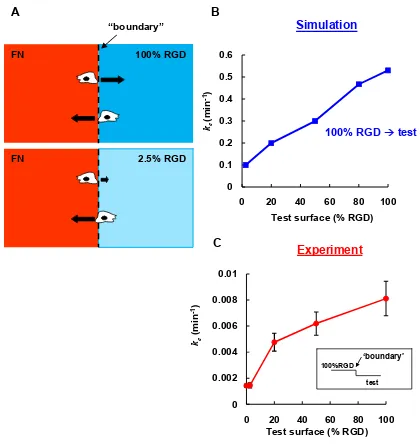
The simulation results suggest that the 5.6-fold variation in wound closure rates
observed experimentally arises primarily from variation in boundary-crossing rates
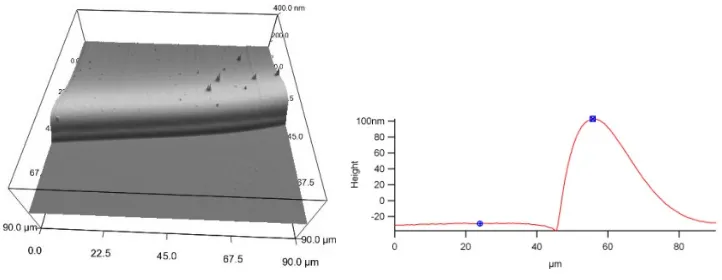
(Figure 2.5B and see supporting information, Figure A7). To measure boundary-crossing
rates directly, we prepared substrates by spin-coating one layer of aECM protein on top
of another (Figure 2.4). A typical surface used for studying the crossing probabilities was
Figure 2.4 Image of typical substrate with an interface imaged using an atomic force
microscope (left). A cross-section of the interface region is also shown (right).
Single HCE cells were seeded on these surfaces, and cells at the boundary were
followed by time-lapse microscopy. The total time in contact with the boundary and the
subsequent decision (i.e., to cross the boundary or not) were recorded for each cell. The
crossing rate was calculated by dividing the number of crossings by the total time in
contact with the boundary (see supporting information for crossing rate calculations).
The results confirm that the crossing rate increases 5.7-fold as the adhesivity of the
substrate increases (Figure 2.5C), supporting the hypothesis that the variation in wound
A B
[image:46.612.133.553.77.522.2]
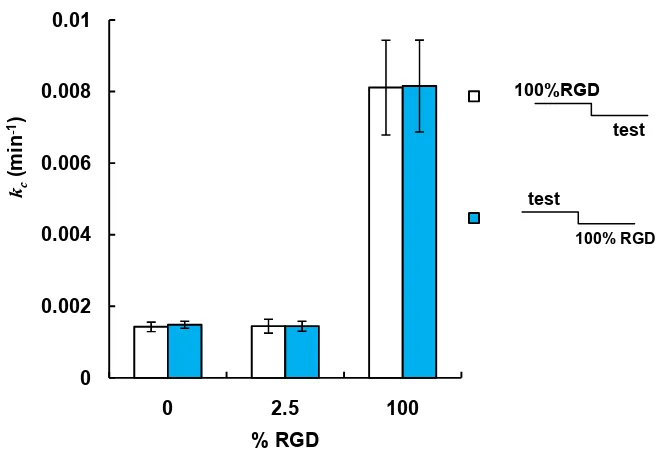
C
Figure 2.5 (A) Schematic representation of boundary crossing. Black arrows represent relative
crossing rates for each condition. (B and C) show the rate constants of crossing, kc (from 100%
RGD to the test surfaces) for simulation and experimental data, respectively. In both curves, the
crossing rates from 100% RGD to 100% RGD and from 100% RGD to 2.5% RGD differ by a
factor of five. Error bars in C are experimental errors (see supporting information for this
chapter). 0 0.1 0.2 0.3 0.4 0.5 0.6
0 20 40 60 80 100
kc
(m
in
-1)
Test surface (% RGD)
0 0.002 0.004 0.006 0.008 0.01
0 20 40 60 80 100
kc
(m
in
-1)
Test surface (% RGD)
FN 2.5% RGD
“boundary”
FN 100% RGD
Experiment
‘boundary’
test 100%RGD
Simulation
2.4 Conclusions
In summary, we find that the rate of healing of epithelial cell monolayers cultured
on aECM proteins increases with increasing density of adhesion ligands presented at the
substrate surface. As shown both experimentally and through simulation of the healing
process, the variation in healing rate arises not from variation in the rate of cell migration,
but instead from variation in the rate at which cells cross the boundary between the
matrix deposited by the cell monolayer and the aECM protein. The simulation method
described here can be applied to many cell types, and through variation in the cell-cell
interaction energy (see supporting information) captures a broad range of wound
healing behavior, from diffusion-like behavior in which cell-cell contacts break and
reform (as observed for corneal epithelial cells) to behavior that resembles that of an
elastic sheet in which cell-cell contacts remain unchanged during wound healing (as
2.5 Acknowledgements
We acknowledge Drs. Julie Liu, Paul Nowatzki, and Stacey Maskarinec for help
with protein expression and cell culture. We also thank Dr. Zhen-Gang Wang for useful
advice on the simulation model. E.F. is supported by the Nanyang Overseas Scholarship,
Singapore; S.T. is supported by the Human Frontier Science Program Cross-Disciplinary
Fellowship. This work is funded by the NSF Center for the Science and Engineering at
Caltech and by NIH grant EB1971.
2.6 References
1. P. Martin, J. Lewis, Science360, 179 (1992).
2. W. M. Bement, P. Forscher, M. S. Mooseker, J. Cell. Biol.121, 565 (1993).
3. P. J. Sammak, L. E. Hinman, P. O. T. Tran, M. D. Sjaastad, T. E. Machen, J. Cell
Sci.110, 465 (1997).
4. M. Poujade et al., Proc. Natl. Acad. Sci. U.S.A.104, 15988 (2007).
5. E. R. Block, A. R. Matela, N. SundarRaj, E. R. Iszkula,J. K. Klarlund, J. Biol.
Chem.279, 24307 (2004).
6. D. L. Nikolic, A. N. Boettiger, D. Bar-Sagi, J. D. Carbeck, S. Y. Shvartsman, Am.
J Physiol. Cell Physiol.291, 68 (2005).
7. G. J. Todaro, G. K. Lazar, H. Green, J. Cell Physiol.66, 325 (1965).
8. K. Suzuki, J. Saito, R. Yanai, N. Yamada, T. Chikama, K. Seki, T. Nishida, Prog.
Ret. Eye Res.22, 113 (2003).
9. R. A. F. Clark, J. Invest. Dermatol.94, 128S (1990).
10. S. P. Palecek, J. C. Loftus, M. H. Ginsberg, D. A. Lauffenburger, A. F. Horwitz,
Nature385, 537 (1997).
12. R. van Horssen, N. Galjart, J. A. P. Rens, A. M. M. Eggermont, T. L. M. ten
Hagen, J. Cell Biochem.99, 1536 (2006).
13. L. Aucoin, C. M. Griffith, G. Pleizier,Y. Deslandes, H. Sheardown, J. Biomater.
Sci. Polymer Edn.13, 447 (2002).
14. P. J. Nowatzki, D. A. Tirrell, Biomaterials, 1261 (2003).
15. K. Di Zio, D. A. Tirrell, Macromolecules36, 1553 (2003).
16. J. C. Liu, S. C. Heilshorn, D. A. Tirrell, Biomacromolecules5, 497 (2003).
17. S. C. Heilshorn, K. A. Di Zio, E. R. Welsh, D. A. Tirrell, Biomaterials 24, 4245
(2003).
18. J. C. Liu, D. A. Tirrell, Biomacromolecules9, 2984 (2008).
19. L. Luo, P. S. Reinach, W. W. Y. Kao, Exp. Biol. Med. Vol.226, 653 (2001).
20. M. A. Stepp, Exp. Eye Res.83, 3 (2006).
21. E. K. Dimitriadis, F. Horkay, J. Maresca, B. Kachar, R. S. Chadwick, Biophys. J.
82, 2798 (2002).
22. M. Zhao, B. Song, J. Pu, J. V. Forrester, C. D. McCaig, FASEB J.17, 397 (2003).
23. M. D. M. Evans, J. G. Steele, J. Biomed. Mater. Res.40, 621 (1997).
24. M. D. M. Evans, J. G. Steele, Exp. Cell Res.233, 88 (1997).
25. K. Y. Chan, D. L. Patton, Y. T. Cosgrove, Invest. Opthalmol. Vis. Sci. 30, 2488
(1989).
ADDITIONAL INFORMATION FOR CHAPTER 2
A
M-MASMTGGQQMG-HHHHHHH-DDDDK (LD-YAVTGRGDSPASSKIA ((VPGIG)2VPGKG(VPGIG)2)4VP)3-LE
T7 tag His tag cleavage RGD cell-binding Elastin-like repeats
B
M-MASMTGGQQMG-HHHHHHH-DDDDK (LD-YAVTGRDGSPASSKIA ((VPGIG)2VPGKG(VPGIG)2)4VP)3-LE
[image:50.612.110.522.152.223.2]Scrambled RGD
Figure A1. Amino acid sequences of aECM proteins containing (A) RGD and (B) RDG
cell-binding domains. Each aECM protein contained a T7 tag, a hexahistidine tag, an enterokinase
cleavage site, and elastin-like domains containing lysine residues (italicized) for crosslinking. domain
Figure A2. Rate constants of interface crossing, kc from 100% RGD into various test
surfaces. The crossing probabilities computed for both configurations of the interface. There
were no significant differences between the rate constants for the two configurations of each test
surface, suggesting that the small “step” at the interface did not affect the boundary-crossing rate. 0
0.002 0.004 0.006 0.008 0.01
0 2.5 100
kc
(m
in
-1)
% RGD
1
2
100%RGD
test
test
Mathematical model
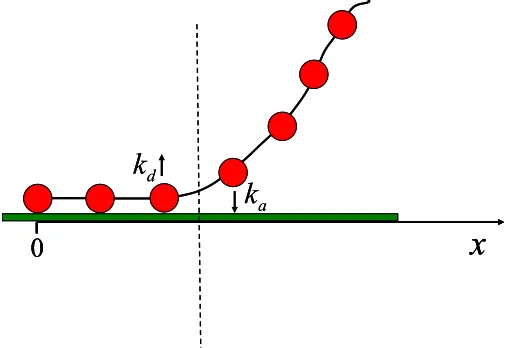
[image:52.612.179.432.137.311.2]A simple model for spreading and retraction
Figure A3. A schematic illustration of the cell spreading and retraction model. The beads
represent integrin receptor clusters, while the chain represents the cell membrane. The cell edge is
represented by the dashed line. Receptor clusters adjacent to the cell edge can adsorb or desorb
with rate constants ka and kd respectively.
We use a simplified picture for cell spreading and retraction in order to estimate
numerical values for the speed of these processes. In Fig. A3, the cell membrane is
modeled as a chain of beads which represent integrin receptors or clusters. Both
spreading and retraction advance through adsorption and desorption of receptor clusters
at the ligand-bearing surface. Only the receptor clusters adjacent to the cell edge
(represented by the dashed line in Fig. A3) can adsorb or desorb. The rate constants for
adsorption and desorption are ka and kd, respectively.
a
k
d
k
0
x
a
k
d