72:2 (2015) 1–6 | www.jurnalteknologi.utm.my | eISSN 2180–3722 |
Full paper
Jurnal
Teknologi
Assessing Statistical Reasoning in Descriptive Statistics: A Qualitative
Meta-analysis
Shiau Wei Chan*, Zaleha Ismail, Bambang Sumintono
Department of Production and Operation Management, Faculty of Technology Management and Business, Universiti Tun Hussein Onn Malaysia, 86400 Parit Raja, Batu Pahat, Johor, Malaysia
Department of Educational Mathematics, Science and Multimedia Creative, Faculty of Education, Universiti Teknologi Malaysia, 81310 UTM Johor Bahru, Johor, Malaysia
Institute of Educational Leadership, Deputy Vice Chancellor(Academic & International), University of Malaya, 50603 Kuala Lumpur,Malaysia
*Corresponding author: [email protected]
Article history
Received :15 June 2014 Received in revised form : 15 September 2014 Accepted :15 October 2014
Graphical abstract
Abstract
To date, there are abundant studies on statistical reasoning in descriptive statistics and inferential statistics. Nevertheless, the types of statistical reasoning assessments used in those studies are different from each other. Hence, this qualitative meta-analysis is aimed to explore the methods utilized in assessing statistical reasoning among students from all levels in descriptive statistics. A total of 36 studies on reasoning about measures of central tendency, variability and distribution were found and reviewed in this paper. It was noticed that six major types of methods were employed to assess students’ statistical reasoning in descriptive statistics, namely interview, survey or questionnaire, tasks, tests, minute paper, and teaching. This study contributes considerably to the statistical reasoning area as it provides new information on statistical reasoning in descriptive statistics. For future studies, some recommendations are proposed to improve statistical reasoning assessments.
Keywords: statistical reasoning; descriptive statistics; qualitative meta-analysis
© 2015 Penerbit UTM Press. All rights reserved.
1.0 INTRODUCTION
Educational assessment is a tool and a way of managing the educational practice, besides serving as a response and information about correct or incorrect learning methods [1]. Pellegrino, Chudowsky and Glaser [2] affirmed the three intentions of the assessment, which are to determine individual achievement, evaluate programs and support student learning. There are two types of educational assessments, i.e. formative assessment and summative assessment. Formative assessment is a planned process that regularly determines students’ understanding in the instructional activities [3]. Meanwhile, summative assessment is a cumulative assessment that may generate an ultimate grade at the end of the course [4]. In statistics education, there are several types of assessments accessible in the market, for instance the statistical reasoning assessment (SRA), Comprehensive of Assessment of Outcomes in a First Statistics Course (CAOS), Assessment Resource Tools for Improving Statistical Thinking (ARTIST), and so on. However, the instructors tend to use traditional assessments in the statistics classroom instead of alternative assessments, which are incapable of guiding students to reason statistically [5].
Since the 1990s, a significant move has occurred from procedural understanding towards engendering conceptual understanding in the statistics education. It means that the researchers and instructors began to guide students to reason statistically rather than focusing only on calculation, procedures and skills. In fact, statistical reasoning has become known from the 20th century. In the 1970s, researchers gave emphasis to the growth and testing on cognitive science theories to elucidate the misconceptions in statistical reasoning. Nevertheless, those cognitive science theories were not employed to improve the teaching and learning until the 1980s. After that, those empirical works were implemented to investigate the statistical reasoning of the students in the classroom. Beginning from the 1990s, the content of textbooks was altered to emphasize more on conceptual understanding rather than procedural understanding. Moreover, the teaching approaches had been transformed to foster students’ statistical reasoning, for instance through simulations and hands-on activities [6]. However, these transformations could not be achieved without the support from previous researches in statistical reasoning.
the statistical reasoning of the students from primary, secondary, and tertiary level. Thus, the qualitative meta-analysis of this study is to explore the methods used in assessing statistical reasoning among students from all levels, particularly in descriptive statistics.
2.0 ASSESSING STATISTICAL REASONING IN DESCRIPTIVE STATISTICS
Statistical reasoning is defined as “the way people reason with statistical ideas and make sense of statistical information. It involves making interpretations based on sets of data or statistical summaries of data where students need to combine ideas about data and have a chance to make inferences and interpret statistical results” [7]. Lovett [6] asserted that statistical reasoning involves the utilization of statistical concepts and tools to recapitulate the situation, draw conjectures and make conclusions from the data. Furthermore, Martin [8] characterized statistical reasoning as formulating judgments and conclusions based on the data from sample surveys, observational studies, or experiments.
Descriptive statistics include measures of central tendency, variability and distribution. Measures of central tendency are the main component in conjecturing data analysis and graphs as well as in comprehending the idea of distribution [9]. It comprises of mean, median, and mode. Mean is the total sum of observation divided by the overall observations. Meanwhile, the median is the middle value of a set of data and the mode is the highest frequency. Some statisticians deemed the average as a measure of central tendency, which comprises of mean, median and mode [10]. Nevertheless, Konold and Pollastek [11,12] disputed that the term “average” has dissimilar interpretations based on the context of the problem and it could be examined as either fair share [13], data reduction [13], typical value [14], or signal in noise [14]. Mokros and Russell [15] described ‘average’ as a way to elucidate and summarize as well as to compare data sets. In mathematics curriculum, ‘average’ is viewed as a synonym for arithmetic mean [16].
On the other hand, ‘dispersion’ and ‘spread’ are the synonyms of variability. It includes range, variance, standard deviation and interquartile range. The square root of the variance is the standard deviation. The range is the subtraction of the highest value with the lowest value while the interquartile range is the subtraction of the third quartile with the first quartile. ‘Variability’ and ‘variation’ can be utilized interchangeably, but Reading and Shaughnessy [17] judged them in a different way, where variability is the apparent attribute of the entity and variation concerns demonstrating or assessing that attribute. Distribution is always associated to the conceptual knowledge of variability [18] and the variability of the data is determined via the distribution that acts as the lens [19]. Reasoning about measures of central tendency and reasoning about variability are recognized by Garfield and Gal [20] as reasoning about statistical measures. This reasoning is about understanding what a particular position, measures of central tendency and variability can inform about a set of data; which is the best reasoning to be employed; and whether it represents a set of data logically or not. It is also about knowing a good summary of data can make the comparison of the measures of central tendency and variability easier.
Furthermore, distribution is perceived as one of the primary and essential ‘big ideas’ in statistics [9]. Distribution can be
classified into two major types, i.e., theoretical distribution and empirical distribution [19]. Theoretical distribution entails differentiating or showing a probability model including normal distribution while empirical distribution allows us to observe the variation in the data directly. Measures of central tendency, shape and spread are the general characteristics of such distribution [9]. Reasoning about distribution is defined as the analysis of compound structure including features such as measures of central tendency, spread, skewness, outliers, and density [21] as well as ideas like sampling, causality, chance, and population [22]. There are numerous methods to signify the distribution of data sets. For example, a dot plot or histogram can be employed to portray the shape of a data set, while a box plot is better utilized to demonstrate an outlier and a stem-and-leaf plot can be used to illustrate the clumps or gaps in the distribution [9]. The exploitation of graphical representations is a proficient way to enhance students’ conceptual understanding of distribution [23].
3.0 METHODOLOGY
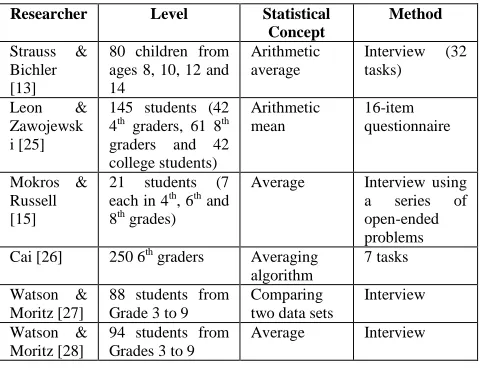
[image:2.612.324.564.534.718.2]This study intends to examine the methods utilized in assessing statistical reasoning among the students in descriptive statistics. Therefore, a qualitative meta-analysis was performed by using the literature search process of Blumberg, Cooper & Schindler [24] which are: (i) build up a pool of potential information using various databases including Google Scholar, ProQuest, Web of Science, ERIC and Science Direct; (ii) use filter to diminish pool size, such as focusing on peer-reviewed publications; (iii) make a rough assessment of sources to further diminish pool size, for example classifying studies into crucial, probably crucial and not crucial; (iv) analyze literature in pool according to theories, respondents, instruments, methods, and the findings; and (v) refine filters (try new search terms) or stop search. In this study, the inclusion criteria of the studies that were utilized are: (a) content relevancy – the studies on assessing statistical reasoning in descriptive statistics including measures of central tendency, variability and distribution; (b) Year of publication – 1988 to 2012; (c) Language – English language. As a result, a total of 36 studies were reviewed in this study, as shown in Table 1.
Table 1: Studies of assessing statistical reasoning in descriptive statistics
Researcher Level Statistical Concept
Method
Strauss & Bichler [13]
80 children from ages 8, 10, 12 and 14
Arithmetic average
Interview (32 tasks) Leon &
Zawojewsk i [25]
145 students (42 4th graders, 61 8th
graders and 42 college students)
Arithmetic mean
16-item questionnaire
Mokros & Russell [15]
21 students (7 each in 4th, 6th and
8th grades)
Average Interview using a series of open-ended problems Cai [26] 250 6th graders Averaging
algorithm
7 tasks Watson &
Moritz [27]
88 students from Grade 3 to 9
Comparing two data sets
Interview Watson &
Moritz [28]
94 students from Grades 3 to 9
Researcher Level Statistical Concept
Method
Torok & Watson [29]
16 students from grades 4, 6, 8 and 10
Variation Interview
Batanero, Cobo & Diaz [30]
2 samples of 14 years old (n=168) and 16 years old (n=144)
Average Questionnaire with 9 open-ended tasks Watson et
al. [31]
746 students in grades 3, 5, 7, and 9
Variation Questionnaire
Makar & Confrey [32]
22 prospective secondary math and science teachers
Information notions of variation and distribution
Interview
Reading & Shaughness y [17]
6 students from primary school and 6 students from secondary school
Variation Interview
Reading [33]
Students in Grades 7, 9, and 11 (aged 13 to 17)
Variation Task set in a real world context Makar &
Confrey [34]
4 secondary teachers
Comparing two groups
Interview using Fathom software Groth [35] 15 high school
students
Measures of central tendency
Problem solving clinical interview delMas &
Liu [36,37]
12 university students
Standard deviation
Interview using conceptually enhanced software Reading &
Reid [38]
46 university students
Exploratory data analysis, probability, sampling distributions and inferential reasoning
Using minute papers
Groth & Bergner [39]
46 preservice elementary school teachers
Mean, median and mode
Questionnaire
Cruz & Garrett [40]
94 secondary students aged 17 years old
Average Open and multiple-choice questions Leavy &
O’Loughlin [41]
263 preservice teachers
Mean Using a questionnaire consisting of the five tasks and individual clinical interview Reading &
Reid [42]
57 university students
Exploratory data analysis, probability, sampling distributions and inferential reasoning
Using minute papers
Reid & Reading [43]
32 students (pre-study) and 23 students (post-study)
Variability, comparing data sets, sampling and probability
Questionnaire
Pfannkuch [44]
1 secondary teacher
Comparing box plot distribution
Teaching of a Year 11 (15-year-old) class
Researcher Level Statistical Concept
Method
Reading & Reid [45]
6 tertiary students (pre-interviews) and 4 students (post-interviews)
Variability, comparing data sets, sampling and probability
Interview
Sharma [46]
24 pre-service teacher education students
Variability Questionnair e
Watson, Callingham & Kelly [47]
73 students (18 from Grade 3, 18 from Grade 5, 15 from Grade 7, 15 from Grade 9, 7 six-year-old children) Expectation and variation In-depth interview tasks Ciancetta [48] 275 undergraduate and graduate students
Comparing distribution of data
Task-based web survey and interview Cruz &
Garrett [49]
227 students (130 aged between 16 and 21 years old from secondary school and 97 aged between 22 and 49 years old from university)
Arithmetic mean
Questionnair e with open-ended and multiple-choice questions
Sharma [50]
29 students aged 14 to 16 years
Average Interview using open-ended and close questions Reid &
Reading [51]
46 tertiary students
Describe and compare distributions; one-way analysis of variance, simple linear regression
Using class test and assignment questions
Canada [52]
50 middle school (24 7th graders and
26 6th graders)
students and 58 pre-service teachers
Compare two data sets
Task using the aspects of average and variation
Watson [53]
109 students aged from 6 to 15
Variation 3 interview protocol Sirnik &
Kmetic [16]
27 18-year-old students and 20 13-year-old students
Arithmetic mean
10-item test and 7-item test Chatzivasil
eiou, Michalis & Tsaliki [54]
109 4th and 6th
grade students
Arithmetic mean
Questionnair e
Peters [55] 16 secondary mathematics/statis tics teacher-leaders
Variation Semi-structured content interview with 3 main tasks Turegun &
Reeder [56]
41 students from two introductory statistics course
Variability 9-item multiple-choice questionnaire Jacobbe
[57]
3 elementary school teachers
Mean and median
Interviews, questionnaire s,
4.0 FINDINGS AND DISCUSSION
Based on the meta-analysis, there were six main types of methods utilized to assess students’ statistical reasoning in descriptive statistics, i.e. interview, survey or questionnaire, tasks, tests, minute paper, and teaching. Among these four methods, interview was the most used methods by the researchers, as 47.2% from the studies (17 out of 36) employed the interview method. This is mostly because by using interview method, the researchers are able to investigate and probe the responses of the respondents in order to collect in-depth information about their feelings and experiences [58]. On the contrary, teaching is the least used method for researchers to assess statistical reasoning among the participants. It was only used in one out of 36 studies (0.03%). Other methods are survey or questionnaire (12 studies), tasks (3 studies), tests (3 studies), and minute paper (2 studies). On the other hand, there were only three out of 36 studies (0.08%) that involved the usage of information technology in assessing reasoning about variability and distribution. It means that a majority of the studies did not utilize information technology in the assessments.
There were some previous studies that have been carried out to assess students’ reasoning about measures of central tendency as shown in Table 1. It seems that all researchers had exploited qualitative techniques to evaluate students’ reasoning about measures of central tendency, including the usage of interview and open-ended problems. Five were executed on secondary school students, two of the studies were executed on primary school students while three were executed on both primary and secondary school students. Meanwhile, two studies were executed on preservice teachers, one was executed on teachers, one was executed on both secondary school and university students, and one was executed on primary school, secondary school and college students.
Table 1 reveals some previous studies that have been performed to assess the reasoning about variability among students and teachers. These are made up of qualitative evaluation approaches that include interview, open-ended tasks, and questionnaire. There are some other approaches utilized as well. For example, delMas and Liu [36] used a technological tool in their interview while Reading [33] made use of a real-world task. There were seven studies that involved university students as their respondents. Five studies were conducted on primary and secondary school students, one was secondary school students, one was on school teachers and one was on preservice teachers. On the other hand, Table 1 demonstrates a number of methods employed to assess reasoning about distribution among students and teachers including tasks, interview, and project. Three out of six studies involved teachers as the participants, while others involved primary school and secondary school students (one study), university students (one study), and secondary school students and preservice teachers (one study).
The current meta-analysis revealed that there were a lot of assessments used to assess students’ reasoning about measures of central tendency, variability and distribution. However, most of the assessments were traditional assessments such as paper-and-pencil tasks and multiple-choice questions. Some traditional forms of assessments were not designed to align with the recent curriculum and instructional goals; hence they cannot provide a clear picture of students’ understanding and knowledge. Not only that, they were also too restricted to assess students’
understanding [59]. Thus, it is proposed to integrate information technology in the statistical reasoning assessments to construct new and different assessments in future research. These days, the utilization of information technology in the assessment is gradually becoming crucial to improve pedagogical innovation and curriculum reformation [60]. Appropriate usage of information technology can promote students’ statistical understanding [61] as well as facilitate the statistical process, including posing questions, gathering and analyzing data as well as interpreting the findings [62].
In fact, there are many advantages in using information technology in statistics classes. One of the benefits is that it can mitigate time and burden of students to handle tedious and cumbersome calculations when dealing with a wide array of data. This enables students to have adequate time to explore, analyze and interpret data [63]. Another benefit is that information technology can assist students to understand the abstract idea of statistics. Students could display and visualize data sets in multiple graphical representation forms such as histograms and box plots by using a computer [9], thus enhancing their understanding of statistical data, analysis, and graph as well as eradicate their misconceptions [64]. Pratt, Davies and Connor [65] argued that graphical representations that are generated by computers are not merely used as presentation tools, but also as analytical tools in data investigation. Furthermore, utilization of computer in distance learning enables students to work on their own pace outside the classroom as the web-based resources are always obtainable [66]. They can simply access the resources at any time and any place they desire as well as communicate among themselves conveniently via email [67].
On the other hand, this meta-analysis indicates that almost all the studies only focused on one concept of statistical reasoning. Hence, it is recommended that three statistical reasoning topics (reasoning about measures of central tendency, variability, and distribution) are integrated into one assessment for further investigation in this area. Even though the researchers and instructors have begun to emphasize on central statistical concepts or ‘big ideas’ in teaching and learning statistics [9], the incorporation of these central statistical concepts into assessment is still inadequate and many students still cannot see how these concepts are interconnected [68]. By combining these three statistical reasoning, students can see these concepts as a whole entity rather than as isolated concepts [69]. Besides, it also promotes their conceptual understanding on statistical concepts and reduces their misconceptions in statistical reasoning.
5.0 CONCLUSIONS
Acknowledgement
The authors would like to thank for the support given to this research by Universiti Tun Hussein Onn Malaysia (UTHM), under grant Vot: U365.
References
[1] Vasasova, Z. 2010. The influence of criterion-referenced assessment on
students’ attitudes towards education. The New Educational Review. 20(1): 261-274.
[2] Pellegrino, J. W., Chudowsky, N. & Glaser, R. 2001. Knowing what Students Know: The Science and Design of Educational Assessment. Washington, DC: National Academy Press.
[3] Williams, D. 2008. Changing Classroom Practice. Educational
Leadership. 65(4): 36-41.
[4] Van De Walle, J. A., Karp, K. S., & Bay-Williams, J. M. 2010.
Elementary & Middle School Mathematics: Teaching Developmentally (7th Ed.). Boston, MA: Pearson.
[5] Zieffler, A., Garfield, J., Alt, S., Dupuis, D., Holleque, K. & Chang, B. 2008. What does Research Suggest about the Teaching and Learning of Introductory Statistics at the College Level? A Review of the Literature. Journal of Statistics Education. 16(2).
[6] Lovett, M. (2001). A Collaborative Convergence on Studying
Reasoning Processes: A Case Study in Statistics. In Klahr, D. & Carver, S. (Eds.). Cognitive and Instruction: Twenty-five Years of
Progress (pp. 347-384). Mahwah, NJ: Lawrence Erlbaum.
[7] Garfield, J. & Chance, B. 2000. Assessment in Statistics Education: Issues and Challenges. Mathematical Thinking and Learning, 2(1and2), 99-125.
[8] Martin, G. 2009. Focus in School Mathematics: Reasoning and Sense
Making. National Council of Teachers of Mathematics.
[9] Garfield, J. B. & Ben-Zvi, D. 2008. Developing Students’ Statistical Reasoning: Connecting Research and Teaching Practice. Springer.
[10] Carter, T. A. 2005. Knowledge and Understanding of Probability and Statistics Topics by Preservice PK-8 Teachers. Doctor Philosophy. Texas A and M University.
[11] Konold, C. & Pollastek, A. 2002. Data Analysis as the Search for Signals in Noisy Processes. Journal for Research in Mathematics Education. 33(4): 259-289.
[12] Konold, C. & Pollastek, A. 2004. Conceptualizing an average as a stable feature of a noisy process. In Ben-Zvi, D. & Garfield, J. (Eds.), The challenge of developing statistical literacy, reasoning, and
thinking (pp. 169-199). The Netherlands: Kluwer Academic Publishers.
[13] Strauss, S. & Bichler, E. 1988. The Development of Children’s
Concept of the Arithmetic Average. Journal for Research in
Mathematics Education. 19(1): 64-80.
[14] Konold, C. & Garfield, J. 1992. Statistical Reasoning Assessment: Part 1. Intuitive Thinking. Scientific Reasoning Research Institute. University of Massachusetts, Amherst, MA.
[15] Mokros, J. & Russell, S. J. 1995. Children’s Concepts of Average and Representativeness. Journal for Research in Mathematics Education. 26: 20-39.
[16] Sirvik, M. & Kmetic, S. 2010. Understanding of Arithmetic Mean. Proceedings of the 8th International Conference on Teaching Statistics (ICOTS-8). July 11-16. Ljubljana, Slovenia.
[17] Reading, C. & Shaughnessy, M. 2004. Reason about Variation. In Ben-Zvi, D. & Garfield, J. (Eds.) The Challenge of Developing Statistical Literacy, Reasoning, and Thinking (pp. 201-226). The Netherlands: Kluwer Academic Publishers.
[18] Pfannkuch, M. & Reading, C. 2006. Reasoning about Distribution: A Complex Process. Statistics Education Research Journal. 5(2): 4-9. [19] Wild, C. 2006. The Concept of Distribution. Statistics Education
Research Journal. 5(2): 10-26.
[20] Garfield, J. B. & Gal, I. 1999. Assessment and Statistics Education: Current Challenges and Directions. International Statistical Review. 67(1): 1-12.
[21] Bakker, A. & Gravemeijer, K. P. E. 2004. Learning to Reason about Distribution. In Ben-Zvi, D. & Garfield, J (Eds.). The Challenge of Developing Statistical Literacy, Reasoning, and Thinking (pp. 147-168). Dordrecht, The Netherlands: Kluwer Academic Publishers. [22] Pfannkuch, M. & Reading, C. 2006. Reasoning about Distribution: A
Complex Process. Statistics Education Research Journal. 5(2): 4-9. [23] Sovak, M. M. 2010. The Effect of Student-driven Projects of the
Development of Statistical Reasoning. Doctor Philosophy, Unversity of Pittsburgh.
[24] Blumberg, B., Cooper, D. R., & Schindler, P. S. 2011. Business
research methods 3rd Edition. Berkshire: McGraw-Hill Education.
[25] Leon, M. R. & Zawojewski, J. S. 1990. Use of Arithmetic Mean: An Investigation of Four Properties Issues and Preliminary Results. Proceedings of the Third International Conference on Teaching Statistics. Dunedin, New Zealand.
[26] Cai, J. 1998. Exploring Students’ Conceptual Understanding of the Averaging Algorithm. School Science and Mathematics. 98(2): 93-98. [27] Watson, J. M. & Moritz, J. B. 1999. The Beginning of Statistical
Inference: Comparing Two Data Sets. Educational Studies in
Mathematics. 37: 145-168.
[28] Watson, J. M. & Moritz, J. B. 2000. The Longitudinal Development of
Understanding of Average. Mathematical Thinking and Learning,
2(1and2): 11-50.
[29] Torok, R. & Watson, J. 2000. Development of the Concept of Statistical
Variation: An Exploratory Study. Mathematics Education Research
Journal. 12(2):147-169.
[30] Batanero, C., Cobo, B. & Diaz, C. 2003. Assessing Secondary School
Students’ Understanding of Averages. Proceedings of CERME 3,
Bellaria, Italia.
[31] Watson, J. M., Kelly, B. A., Callingham, R. A. & Shaughnessy, J. M. 2003. The Measurement of Statistics Students’ Understanding of Variation. Canadian Journal of Science, Mathematics, and Technology Education. 34: 1-29.
[32] Makar, K. & Confrey, J. 2003. Chunks, Clumps and Spread Out: Secondary Pre-service Teachers’ Notions of Variation and Distribution. In Lee, C. (Ed.). Proceedings of the Third International Research Forum on Statistical Reasoning, Thinking and Literacy (SRTL-3). Mount Pleasant, Michigan: Central Michigan University.
[33] Reading, C. 2004. Student Description of Variation while Working with Weather Data. Statistics Education Research Journal. 3(2): 84-105. [34] Makar, K. & Confrey, J. 2004. Secondary Teachers’ Statistical
Reasoning in Comparing Two Groups. In Ben-Zvi, D. & Garfield, J. (Eds.) The Challenge of Developing Statistical Literacy, Reasoning,
and Thinking (pp. 353-373). The Netherlands: Kluwer Academic
Publishers.
[35] Groth, R. E. 2005. An Investigation of Statistical Thinking in Two Different Contexts: Detecting a Signal in a Noisy Process and Determining a Typical Value. Journal of Mathematical Behavior. 24(2): 109-124.
[36] delMas, R. C. & Liu, Y. 2005. Exploring Students’ Conceptions of the Standard Deviation. Statistics Education Research Journal. 4(1): 55-82.
[37] delMas, R. C. & Liu, Y. 2007. Students’ Conceptual Understanding of the Standard Deviation. In Lovett, M. C. & Shah, P. (Eds.) Thinking
with Data (pp. 87-116). New York: Lawrence Erlbaum.
[38] Reading, C. & Reid, J. 2005. Consideration of Variation: A Model for Curriculum Development. In Burrill, G. & Camden, M. (Eds.), Curriular Development in Statistics Education: International Association for Statistical Education 2004 Roundtable (pp. 36-53). Voorburg, The Netherlands: International Statistical Institute. [39] Groth, R. E. & Bergner, J. A. 2006. Preservice Elementary Teachers’
Conceptual and Procedural Knowledge of Mean, Median, and Mode. Mathematical Thinking and Learning. 8: 37-63.
[40] Cruz, J. A. G. & Garrett, A. J. 2006. Students’ Actions in Open and Multiple-choice Questions regarding Understanding of Averages. In Novotná, J., Moraová, H., Krátká, M. and Stehlíková, N. (Eds.). Proceedings 30th Conference of the International Group for the psychology of Mathematics Education, Vol. 3 (pp. 161–168). Prague: PME.
[41] Leavy, A. & O’Loughlin, N. 2006. Preservice Teachers Understanding of the Mean: Moving beyond the Arithmetic Average. Journal of
Mathematics Teacher Education. 9: 53-90.
[42] Reading, C. & Reid, J. 2006. A Emerging Hierarchy of Reasoning about Distributions: From a Variation Perspective. Statistics Education Research Journal. 5(2), 46-68.
[43] Reid, J. & Reading, C. 2006. A Hierarchy of Tertiary Students’ Consideration of Variation. In Rossman, A. and Chance, B. (Eds.) Working Cooperatively in Statistics Education. Proceedings of the Seventh International Conference on Teaching Statistics, 2-7 July. Salvador, Brazil.
[44] Pfannkuch, M. 2006. Comparing Box Plot Distributions: A Teacher’s Reasoning. Statistics Education Research Journal. 5(2): 27-45. [45] Reading, C. & Reid, J. 2007. Reasoning about Variation: Student
Voice. International Electronic Journal of Mathematics Education. 2(3): 110-127.
[47] Watson, J. M., Callingham, R. A. & Kelly, B .A. 2007. Students’ Appreciation of Expectation and Variation as a Foundation for Statistical Understanding. Mathematical Thinking and Learning. 9(2): 83-130.
[48] Ciancetta, M. A. 2007. Statistics Students Reasoning when Comparing
Distributions of Data. Doctor Philosophy, Portland State University. [49] Cruz, J. A. G. & Garrett, A. J. 2008. Understanding the Arithmetic
Mean: A Study with Secondary and University students. Research in Mathematical Education. 12(1): 49-66.
[50] Sharma, S. 2008. Exploring Fijian High School Students’ Conceptions of Averages. Pacific-Asian Education Journal. 20(2): 29-45. [51] Reid, J. & Reading, C. 2008. Measuring the Development of Students’
Consideration of Variation. Statistics Education Research Journal, 7(1): 40-59.
[52] Canada, D. L. 2008. Conceptions of Distribution held by Middle School Students and Preservice Teachers. In Batanero, C., Burrill, G., Reading, C. & Rossman, A. (Eds.), Joint ICMI/IASE Study: Teaching Statistics in School Mathematics. Challenges for Teaching and Teacher Education. Proceedings of the ICMI Study 18 and 2008 IASE Round Table Conference.
[53] Watson, J. M. 2009. The Influence of Variation and Expectation on the Developing Awareness of Distribution. Statistics Education Research Journal. 8(1): 32-61.
[54] Chatzivasileiou, E., Michalis, I. &Tsaliki, C. 2010. Elementary School
Students’ Understanding of Concept of Arithmetic Mean. Proceedings
of the 8th International Conference on Teaching Statistics (ICOTS-8). July 11-16. Ljubljana, Slovenia.
[55] Peters, S. A. 2011. Robust Understanding of Statistical Variation. Statistics Education Research Journal. 10(1): 52-88.
[56] Turegun, M. & Reeder, S. 2011. Community College Students’ Conceptual Understanding of Statistical Measures of Spread.
Community College Journal of Research and Practice. 35: 410-426.
[57] Jacobbe, T. 2012. Elementary School Teachers’ Understanding of the Mean and Median. International Journal of Science and Mathematics Education. 10: 1143-1161.
[58] Gay, L.R., Mills, G.E. & Airasian, P. 2009. Educational research: Competencies for analysis and applications. New Jersey: Pearson Education International.
[59] Ben-Zvi, D. 1999. Alternative Assessment in Statistics Education. Proceedings of the 52nd Session of the International Statistical Institute, III, 175–176. Helsinki, Finland: Edita Ltd.
[60] Amiruddin, M. H. (2014). Inovasi dalam Teknologi Pendidikan: Isu dan
Cabaran. Malaysia: Penerbit UTHM.
[61] Callingham, R. 2011. Assessing Statistical Understanding in Middle Schools: Emerging Issues in a Technology-rich Environment. Technology Innovations in Statistics Education. 5(1). Retrieved on 20 February, 2012, from http://escholarship.org/uc/item/3qr2p70t [62] Lipson, K. & Jones, P. 1996. Statistics: Towards the 21st Century. In
Philips, B. (Ed.) Papers on Statistical Education. Hawthorn, Australia: Swinburne Press.
[63] Collins, L., & Mittag, K. 2005. Effect of Calculator Technology on Student Achievement in Introductory Statistics Course. Statistics Education Research Journal. 4(1): 7-15.
[64] Lajoie, S.P. 1997. Technologies for Assessing and Extending Statistical Learning. In Gal, I., & Garfield, J.B. (Eds.). The Assessment Challenge
in Statistics Education (pp. 179-190). The Netherlands: The
International Statistical Institute.
[65] Pratt, D., Davies, N., & Connor, D. 2011. The Role of Technology in Teaching and Learning Statistics. In Batanero, C., Burrill, G., &
Reading, C. (Eds.). Teaching Statistics in School
Mathematics-Challenges for Teaching and Teacher Education: A Joint ICMI/IASE Study (pp. 97-107). Springer.
[66] Evans, S.R., Wang, R., Yeh, T-M., Anderson, J., Haija, R., Mcbratney-Owen, P.M., Peeples, L., Sinha, S., Xanthakis, V., Rajicic, N., & Zhang, J. 2007. Evaluation of distance learning in an “introduction to biostatistics” class: a case study. Statistics Education Research Journal. 6(2): 59-77.
[67] Mills, J.D., & Raju, D. 2011. Teaching Statistics Online: A Decade’s Review of the Literature about What Works. Journal of Statistics
Education. 19 (2). Retrieved on 2 January, 2012, from
http://www.amstat.org/publications/jse/v19n2/mills.pdf
[68] Garfield, J., & Ben-Zvi, D. 2009. Helping Students Develop Statistical
Reasoning: Implementing a Statistical Reasoning Learning
Environment. Teaching Statistics. 31(3): 72-77.
[69] Garfield, J.,& Ben-Zvi, D. 2007. How Students Learn Statistics Revisited: A Current Review of Research on Teaching and Learning