Clustering Ensembles Using Evolutionary
Algorithm
Purushothaman B
PG Scholar, Department of Computer Science and Engineering Adhiyamaan College of Engineering Hosur, Tamilnadu (India)
Abstract- Data clustering is an important task and applied in various real-world problems. Since, not a single clustering algorithm is able to identify all types of cluster shapes and structures. Ensemble clustering was proposed to combine different partitions of the same data generated by multiple clustering algorithms. The key idea of most ensemble clustering algorithms is to find a partition that is consistent with most of the available partitions of the input data. Currently, there is no single clustering algorithm available to find all types of cluster shapes and structures. Therefore, in this paper, we propose an ensemble clustering algorithm in order to produce accurate clusters. And also, we enhance the single-objective PCE formulation; with the ultimate goal of providing more effective formulations capable of reducing the accuracy gap. The experimental evidence has demonstrated the significance of our proposed heuristics.
Keywords: Clustering, Clustering Ensemble, Pareto Ranking, Probability Assignment, Consensus Clustering.
I. INTRODUCTION
Clustering algorithms are useful for organizing data objects into groups which are previously unknown. The objects in a cluster are similar to each other. Generally, clustering methods find the relations between the objects by using the similarities of the objects. While classification is a supervised learning, clustering is termed as unsupervised process because the labels or classes are not known previously. Hence, if a labeled training set is not available, clustering is the only option. Clustering ensembles are based on the idea of exploiting the information provided by a set of clustering solutions (the ensemble) in order to extract a consensus clustering, i.e., a clustering solution that summarizes the information available from the ensemble. The input ensemble is usually generated by varying one or more aspects of the clustering process, such as the clustering algorithm, the parameter setting, and the number of features, objects, or clusters. Projective clustering and clustering ensembles are treated for the first time in a unified framework. The underlying motivation of this study is related to the two major issues in data clustering, i.e., the high-dimensionality and the lack of prior knowledge, which usually co-exist in real world applications. To address both issues simultaneously, the problem of clustering ensembles is formalized in [1] Because of its unsupervised nature, clustering is a tough research field. Even though it is difficult to find an optimum clustering algorithm and its parameters to fit to the data, clustering is still considered as a challenging process because each individual clustering technique has its limits in some areas and none of them can adequately handle all types of clustering problems and produce reliable and meaningful results. The main objective of the clustering ensemble technique is integration of clusters obtained using various techniques [8]. There are two stages in the clustering ensemble algorithm. In the first stage, different partitions of the same dataset are obtained by independently executing various clustering algorithm or by executing the same clustering algorithm multiple times. In the second stage, a consensus function is used to find a final partition from the partitions generated in the first stage. Fig.1 shows the process of clustering ensembles.
Fig.1. Process of Clustering Ensemble
ensembles. Section III explains the proposed system architecture. Section IV explains about the proposed algorithms and its results. Section V depicts the dataset used and the overall results. Finally, Section VI offers the conclusions and suggestions for future work.
II. RELATEDWORK
Genetic Algorithm: In the initial phase of implementation of genetic algorithm in early seventies, it was applied to solve continuous optimization problems with binary coding of variables. Binary variables are mapped to real numbers in numerical problems. Binary coding has not been found to solve all the problems. Therefore coding other than binary also has been utilized continuous function optimization uses real number coding [16]. The objective function for a clustering ensemble can be formulated as the Mutual Information (MI) between the probability distribution of labels in the consensus partition and the labels in the ensemble. Under the assumption of independence of partitions, MI can be written as sum of pair-wise MI’s between target and given partitions. This algorithm gives better result for small dataset. It is difficult to find the mutual information between the clusters. Projective clustering methods can provide better solutions to the image segmentation problem as they are able to identify dense regions into an image, where the associated subspaces are based on features such as pixel color, intensity, or texture. Moreover, in wireless sensor networks and environmental monitoring applications, sensor nodes can be differently partitioned according to their readings (time series) that capture different behavioral trends of the sensors in response to well-distinguished environmental events. In customer segmentation applications, customers can be differently partitioned depending on which part of their demographic profile (e.g., education, occupation) or behavioral profile (e.g., purchase habits, needs expressed through preferences manifested in everyday behavior) is considered [20]. Projective clusters tend to be less noisy because each group of data is represented over a subspace which ideally does not contain features that are irrelevant or redundant for that group and more understandable because the exploration of a cluster is much easier when only few, descriptive features are involved [5]. There are many works in the literature which discuss about clustering. Strehl and Ghosh, 2002 [10] proposed Cluster based Similarity Partitioning Algorithm (CSPA) based on Co-associations in which the number of clusters must be known in advance. Even though this algorithm has less computational complexity, it needs the number of clusters in advance [6]. They also proposed two more clustering algorithms namely Hyper Graph Partitioning Algorithm (HGPA) and Meta Clustering Algorithm (MCLA) based on graphs. However, the accuracy of these algorithms depends mostly on the graph structure [2]. Ana L.N.Fred and Anil K.Jain, 2005 [7], X. Wang, C. Yang, and J. Zhou [14] proposed Evidence Accumulation Algorithm (EAC) based on co-associations. In this algorithm also the number of clusters must be known prior. Since this algorithm is based on objects, it won’t scale well. Selim Mimaroglu, Ertunc Erdi, 2010 [4] proposed Combining Multiple Clustering’s Using Similarity graph (COMUSA), which is also graph based. This algorithm requires a relaxation parameter to find the number of true clusters. Again, the accuracy of this algorithm depends on the structure of the graph [3].
Generally, most of the algorithm that combine multiple clusters must be provided with the number of final clusters in advance. So the algorithms that work in object level do not scale well because of the size of the co-association matrix.
III. PROPOSEDSYSTEMARCHITECTURE
Cluster ensemble is given as input, which is the output of the clustering process.
©IJRASET 2015: All Rights are Reserved
443
Generation of clustering ensemble involves the following process, i). Cluster Generation using Locally Adaptive Clustering (LAC) algorithm. The LAC algorithm produces an output distance between cluster centroids and all objects. ii) Object and feature based probability assignment are based on the distance between cluster centroid and an object, this module produces an output both on continuous and discrete probability assignment. iii) The third module is the calculation of inter cluster similarity based on the object and feature using jaccard co-efficient, it measures and produces similarity between a pair of cluster which belongs to clustering ensemble. iv) Two objective clustering ensemble module finds the dominated and non dominated solution of multi objective optimization problems. V) Pareto ranking ranks the dominated and non dominated solution and finally returns the Pareto optimal solution.
As a result, we will get connected components which give good clusters. Fig.2 shows the system architecture diagram of the proposed system.
IV. ALGORITHMS
A. LAC Algorithm
Need to provide a search strategy to find a partition P that identifies the solution clusters. Our approach progressively improves the quality of initial centroids and weights, by investigating the space near the centers to estimate the dimensions that matter the most. The LAC algorithm is summarized as follows.
Start with well-scattered points in S as the k centroids: choose the first centroid at random, and select the others so that they are far from one another, and from the first chosen center. Initially set all weights to 1/D. Given the initial centroids cj, for j = 1. . . k, we compute the corresponding sets Sj as given in the definition above. Then compute the average distance Xji along each dimension from the points in Sj to cj. The smaller Xji is, the larger is the correlation of points along dimensions i. Use the value Xji in an exponential weighting scheme to credit weights to features (and to clusters). The exponential weighting is more sensitive to changes in local feature relevance and gives rise to better performance improvement. Note that the technique is centroid-based because weightings depend on the centroid. The computed weights are used to update the sets Sj, and therefore the centroids coordinates. The procedure is iterated until convergence is reached [9].
Procedure
.Input Nli points x є RD, k, and h.
1. Start with k initial centroids c1, c2. . . ck;
2. Set wji = 1/D, for each centroid cj, j = 1. . . k and each feature i =1….D; 3. For each centroid cj, and for each point x:
Set
Sj
{ |
x
j
argmin L
l w(
c x
l,
)}
Where
4. Compute new weights
For each centroid cj, and for each feature i:
Set
5. For each centroid cj, and for each point x:
Re compute
6. Compute new centroids. 7. Iterate 3,4,5,6 until convergence.
The clustering result of LAC depends on two input parameters. The first one is common to all clustering algorithms: the number of clusters k to be discovered in the data. The second one ‘h’ controls the strength of the incentive to cluster on more features. The setting of ‘h’ is particularly difficult, since no domain knowledge for its tuning is available. Here, we focus on setting the parameter h directly from the data. So, leverage the diversity of the clustering’s produced by LAC when different values of h are used, in order to generate a consensus clustering that is superior to the participating ones. The major challenge we face is to find a
/ 1
2 1 2
(
l,
)
iD li(
li i)
)
Lw
c x
w c
x
(
)
2/
|
|
;
j
xєS
Xji
x
Sj cji
xi
Sj
1
exp(-Xji/h)
(-Xji/h
)
ji D
i
Set w
,
{ |
l w(
l)}
©IJRASET 2015: All Rights are Reserved
444
consensus partition from the outputs of the LAC algorithm to achieve an “improved” overall clustering of the data. Since, dealing with weighted clusters, need to design a proper consensus function that makes use of the weight vectors associated with the clusters.
B. ProbabilityAssignment
LAC outputs a partition of data, identified by the two sets {c1, . . . , ck} and {w1,.,wk}. Our aim here is to generate robust and stable solutions via a consensus clustering method. We can generate contributing clusters by changing the parameter ‘h’. The objective is then to find a consensus partition from the output partitions of the contributing clusters, so that an improved overall cluster of the data are obtained [12]. To define the probability associated with cluster Cl given that we have observed xi. At a given point xi , the cluster label Cl is assumed to be a random variable from a distribution with probabilities {P(Cl |xi)}. Here provided a nonparametric estimation of such probabilities based on the data and on the clustering result [14].
In order to embed the clustering result in our probability estimations, the smaller the distance dil is, the larger the corresponding probability credited to Cl should be. Thus, P(Cl |xi) can be defined as follows:
(1)
Procedure 1. Begin
2. Assign the probability for object based cluster assignment 3. For all o є D
4. Prob (o|C) є [0,1] 5. For all f є F 6. Prob (f|F) є [0,1] 7. If the assignment is hard 8. Then object assignment is {0,1} 9. Else
10. Assignment is [0,1] 11. End
C. Calculation of Jaccard Similarity Measure
The Jaccard index, also known as Jaccard similarity coefficient is a statistic used for comparing the similarity and diversity of sample sets. The Jaccard coefficient measures similarity between finite sample sets, and is defined as the size of intersection divided by the size of union of the sample sets [17]
Procedure
1. Begin
2. For all pair of projective clustering
3. Find the cardinality of projective cluster
4. For all projective clustering ensemble
5. Calculate jaccard coefficient between two real value vectors
6. Jaccard coefficient є [0,1]
7. End
D. Pareto Rank
Here, a Pareto Rank scheme is used to learn and predict the Pareto front ranks of the offspring for the multiple objectives simultaneously. Using the predicted Pareto front rank of the offspring, selection of the new population can then be achieved at significantly lower number of exact evaluation calls to the multiple “expensive” objectives during the evolution, thus leading to significant cost savings to arrive at near true Pareto front [21].
Algorithm
(
|
)
i i l1
l i
i i l
l
D
d
P C
k D
k
d
©IJRASET 2015: All Rights are Reserved
445
1) Set t=0 (Generation counter)
2) An initial population Pt is generated and then evaluated using f (.).
3) D = Pt (an archive to store all evaluated solutions)
4) while Stopping criteria is not reached do
5) Perform crossover and mutation to create new population
6) Qt from Pt
7) Et = φ (evaluated (s, f (s)) solution in generation t)
8) if t >= g (i.e., size of the archive has amply evaluated samples for reliable training) then sort D into independent Pareto front ranks F = {F1, ・・・ ,Fk, ・・・ ,FK},
9) Construct Pareto ranking model M(F)
10) for all Qt do
11) if Qti is predicted as rank one by M, i.e., r^ = 1 then
12) evaluate Qti using f (.)
13) Et = Et ∪ Qti
14) end if
15) end for
16) else
17) evaluate Qt using f (.)
18) Et = Qt
19) end if
20) D = D∪Et
21) Pt+1=select the next population from Et∪Pt
22) t=t+1
23) end while
24) return Non-dominated solutions of Pt
E. Single Objective Clustering Ensemble
To overcome some issues of the two-objective CE formulation (such as those concerning efficiency, parameter setting, and interpretation of the results), proposes an alternative CE formulation based on single-objective function [18]. Which aims to consider the object-based and the feature-based cluster representations in ensemble as a whole?
The Kullback Leibler divergence (KL-Divergence) is a natural distance function from a "true" probability distribution, p, to a "target" probability distribution, q. It can be interpreted as the expected extra message-length per datum due to using a code based on the wrong (target) distribution compared to using a code based on the true distribution [19].
For discrete (not necessarily finite) probability distributions, p={p1, ..., pn} and q={q1, ..., qn}, the KL-distance is defined to be
KL(p, q) = Σi pi . log2( pi / qi )
For continuous probability densities, the sum is replaced by an integral.
KL(p, p) = 0 KL(p, q) ≥ 0
©IJRASET 2015: All Rights are Reserved
446
C*= arg min Q(C,E) (2)
State that
for all o є D
Where (3)
Here
(4)
Procedure 1. Begin
2. c*←random(e,k)
3. repeat
4. for all c* є C*
5. compute according to (5)
6. compute according to (6)
7. end for
8. until convergence
9. End (5) (6) Where (7) (8)
(9)
α is a positive integer whose rationale is as follows. Denoting by P, the optimization problem if we set α = 1 both the
, 1 c o c C f
2, , ,
,
(
)
c C
c o c f o
o D f F
Q C E
f
f
f
, , ,1
|
|
o c o c f
C E c C
f
f
f
E
* , c of
* ,f cf
1 , , 1 1 * , C o c o c o c CX
f
X
, * , f c f c cZ
f
Y
2 C ,o(
c f, o f,)
f F
X
f
,
c c o
o D
Y
f
,
,
,
c f
c o
o f
o D
Z
f
©IJRASET 2015: All Rights are Reserved
447
objective function and the constraints of P become linear.
V. DATASET
Here, we have selected ten publicly available datasets having different characteristics in terms of number of objects, features and classes, which are summarized in Table 1. A brief description for each dataset is given next.
TABLE.1.DATASETS
All the dataset have the following format: each line corresponds to an object and contains numerical values separated by a semicolon [15]. The first value in the line denotes the ID of a class (in the reference classification), and the subsequent values denote the object's attribute (feature) values. Class IDs are integer progressive values starting from 0; if no reference classification is available, all lines begin with the same class ID (e.g., 0).
A. Results and Discussions
In this experiment, we have designed ten different simulated datasets to compare the competitive algorithms under different conditions. Clusters are distributed according to different mean and standard deviation vectors. Experimental evaluation was aimed to assess accuracy and efficiency of the consensus clustering’s obtained by the proposed two and single objective clustering ensembles.
Fig.3. Evaluation of Ensemble solution based on the object
0 0.2 0.4 0.6
0.81
1.2 1.4 1.6
v
a
ri
a
n
ce
Datase
t
Ensemble solution based on the object
Two Objective-CE
Single Objective - CE
Dataset Objects Features Classes
Fig.4. Evaluation of ensemble solution based on the feature
[image:9.612.122.496.263.474.2]
[image:9.612.191.426.521.670.2]
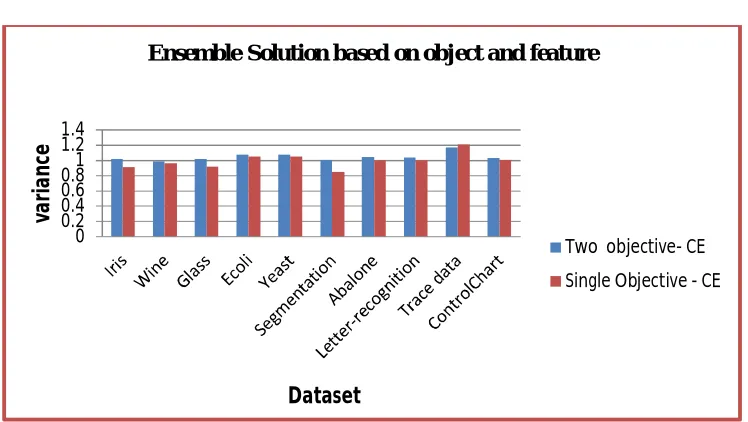
Fig.5. Evaluation of ensemble solution based on object and feature
Fig.6. Execution times
The setup of the proposed algorithms, the measures to assess the quality of the consensus clusters. The figure 3, 4, 5 shows the variance between the clustering ensemble and the consensus clustering; it is based on the object, feature and object and features. Figure 6 shows the execution time of all datasets Consensus clustering is represented by two lines for each of its clusters, where the first line corresponds to the object-to-cluster assignments and the second corresponds to the feature-to-cluster assignments.
0 0.2 0.4 0.6
0.81
1.2
V
a
ri
an
ce
Dataset
Ensemble Solution based on feature
Two Objective - CE
Single Objective - CE
0 0.2 0.4 0.6
0.81
1.2 1.4
va
ri
a
n
ce
Dataset
Ensemble Solution based on object and feature
Two objective- CE
©IJRASET 2015: All Rights are Reserved
449
VI. CONCLUSIONANDFUTUREWORK
Recent advance in data clustering resulted in the introduction of a new problem, called clustering ensembles (CE), whose goal is to derive a robust consensus clustering from an ensemble of clustering solutions. CE has been originally formulated as a two objective or a single-objective optimization problem, and related heuristics have been developed focusing either on effectiveness or efficiency aspects. This paper addresses the main issues in existing CE methods: none of them exploits approaches commonly adopted for solving the clustering ensemble problem, thus missing a wealth of experience gained by the majority of clustering ensemble methods. More importantly, the two-objective CE is not capable of treating the object-to-cluster and the feature-to-cluster assignments as interrelated. To overcome this, an alternative formulation of CE is proposed as a new single-objective problem in which the objective function is able considers the object- and feature-based cluster representations as a whole in a notion of distance for clustering solutions. Experiments on benchmark datasets are done. It is observed that the proposed algorithms outperform the earlier CE methods in terms of accuracy, and Single objective-CE is faster than the two-objective CE. It is observed that the results of various cluster ensemble techniques for same dataset show an accuracy problem. Therefore, the accuracy enhancement can be an important work in future.
REFERENCES
[1] S. Mimaroglu and E. Aksehirli,”DICLENS: Divisive clustering ensemble with automatic cluster number,” IEEE/ACM Transactions on Computational Biology and Bioinformatics, VOL 9, NO. 2, PP.408-420, 2012.
[2] Selim Mimaroglu, Ertunc Erdil,“Combining Multiple Clustering’s Using Similarity Graph" in Pattern Recognition, Volume 44, Issue 3, March 2011, Pages 694-703, Elsevier
[3] Selim Mimaroglu, Murat Yagci,”CLICOM: Cliques for combining multiple clustering’s” in Expert Systems with Applications, Volume 39, pp. 1889– 1901, 2011, Elsevier
[4] S. Mimaroglu and E. Erdil, “Obtaining Better Quality Final Clustering by Merging a Collection of Clustering,” Bioinformatics, vol. 26, pp. 2645-2646, 2010
[5] H.G. Ayad and M.S. Kamel, “On Voting-Based Consensus of Cluster Ensembles,” Pattern Recognition, vol. 43, no. 5, pp. 1943-1953, May 2010 [6] H. Luo, F. Jing and X. Xie, “Combining multiple clustering’s using information theory based genetic algorithm,” IEEE International Conference on
Computational Intelligence and Security, vol. 1, pp. 84-89, 2006.
[7] A. Fred and A. Jain, “Combining Multiple Clustering Using Evidence Accumulation,” IEEE Trans. Pattern Analysis and Machine Intelligence, vol. 27, no. 6, pp. 835-850, June 2005.
[8] X.Z. Fern and C.E. Brodley, “Solving Cluster Ensemble Problems by Bipartite Graph Partitioning,” Proc. 21st Int’l Conf. Machine Learning, p. 36, 2004. [9] A. Topchy, A.K. Jain, and W. Punch, “Combining Multiple Weak Clustering” Proc. IEEE Third Int’l Conf. Data Mining, pp. 331-338, 2003.
[10] A. Strehl and J. Ghosh, “Cluster Ensembles-A Knowledge Reuse Framework for Combining Multiple Partitions”, Journal of Machine Learning Research, pp. 583- 617, 2002.
[11] P. Mahata, “Exploratory Consensus of Hierarchical Clusterings for Melanoma and Breast Cancer,” IEEE/ACM Trans. Computational Biology and Bioinformatics, vol. 7, no. 1, pp. 138-152, Jan.-Mar. 2010
[12] Z. Yu, H. Wong, and H. Wang, “Graph-Based Consensus Clustering for Class Discovery from Gene Expression Data, “Bioinformatics, vol. 23, no. 21, pp. 2888-2896, Nov. 2007.
[13] E. Kim, S. Kim, D. Ashlock, and D. Nam, “MULTI-K: Accurate Classification of Microarray Subtypes Using Ensemble K-Means Clustering,” BMC Bioinformatics, vol. 10, no. 1, article 260, 2009.
[14] X. Wang, C. Yang, and J. Zhou, “Clustering Aggregation by Probability Accumulation,” Pattern Recognition, vol. 42, no. 5, pp. 668-675, May 2009. [15] A. Frank and A. Asuncion, UCI Machine Learning Repository, School of Information and Computer Sciences, Univ. of California, 2010.
[16] Srinivas N, Deb K, “Multiobjective optimization using nondominated sorting in genetic algorithms,” Evol Comput 2(3), pp. 221–248,1994.
[17] Topchy AP, Jain AK, Punch WF, “A mixture model for clustering ensembles,” Proceedings of the SIAM international conference on data mining (SDM), pp 379–390,2004.
[18] Woo K-G, Lee J-H, KimM-H, Lee Y-J (2004) FINDIT: a fast and intelligent subspace clustering algorithm using dimension voting. Inf Softw Technol 46(4),pp 255–271,2004.
[19] Yang Y, KamelMS ,”An aggregated clustering approach using multi-ant colonies algorithms,” Pattern Recog 39(7), pp. 1278–1289,2006.
[20] Francesco Gullo, Carlotta Domeniconi and Andrea Tagarelli,”Projective clustering ensembles,” Springer Data Min Knowl Disc, pp. 452–511, 2013. [21] Deb K, Pratap A, Agarwal S, Meyarivan T “A fast and elitist multiobjective genetic algorithm NSGA-II”. IEEE Trans Evol Comput 6(2),pp.182–