Technology (IJRASET)
An Overview of Wind Speed and Wind Power
Forecasting
Garima Sikka1 , Aashish Jaiswal2, S. N. Joshi3
1,2 Department of Electrical Engineering GLA University, Mathura 3Department of Electrical Engineering Govt. Women Engg. College, Ajmer
Abstract: At present era, accurate wind speed forecasting becomes essential as the wind power penetration in the emerging power system is growing. The paper presents time scale classification for wind speed and forecasting of generated wind power and reviews the different techniques involved in wind speed and wind power forecasting, such as artificial neural networks (ANNs), hybrid techniques, etc. It shows variations of temperature, pressure, wind speed, and its direction of different sites around the world and various locations in India for wind power generation. Non-linear relationship between wind speed and wind and the various problems that occur during the wind power and wind speed forecasting are discussed as well.
Keywords-: Artificial neural network, wind speed forecasting, wind power forecasting, hybrid techniques.
I. INTRODUCTION
Wind-energy has the potential of a reliable autonomous source of electric power, but due to the intermittency of wind its large scale integration is very challenging. Wind power generation has the advantage of zero-carbon emission, due to which it has been prevailingly implemented around the world. Till now, several countries have initiated wind power projects covering onshore and offshore wind farms as well as distributed wind power integrations but due to the erratic nature of the atmosphere of the earth, there is a great randomness in wind power generated, which acts as a limiting factor for this source of energy.
The randomness of wind speed, adds up to the operating costs for the electricity system. It is known that the relation of wind power with wind speed is cubic in nature, which means that any error in wind speed forecast will give a large (cubic) error in wind power [1]-[5].
This paper provides a detailed review on wind speed forecasting based on recent published papers. The contribution of this paper is the classification of wind speed forecasting, trends of different parameters used in wind speed forecasting, an overview of different problems related to wind power and the results of some new and highly efficient models.
The paper has been divided in following eight sections. Section II - problems related to wind power. Section III - time scale classification. Section IV - different wind power forecasting methods. Section V - the non-linear relationship of wind power and wind speed. The trends of different parameters related to wind power generation are depicted in Section VI. Section VII presents the results of simulations and Section VIII discusses the conclusion and future work.
II. PROBLEMSRELATEDTOWINDPOWER
Wind power is intermittent and is sometimes non-dispatch able whereas its counterpart fossil-based power is completely controllable because the generation of wind power depends on atmospheric conditions and landscape and thus is variable. Wind energy which gets converted into electric power should be consumed immediately as a result the economic value of wind power generation depends upon synchronized timing of load and wind patterns. Wind energy based generators cannot be scheduled to meet variable load [6]-[7].
III. TIMESCALECLASSIFICATION
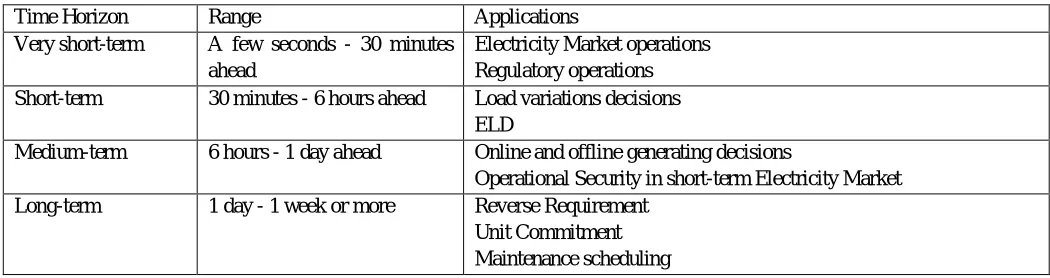
Time-scale classification of wind forecasting methods is not expressed clearly in the literature [8]-[12]. However, as shown in table 1, wind forecasting time horizon can be divided into four categories:
A) Very short-term forecasting: it is also known as turbulence time scale. In this horizon, the prediction time period is from a few seconds to 30 minutes ahead.
B) Short-term forecasting: it is also known as synoptic scale in the spectral gap. In this horizon, the prediction time-period is from 30 minutes to 6 hours ahead.
Technology (IJRASET)
[image:3.612.43.568.120.259.2]D) Long-term forecasting: it is also known as climate scale. In this horizon, the prediction time period is from 1 day to 1 week ahead. TABLE I
TIME SCALE CLASSIFICATION WITH APPLICATIONS
Time Horizon Range Applications
Very short-term A few seconds - 30 minutes ahead
Electricity Market operations Regulatory operations Short-term 30 minutes - 6 hours ahead Load variations decisions
ELD
Medium-term 6 hours - 1 day ahead Online and offline generating decisions
Operational Security in short-term Electricity Market Long-term 1 day - 1 week or more Reverse Requirement
Unit Commitment Maintenance scheduling
IV. OVERVIEWOFWINDPOWERFORECASTINGMETHODS
A general overview of wind forecasting methods is presented in Table II. The most commonly used forecasting techniques are as follows:
A. Naive Predictor
This method is taken as a reference method. It is mainly used for industrial applications. This method is also known as persistence method. In this method the speed of the wind at time‘t+Δt’ will remain same as it was at time ‘t’.
B. Numeric Weather Pridiction
In this method atmospheric conditions are considered for forecasting of wind speed. It operates by solving the complex mathematical models that uses data of wind speed, wind direction, pressure, temperature, etc.
C. Stastical Approach
In this method measured data is trained and it uses difference between actual and forecasted wind speeds in immediate past to tune the model parameters. It is classified into time series model and ANN model.
D. Hybrid Approach
In this approach combination of two or more approach is applied for forecasting. For example neural network method is combined with numeric weather prediction method. Past results show that a combination of different approaches often improves the forecasting results. One recent popular technique is a model which is based on the spatial correlation of wind speeds. The wind speed data of a reference point and its neighbouring wind farms are used to forecast wind speed by ANN or neuro-fuzzy logic [13]-[17].
TABLE II
RESULTS FOR OUT-OF-SAMPLE DAILY TEST FROM JANUARY TO APRIL IN YEAR 2012
Forecasting methods Subcategory Examples Remarks
Naïve predictor method
- S(t+Δt)=s(t)
Accuracy is good for very short term and short term forecasting -reference method
Numeric weather
prediction method - Global forecasting
[image:3.612.31.583.584.686.2]Technology (IJRASET)
Statistical approach
ANN method
Feed-forward Recurrent
Multilayer perceptron Radial Basis Function ADALINE, etc.
Its hybrid models are efficient for middle and long term Accurate for short term
-mostly better than time series models
Time series model
ARX ARMA ARIMA
Accurate for short term some models are better than their counterpart ANNs
New techniques
-
Spatial Correlation Fuzzy logic Wavelet Transform Entropy based training
Spatial correlation accurate for short term
considering non-Gaussian error pdf improves accuracy
Hybrid models
-
NWP+NN ANFIS
Spatial Correlation + NN NWP+ time series
ANFIS is good for very short term forecasting
NN + NWP structures are very accurate for medium and long-term forecasts.
V. RELATIONBETWEENWINDPOWER&WINDSPEED
A wind turbine’s power output depends mainly on wind speed and also on its direction. Wind speed and its direction further depend upon atmospheric conditions and type of location. The relation between wind speed v (metre per second) and wind power P (watt) is given in equation 1.
(1)
Where is air density (kilogram per metre cube) which depends upon air pressure and air temperature, a is area of wind passing through wind turbine. The relation shows that relationship between wind power and wind speed is cubic thus any error in forecasting of wind speed will give a cubic error in wind power [18]-[19].
VI. TRENDOFWINDSPEED,TEMPERATURE,PRESSUREANDDIRECTIONOFDIFFERENTSITES
The following figures show that the parameters such as temperature, pressure, wind speed and its direction have highly nonlinear characteristics thus many problems arise in forecasting of wind power/speed.
Technology (IJRASET)
Fig: 2. Variations of wind speed, its direction, temperature, and pressure of New Delhi.
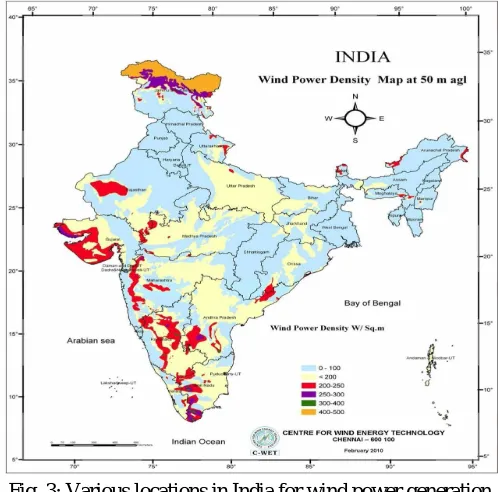
As in Tasmania there are many wind farms located and the wind power has been generated with the help of wind speed forecast. The trends as shown in Fig.3 can be applied in different parts of India using the data of temperature, pressure, wind speed and its direction for wind power generation [20]-[22].
Fig. 3: Various locations in India for wind power generation.
VII. SIMULATION&RESULTS
[image:5.612.180.429.382.628.2]Technology (IJRASET)
TABLE III
FORECASTING RESULTS FOR WIND SPEED USING MEASUREMENTS TAKEN FROM SITES LYING LONG DISTANCES APART (10 TO 40 KM)
Minutes ahead Average persist error (m/sec) All inputs Inputs from B and A1 Inputs from B and A2
Inputs from local site B
% Error Improvement as Compared to Persistent Error
1-15 0.5881 19.07 17.95 16.21 15.19
15-30 0.8236 17.13 13.11 14.71 10.42
30-45 0.9521 15.68 9.321 11.14 6.149
45-60 1.036 15.58 8.641 11.35 5.492
60-75 1.097 15.46 8.944 10.11 5.569
75-90 1.151 14.77 9.400 11.87 4.400
90-105 1.247 17.20 9.062 15.43 5.062
[image:6.612.76.538.117.281.2]105-120 1.303 25.58 11.37 22.54 4.437
Fig. 4: Improvement of wind speed forecasting error compared to persistent error. Forecasting based on (1) all inputs, (2) local inputs, (3) data from site A1 and local inputs (4) data from site A2 and local inputs.
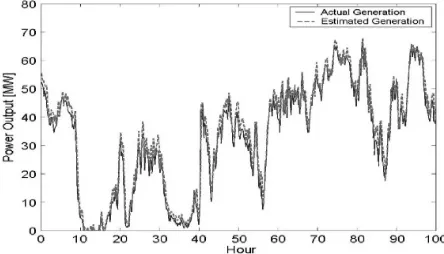
An ANN model with topology ID4 was used for long term wind power forecasting (100 hours) at a wind farm located in Lawton City, OKLAHOMA. The mean absolute percentage error as given in equation 2.
(2)
[image:6.612.188.410.579.706.2]The MAPE was around 5%. Results show that the ANN model developed can forecast effectively wind power for a 74-Mega Watt wind farm. Fig 5 shows estimated power output and actual power output of wind farm over a select 100-h period in August 2002 [24].
Technology (IJRASET)
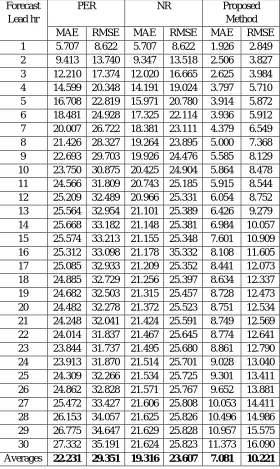
[image:7.612.167.447.214.683.2]A two stage hybrid forecasting model was developed for better prediction of wind power for long term forecasting (up to 30 look-ahead hours). In first stage a wavelet decomposition of wind series is done and each decomposed signal is forecasted (up to 30 hours ahead) by adaptive wavelet neural network (AWNN). In second stage the forecasted wind speed by AWNN is used by a feed forward neural network (FFNN) for forecasting wind power through a nonlinear mapping between wind power and wind speed. The results show that this model performs better than both new–reference (NR) model and naïve predictor method. Table IV shows error measurements for different forecasting lead hours. Fig 6 depicts the improvement in capability of developed model with respect to the earlier two benchmark models [25].
TABLE IV
WIND POWER FORECAST ERROR MEASUREMENTS FOR DIFFERENT FORECASTING LEAD HOURS
Forecast Lead hr
PER NR Proposed
Technology (IJRASET)
Fig. 6: Improvement of wind power forecast model with respect to NR and PER benchmark models for both the MAE and RMSE criteria.
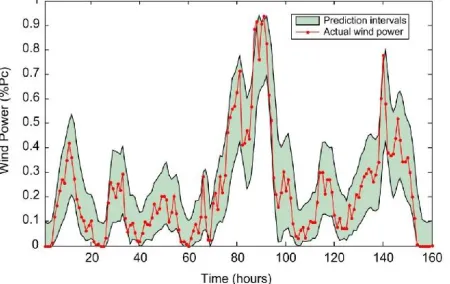
A hybrid intelligent algorithm (HIA) approach was developed for best possible prediction intervals (PIs) of wind power. The HIA combines particle swarm optimization (PSO) and extreme learning machine for optimal interval forecast of wind power. The proposed model was tested at two wind farms namely the Starfish Hill wind farm near Cape Jervis and the Challicum Hills wind farm near Ararat in western Victoria, in Australia. Results show that the developed approach had very good efficiency and it is reliable. Fig 7 shows prediction intervals of Challicum Hills wind farm obtained by HIA approach. [26].
Fig. 7: PIs with PINC 90%in March 2010 of the Challicum Hills wind farm obtained the proposed HIA approach.
A probabilistic forecasting method was proposed based on extreme learning machine (ELM) for wind power generation. To construct the prediction intervals (PIs) a statistical model BELM has been developed. The training of BELM method is very fast as compared to NNs based models because of extreme fast learning. Results of experiments at different seasons show that the proposed BELM method was highly satisfactory thus accurate wind power forecasting for short term can be attained by using the proposed method. Table V shows that interval score of proposed BELM approach are better than benchmark models. Fig 8 shows prediction interval during summer season in 2012 obtained by BELM approach. [27].
TABLE V
RESULTS OF INTERVAL SCORE IN DIFFERENT SEASONS Season PIN
C BEL M BEL M-Beta Persis tence Climat ology ESM Summ er 90 % -7.61 % -8.39 % -8.78 % -16.08% -8.54% 95 % -4.59 % -5.37 % -5.49 %
-8.50% -5.25% 99 % -1.41 % -2.21 % -1.96 %
Technology (IJRASET)
Autum n 90 % -5.92 % -5.97 % -6.50 % -15.10% -6.36% 95 % -3.64 % -3.61 % -4.03 %-7.85% -3.89% 99 % -1.19 % -1.09 % -1.46 %
-1.71% -1.30% Winter 90 % -6.91 % -6.85 % -7.60 % -15.66% -7.36% 95 % -4.12 % -4.06 % -4.76 %
-8.19% -4.47% 99 % -1.28 % -1.18 % -1.65 %
-1.78% -1.40% Spring 90 % -7.10 % -7.19 % -7.95 % -16.31% -7.71% 95 % -4.15 % -4.16 % -4.96 %
-8.55% -4.72% 99 % -1.12 % -1.09 % -1.75 %
-1.81% -1.55%
Fig. 8: PIs with nominal confidence 90% in summer 2012 obtained by the proposed BELM approach.
Technology (IJRASET)
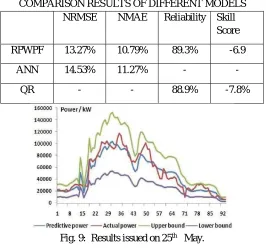
TABLE VI
COMPARISON RESULTS OF DIFFERENT MODELS NRMSE NMAE Reliability Skill
Score
RPWPF 13.27% 10.79% 89.3% -6.9
ANN 14.53% 11.27% - -
QR - - 88.9% -7.8%
Fig. 9: Results issued on 25th May.
VIII. CONCLUSION&FUTUREWORK
This paper presents the time scale classification for wind speed/power forecasting. It reviews the different approaches involved in wind speed/power forecasting mainly based on artificial neural network (ANN) and hybrid techniques and some other newly developed models. An overview of problems that occur in wind forecasting is given. Trends of different parameters used in wind forecasting and non-linear relationship between wind power and wind speed is also discussed. There lies an ever growing need of electricity in India. In such conditions, wind power can turn out to be a massive contributor in feeding the electricity demand. Being a peninsula India has a vast coastal region. With proposed techniques, wind energy can be harvested to its fullest.
REFERENCES
[1] Saurabh S. Soman, Hamidreza Zareipour, Om Malik, and Paras Mandal, “A Review of Wind Power and Wind Speed Forecasting Methods With Different Time Horizons,” IEEE North American Power Symposium (NAPS), pp. 1-8, Sept. 2010.
[2] Michael Negnevitsky, Paras Mandal, and Anurag K. Srivastava, “Machine Learning Applications for Load, Price and Wind Power Prediction in Power Systems,” IEEE International Conference on Intelligent System Applications to Power Systems,pp. 1-6, 2009.
[3] Ashraf Ul Haque, Paras Mandal, Julian Meng, Mary E. Kaye, and Liuchen Chang, “A New Strategy for Wind Speed Forecasting Using Hybrid Intelligent Models,” IEEE Canadian Conference on Electrical & Computer Engineering (CCECE), pp. 1-4, April 2012.
[4] Ashraf Ul Haque, Paras Mandal, Julian Meng, Anurag K. Srivastava, Tzu-Liang (Bill) Tseng, and Tomonobu Senjyu, “A Novel Hybrid Approach Based on Wavelet Transform and Fuzzy ARTMAP Network for Predicting Wind Farm Power Production
,” IEEE Industry Applications Society Annual Meeting (IAS), pp. 1-8, Oct. 2012.
[5] Hoong Yan See Tao, Anurag K. Srivastava, Ricardo L. Pineda, and Paras Mandal, “Wind Power Generation Impact on Electricity Price in ERCOT,” IEEE Power and Energy Society General Meeting, pp. 1-7, July 2012.
[6] Ashraf Ul Haque, M. Hashem Nehrir, and Paras Mandal, “A Hybrid Intelligent Model for Deterministic and Quantile Regression Approach for Probabilistic Wind Power Forecasting,” IEEE Transactions On Power Systems, Vol. 29, No. 4, July 2014.
[7] Julija Matevosyan and Lennart Söder, “Minimization of Imbalance Cost Trading Wind Power on the Short-Term Power Market,”IEEE Transactions On Power Systems, Vol. 21, No. 3, August 2006.
[8] Magnus Korpa˚s and Arne T. Holen, “Operation Planning of Hydrogen Storage Connected to Wind Power Operating in a Power Market,” IEEE Transactions On Energy Conversion, Vol. 21, No. 3, September 2006.
[9] Cameron W. Potter, and Michael Negnevitsky, “Very Short-Term Wind Forecasting for Tasmanian Power Generation,” IEEE Transactions On Power Systems, Vol. 21, No. 2, May 2006.
[10] Yan Xu, ZhaoYangDong, ZhaoXu, Ke Meng, and Kit Po Wong, “An Intelligent Dynamic Security Assessment Framework for Power Systems With Wind Power,” IEEE Transactions On Industrial Informatics, Vol. 8, No. 4, November 2012.
[11] Caixia Wang, Zongxiang Lu, and Ying Qiao, “A Consideration of the Wind Power Benefits in Day-Ahead Scheduling of Wind-Coal Intensive Power Systems,” IEEE Transactions On Power Systems, Vol. 28, No. 1, February 2013.
[image:10.612.44.578.457.735.2]Technology (IJRASET)
[13] Kittipong Methaprayoon, Chitra Yingvivatanapong, Wei-Jen Lee, and James R. Liao, “An Integration of ANN Wind Power Estimation Into Unit Commitment Considering the Forecasting Uncertainty,” IEEE Transactions On Industry Applications, Vol. 43, No. 6, November/December 2007.
[14] Kanna Bhaskar, and S. N. Singh, “AWNN-Assisted Wind Power Forecasting Using Feed-Forward Neural Network,” IEEE Transactions On Sustainable Energy, Vol. 3, No. 2, April 2012.
[15] Can Wan, Zhao Xu, Pierre Pinson, Zhao Yang Dong, and Kit Po Wong, “Optimal Prediction Intervals of Wind Power Generation,” IEEE Transactions On Power Systems, Vol. 29, No. 3, May 2014.
[16] Can Wan, Zhao Xu, Pierre Pinson, Zhao Yang Dong, and Kit Po Wong, “Probabilistic Forecasting of Wind Power Generation Using Extreme Learning Machine,” IEEE Transactions On Power Systems, Vol. 29, No. 3, May 2014.
[17] Jie Yan, Yongqian Liu, Shuang Han, Chenghong Gu, Furong Li, “A robust probabilistic wind power forecasting method considering wind scenarios,” Renewable Power Generation Conference (RPG 2014), pp. 1-6, 2014.
[18] Bart C. Ummels, , Madeleine Gibescu, Engbert Pelgrum, Wil L. Kling, and Arno J. Brand, “Impacts of Wind Power on Thermal Generation Unit Commitment and Dispatch,” IEEE Transactions On Energy Conversion, Vol. 22, No. 1, March 2007.
[19] Miguel A. Ortega-Vazquez, and Daniel S. Kirschen, “Estimating the Spinning Reserve Requirements in Systems With Significant Wind Power Generation
Penetration,” IEEE Transactions On Power Systems, Vol. 24, No. 1, February 2009.
[20] James W. Taylor, Patrick E. McSharry, and Roberto Buizza, “Wind Power Density Forecasting Using Ensemble Predictions and Time Series Models,” IEEE Transactions On Energy Conversion, Vol. 24, No. 3, September 2009.
[21] Rajesh Karki, Suman Thapa, and Roy Billinton, “ASimplified Risk-Based Method for Short-Term Wind Power Commitment,” IEEE Transactions on Sustainable Energy, Vol. 3, No. 3, July 2012.