© 2016, IRJET | Impact Factor value: 4.45 | ISO 9001:2008 Certified Journal
| Page 1184
HD IMAGE PROCESSING BY USING SKETCHES
Kandi Jyothsna
Assistant Professor, Dept. of Computer Science and Engineering, SCITS, Telangana, India
---***---Abstract -
The HD Image Processing (HDIP) is one of the
most popular, rising research area of digital image processing. Most of the available image search tools, such as Google Image search, are based on textual annotation of images. At present images are retrieved using text-based search methods but the goal of HDIP is to extract visual content of image automatically, like color, shape. The existing method helps to design and implement a task, which handles the information gap between a sketch and colored image, making an opportunity for efficient search. The transformed full color image and the sketch can be compared. This technology can be used in several applications such as digital libraries, crime prevention, and photo sharing site. Such a system has great value in apprehending suspects and identifying victims in forensic sketch to a gallery of mug shot images. The area of retrieve images based on the visual content of the query picture intensified recently, which demands on the quite wide methodology spectrum on the area of the image processing.
Key Words
:
Image Processing, High Definition, HDIP,
HD Image, CBIR,EHD.
1.INTRODUCTION
Before the spreading of information technology a huge number of data had to be managed, processed and stored. It was also textual and visual information. Parallel of the appearance and quick evolution of computers increasing measure of data had to be managed. The growing of data storages and revolution of internet had changed the world. The efficiency of searching in information set is very important point of view. In case of texts we can search flexibly using keywords; images can be well represented by keywords. If we want to search efficiently some data have to be recalled. The human is able to recall visual information more easily using some objects, for example the shape of an object or arrangement of colors. Since human is visual type, we look for images using other images. In this case we search using some features of images, and these are not frequently used for retrieval process, which retrieve images using the non-textual information of a sample image. To give some unique and identifiable information to a text is not too difficult.
In this system, user has a drawing area where they can draw those views, which are the base of the retrieval
method. In the following paragraph some application possibilities are analyzed. The Content based image retrieval systems have a big significance in the criminal investigation. The identification of unsubstantial images, tattoos and graffiti’s can be supported by these systems. It is also used to searching analog circuit graphs from a database. In this technique, the user draw color views and blobs on the drawing area. The images were divided into grids, and the color and texture features were determined in these grids. The applications of grids were also used in other algorithms (Edge Histogram descriptor). The components and their communications are introduced, and the functionality of subsystems.
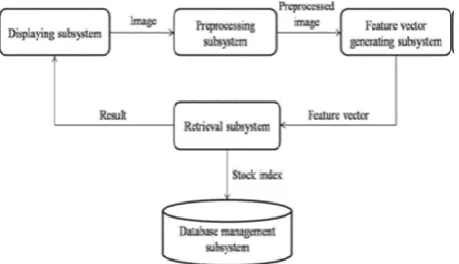
Fig -1: The global structure of the system
1.1
The Purpose of the system
Even though the measure of research in sketch-based image retrieval increases, there is no widely used SBIR system. Our goal is to develop a content-based associative search engine, which databases are available for anyone looking back to freehand drawing. The user has a drawing area, where he can draw all shapes and moments, which are expected to occur in the given location and with a given size. The retrieval results are grouped by color for better clarity. Our most important task is to bridge the information gap between the drawing and the picture, which is helped by own preprocessing transformation process. In our system the iteration of the utilization process is possible, by the current results looking again, thus increasing the precision.
[image:1.595.309.539.392.524.2]© 2016, IRJET | Impact Factor value: 4.45 | ISO 9001:2008 Certified Journal
| Page 1185
diversity of images. Using the feature vector generatingsubsystem our image can be represented by numbers considering a given property. The database management subsystem provides an interface between the database and the program. Based on the feature vectors and the sample image the retrieval subsystem provides the response list for the user using the displaying subsystem.
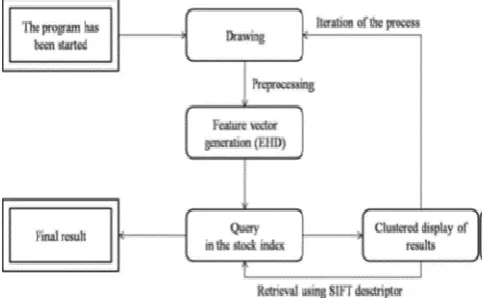
When the drawing has been finished or the appropriate representative has been loaded, the retrieval process is started. The retrieved image first is preprocessed. After that the feature vector is generated, then using the retrieval subsystem a search is executed in the previously indexed database. As a result of searching a result set is raised, which appears in the user interface on a systematic form. Based on the result set we can again retrieve using another descriptor with different nature.
Fig -2: The data flow model of the system from user’s point of view
1.2 The Preprocessing Subsystem
The system was designed for databases containing relatively simple images, but even in such cases large differences can occur among images in size or resolution. In addition, some images may be noisier, the extent and direction of illumination may vary (see Fig. 1), and so the feature vectors cannot be effectively compared. In order to avoid it, a multistep preprocessing mechanism precedes the generation of descriptors. The input of the preprocessing subsystem is one image, and the output is the respective processed result set (see Fig. 2). The main problem during preprocessing of the color images of real situations is that the background containing several textures and changes generate unnecessary and variable-length edges. As a possible solution texture filter were analyzed, for example the entropy calculation based filter. It gives very valuable results, if a textured object of little color stands in a homogenous background. The classification of the image pixel intensities minimizes the number of the displayed colors. If only some intensity values represent the images, then according to our experience, the color based
classification of result images can also be easily implemented.
1.3
The Feature Vector Preparation Subsystem
In this subsystem the descriptor vectors representing the content of images are made. Basically three different methods were used, namely the edge histogram descriptor, the histogram of oriented gradients and the scale invariant feature transform. Our system works with databases containing simple images. Error handling that is expected to be robust to the image. While an image is rich of information, in contrast at a binary edge image only implicit content and we wrote in the previous subsection, the images of database were transformed into edge images, so information was lost. As the feature vectors are ready, the retrieval can start. For the retrieval the distance based search was used with Minkowski distance and the classification-based retrieval.
1.4
The Database Management Subsystem
The images and their descriptors are stored and the necessary mechanism for subsequent processing is provided. This is the database management subsystem, which consists of three parts, the storage, the retrieval, and the data manipulation modules. The storage module provides images, information and the associated feature vectors are uploaded to the database. The name, size and format of the image are attached. The information related to the preparation is gathered, as the maker’s name, creation date, image title, the brand and type of recording unit. In addition, we may need more information of color depth, resolution, image dimension, vertical and horizontal resolution, possibly the origin of the image, so we take care of their storage.
For storage the large images are reduced. The data is stored in a global, not scattered place in the hard disk. The retrieval results are obtained by usage of query module. The retrieval subsystem contacts the database, which provides the descriptors. For optimization it is already loaded at startup to a variable, data structure. If we have the result of retrieval, the database retrieves the result image using the primary key.
1.5
The Displaying Subsystem
Because drawings are the basis of the retrieval, thus a drawing surface is provided, where they can be produced. Also a database is needed for search, which also must be set before the search. In case of large result set the systematic arrangement of search results makes much easier the overviews, so it is guaranteed. The methods in our system cannot work without parameters, and therefore an opportunity is provided to set these as well.
[image:2.595.35.280.313.462.2]© 2016, IRJET | Impact Factor value: 4.45 | ISO 9001:2008 Certified Journal
| Page 1186
only a given ratio, the image can be included in the display [image:3.595.39.279.184.660.2]list. In our system the possible results are classified, and the obtained clusters are displayed. Hence the solution set is more ordered and transparent. By default the results are displayed by relevance, but false-positive results can be occurred, which worsen the retrieval results.
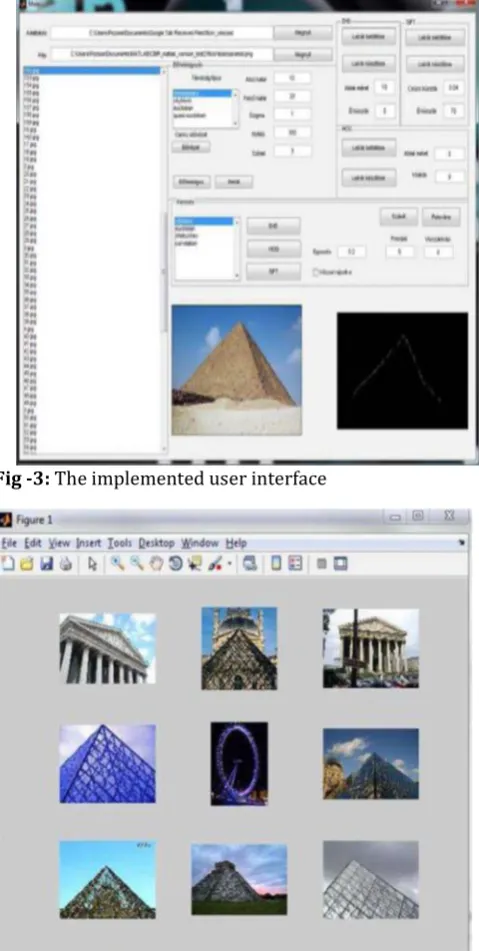
Fig -3: The implemented user interface
Fig -4: The first nine results can be seen in a separate window.
The user perception is better. Since the color-based clustering for us is the best solution, so our choice was the k-means clustering method [1], which is perfectly suited for this purpose. The implemented user interface can be seen in Fig. 3 and Fig. 4. Our program has been written in MATLAB,
and during the implementation some new idea was considered.
2.
Tests and Results
2.1 Used Test Databases
The system was tested with more than one sample database to obtain a more extensive description of its positive and negative properties. The Microsoft Research Cambridge Object Recognition Image Database was used, which contains 209 realistic objects. All objects have been taken from 14 different orientations with 450×450 resolution. The images are stored in TIF format with 24 bits. This database is most often used in computer and psychology studies. Some images of this database can be seen in Fig. 5.
Another test database was the Flickr 160. This database was used before for measuring of a dictionary-based retrieval system [8]. 160 pieces of general-themed pictures have sorted from the photo sharing website called Flickr. The images can be classified into 5 classes based on their shape. A lot of images contain the same building and moments. The database is accompanied by examples, which is based on the retrieval. Since the test result are documented and the retrieved sketches are also available, so the two systems can be compared with each other. Some images of Flickr 160 database can be seen in Fig. 6.
Fig -5: Some sample images of the Microsoft Research Cambridge Object Recognition Image Database.
[image:3.595.309.552.425.608.2]© 2016, IRJET | Impact Factor value: 4.45 | ISO 9001:2008 Certified Journal
| Page 1187
Fig -6: Some sample images of Flickr 160 database.Fig -7:Some images of Wang database clustered by color content.
Fig -8: Sketch images, which was used at the tests.
2.2 Testing Aspects, Used Metrics
We can evaluate the effectiveness of the system forming methods, and compare the different applied methods, if we done metrics. Thus, we can determine which method works effectively in what circumstances, and when not.
Let be a test database containing N pieces images, P length retrieval list, from which Q pieces matter as relevant results, and Z denotes the number of expected relevant hits. If we know this information, the following metrics can be calculated.
Precision = -- (1)
Where the precision gives information about the relative Effectiveness of the system.
Recall = -- (2)
Where the recall gives information about the absolute Accuracy of the system.
The number of all and expected hits is determined in each case of testing methods. The impact of multi-level retrieval to the efficiency of retrieval is measured, which confirms the importance of multi-level search. In addition, the ROC curves plot the true and false positive hit rate. The area under the curve reflects the efficiency of the method.
When the Object Databank database was used by EHD the provided precision and recall values can be seen in Chart 1. In Chart 2 shows the result with different threshold values.
In Chart 2 and 3 similar result graphs can be seen in that case when the HOG method was tested.
[image:4.595.37.277.577.717.2]© 2016, IRJET | Impact Factor value: 4.45 | ISO 9001:2008 Certified Journal
| Page 1188
Chart -2: Effect of threshold value change using EHDmethod. The block size is constant 10.
Chart -3
:
Effect of number of bins change using HOG method. The block size is constant 5.3.
CONCLUSIONS
Implement and test a sketch-based image retrieval system. The drawn image without modification cannot be compared with color image, or its edge representation. HOG in more cases was much better than the EHD based sketches, while in other case better results can be the search result list is refined
REFERENCES
[1] D. Comaniciu, and P. Meer, “Robust analysis of feature spaces: color image segmentation,” IEEE Conference on Computer Vision and PatternRecognition, pp. 750–755, June 1997.
[2] N. Dalal, and B. Triggs, “Histograms of oriented gradients for human detection,” IEEE Conference on Computer Vision and Pattern Recognition, pp. 886–893, July 2005.
[3] T. Deselaers, D. Keysers, and H. Ney, “Features for image retrieval: an experimental comparison,” Information Retrieval, vol. 11, pp. 77–107, December 2007.
[4] M. Eitz, K. Hildebrand, T. Boubekeur, and M. Alexa, “An evaluation of descriptors for large-scale image retrieval from sketched feature lines,” Computers and Graphics, vol. 34, pp. 482–498, October 2010.
[5] R. Fabbri, L.D.F. Costa, J.C. Torelli, and O.M. Bruno, “2D Euclidean Distance transform algorithms: a comparative survey,” ACM ComputingSurveys, vol. 44, pp. 1–44, February 2008.