© 2015, IRJET ISO 9001:2008 Certified Journal
Page 655
Texture discrimination by structuring elements using shape index
P Kiran Kumar Reddy
11
Professor & Academic In-charge, Department of CSE, NEC-G, A.P, INDIA
---***---Abstract -
This paper extends the concept of BinaryCross Diagonal Shape Descriptor Texture Matrix (BCDSDTM) by using structuring elements known as textons with the help of two separate texton images. The first one is Texton based Cross Shape Descriptor Index (TCSDI) image and second one is Texton based Diagonal Shape Descriptor Index (TDSDI) image. The proposed images are formed based on the shape descriptors on Cross Texture Unit Element (CTUE) and Diogonal Texture Unit Element (DTUE). By deriving Grey Level Co-Occurrence Matrix (GLCM) features on TCSDI and TDSDI, TCSDI Co-occurrence Matrix (TCSDI-CM) and TDSDI Co-occurrence Matrix (TDSDI-(TCSDI-CM) are formed which are used for effective discrimination of the texture.
Key Words:
Textons, GLCM features, Shape
Descriptor, Shape Index, Co-occurrence Matrix
.1. INTRODUCTION
The basic idea of textons was first introduced by Julesz as the elements of texture perception [1]. Textons refer to fundamental micro-structures in generic natural images and the basic elements in early visual perception. In practice, the study of textons has important implications on a series of problems[6,8]. Firstly, decomposing an image into its constituent components reduces information redundancy and thus leads to better image coding algorithms [16,17]. Secondly, the decomposed image representation often has much reduced dimensions and less dependence between variables therefore it facilitates image modelings which are necessary for image segmentation and recognition [18,19]. Thirdly, in biologic vision the micro-structures in natural images provide an ecologic cue for understanding the functions of neurons in the early stage of biologic vision system [20]. The main features of textons are that a significant relationship can be obtained by textons using attributes of images like spatial allocation, orientation of shape, local allocation, [14,15] etc.
The present paper extends the concept of Binary Cross Diagonal Shape Descriptor Texture Matrix(BCDSDTM) [4] by deriving two separate texton images. First one, Texton
Based Cross Shape Descriptor Index (TCSDI) image and second one, Texton based Diagonal Shape Descriptor Index (TDSDI) image. The proposed TCSDI and TDSDI are formed based on the shape descriptors on Cross Texture Unit Elements (CTUE) and Diagonal Texture Unit Elements (DTUE) [5]. By the derivation of GLCM features [10,11] on TCSDI and TDSDI, TCSDI Co-occurrence Matrix (TCSDI-CM) and TDSDI Co-occurrence Matrix (TDSDI-(TCSDI-CM) [7,9] are formed and used for effective discrimination [4].
2. FORMATION OF TEXTON IMAGE
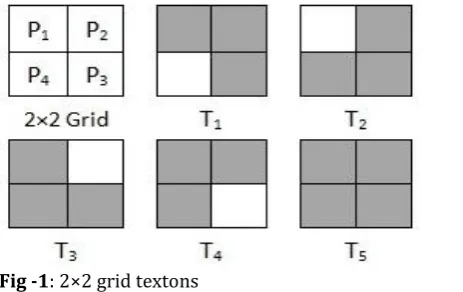
One of the important primitive that is situated and described by certain placement rule is the texton [2]. The textons are a set of evolving patterns to form various image features [12,13] sharing a universal property of the image. The present paper considers texton pattern with 2×2 grid where the pixels are referred by P1, P2, P3 and P4.
This 2×2 texton patterns are represented by five texton patterns (T1, T2, T3, T4 and T5)where three or more pixels
having same intensity levels as shown in Fig 1.
[image:1.595.309.541.601.747.2]The proposed method derived textons on each 2×2 grid of input image by shifting one column to the right until it reaches the last column. similarly, one row down until it reaches the last row of the entire image for deriving textons. The process of finding textons will be completed when it reaches the last row and the last column. Whenever a desired texton is found on a 2 × 2 grid of the image the grey levels of texton pixels remains unchanged and the pixels which are not part of any textons will be made as zeros. As an example the entire process of texton formation on 4 × 4 image is shown in Fig 2.
© 2015, IRJET ISO 9001:2008 Certified Journal
Page 656
Fig -2: Texton image formation process: (a) Grey levelimage (b) Texton detection (c)Texton image
3. TEXTON BASED CROSS AND DIAGONAL SHAPE
INDEXED IMAGES
In the present paper the Texture Unit Element (TUE) of a 3×3 neighborhood are divided into two 2×2 separate elements of 4 pixels named as Binary Cross Texture Unit Elements (BCTUE) and Binary Diagonal Texture Unit Elements (BDTUE). For these elements shape descriptor indexes(SDI) ranging from 0 to 5 are assigned. The present method derived two separate texture images called Cross Shape Descriptor Index (CSDI) image and Diagonal Shape Descriptor Index (DSDI) image derived from shape descriptor indexes of BCTUE and BDTUE respectively. The two separate CSDI and DSDI texture images are formed replacing the center pixel of the 3×3 neighborhood with shape descriptor index of BCTUE and BDTUE as shown in Fig 3. This process is repeated for entire image in an overlapped manner.
. Fig -3: Formation of Shape index on BDTUE and BCTUE
. Fig -4: Different shape descriptor images of an elephant
Fig -5: Different shape descriptor images of a car
The CSDI and DSDI of Elephant and Car images are obtained with good border images as shown in Fig 4 and Fig 5 respectively. TCSDI and TDSDI images are derived by evaluating textons on CSDI and DSDI images respectively. The grey level of CSDI and DSDI images range from 0 to 5, because the rotational invariant shape descriptor indexes of the 2×2 grid ranges from 0 to 5 only. Finally, GLCM features i.e contrast, correlation, energy and homogeneity are evaluated separately on TCSDI and TDSDI and that leads to TCSDI Co-occurrence Matrix (TCSDI-CM) and TDSDI Co-occurrence Matrix (TDSDI-CM).
4.
RESULTS AND DISCUSSION
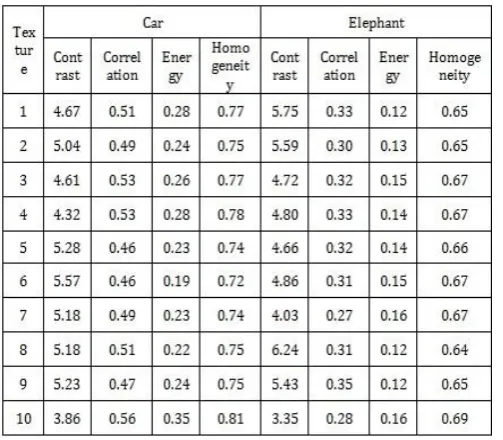
The GLCM features of TCSDI-CM and TDSDI-CM are derived on Car and Elephant images collected from Google & FGNET databases shown in Fig 6 and Fig 7. The average of GLCM features are evaluated with 0o, 45o, 90o & 135o
[image:2.595.39.284.453.626.2]with a distance of 1 on TCSDI-CM & TDSDI-CM image textures and the results are tabulated. The Tables 1, Table 2 indicates the average of GLCM feature values for Car and Elephant images of TCSDI-CM and TDSDI-CM texture images respectively. Algorithms 1 and 2 are derived based on the GLCM feature vector values for TCSDI-CM and TDSDI-CM texture images respectively to obtain effective discrimination rates. Table 3 and Chart 1 represent discrimination rates of proposed methods.
[image:2.595.307.543.528.735.2]© 2015, IRJET ISO 9001:2008 Certified Journal
Page 657
Fig -7: Images of Elephant texturesTable -1: GLCM values with 00, 450, 900, 1350 for
TCSDI-CM of Car and Elephant images change values
5. ALGORITHMS
5.1. Texture discrimination by GLCM features on
TCSDI images
Begin
if energy>= 0.19 && energy<= 0.35 print(“The texture image is car ”) else
print (“The texture image is Elephant”) End
Table -2: GLCM values with 00, 450, 900, 1350 for
TDSDI-CM of Car and Elephant images change values
5.2. Texture discrimination by GLCM features on
TDSDI images
Begin
if contrast>= 2.75 && contrast< 3.97
print (“The texture image is Elephant”) else
print (“The texture image is Car”) End
Table -3: Discrimination rates of proposed methods
Texture Database
Proposed Methods
TCSDI-CM TDSDI-CM
Elephant 80 % 100 %
Car 100 % 93 %
Average
[image:3.595.313.545.148.361.2] [image:3.595.36.288.346.566.2]© 2015, IRJET ISO 9001:2008 Certified Journal
Page 658
Chart -1: Discrimination rates of proposed methods6. CONCLUSIONS
The present paper effectively utilized the concept of structuring elements i.e textons for texture discrimination. The textons are applied on the DSDI and CSDI images which shows a good boundary with good shape features and leads for deriving two separate texture images for the input texture. Here formation of textons become simpler because the rotational invariant SDI ranges from 0 to 5 only. The proposed TCSDI-CM and TDSDI-CM methods shows high discrimination rates and also they are rotational invariant.
REFERENCES
[1] Bela Julesz, “Textons the elements of texture perception, and their interactions”, Bell labs-USA, Nature Vol 290, 1981.
[2] Song-Chun Zhu, Cheng-En Guo, What are Textons? , Springer, 62(1/2), 121–143, 2005
[3] P. Kiran Kumar Reddy, “Derivation of Shape Descriptors on Uniform Local Binary Patterns for Classification of Textures”, IJREAT International Journal of Research in Engineering & Advanced Technology, Volume 3, Issue 3, June-July, pp 12-22, 2015.
[4] P.Kiran Kumar Reddy, B.Eswar Reddy, “Texture Classification based on Binary Cross Diagonal Shape
Descriptor Texture Matrix (BCDSDTM)”, GVIP Journal,
ISSN 1687-398X, Volume 14, Issue 1, pp 45-51, August 2014.
[5] P. Kiran Kumar Reddy, B. Eswara Reddy, “Wavelet
based Texton Cross and Diagonal Shape Descriptors for Discrimination of Texture”, International Journal of Digital Signal and Image Processing (IJDSIP)Vol. 2, No. 3, pp11-26, September 2014.
[6] P. Kiran Kumar Reddy , B. Eswara Reddy, “Wavelet based Shape Descriptors using Morphology for Texture
Classification”, Global journal of Computer Science and Technology(GJCST) Volume XIV Issue I Version I,pp 21-27, 2014.
[7] P. Kiran Kumar Reddy, V. Kumar, “Texture Classification Based on Cross and Diagonal Shape
Descriptor Co-occurrence Matrix”, CiiT International
Journal of Digital Image Processing, Vol 6, No 06, pp 261-268, June-July 2014.
[8] Chen, P.C., Pavlidis, T. “Segmentation by texture using correlation”. IEEE Trans. Pattern Anal. PAMI-5, 64– 69, 1983.
[9] Davis, L.S., Johns, S.A., Aggarwal, J.K., “Texture analysis using generalized co-occurrence matrices”. IEEE Trans. Pattern Anal. PAMI-1, 251–259, 1979.
[10]Faugeras, O.D., Pratt, W.K., “Decorrelation methods of texture feature extraction”. IEEE Trans. Pattern Anal. PAMI-1, 323–332, 1980.
[11]Haralick, R.M., Shanmugam,K.K., Dinstein, I., “Texture features for image classification”. IEEE Trans. Syst. Man Cyb. 8 (6), 610–621, 1973.
[12]Weszka, J.S., Dyer, C.R., Rosenfeld, A., “A comparative study of texture measures for terrain classification”. IEEE Trans. Syst. Man Cyb. SMC-6 (4), 269–286, 1976. [13]Chellappa, R., Chatterjee, S., “Classification of textures using Gaussian Markov random fields”. IEEE Trans. Acoust., Speech, Signal Process. ASSP-33 (4), 959– 963, 1986.
[14] Cohen, F.S., Fan, Z., Patel, M.A., “Classification of rotation and scaled textured images using Gaussian Markov random field models”. IEEE Trans. Pattern Anal. 13 (2), 192–202, 1991.
[15]Cross, G.R., Jain, A.K., “Markov random field texture models”. IEEE Trans. Pattern Anal. PAMI- 5 (1), 25– 39, 1983.
[16]Kashyap, R.L., Khotanzed, A., “A model based method for rotation invariant texture classification”. IEEE Trans. Pattern Anal. PAMI-8 (4), 472–481, 1986. [17]Manjunath, B.S., Chellappa, R., “Unsupervised texture
segmentation using Markov random fields”. IEEE Trans. Pattern Anal. 13, 478–482, 1991.
[18]He, D.-C., Wang, L., “Texture unit, texture spectrum, and texture analysis”. IEEE Trans. Geo-Sci. Remote Sens. 28 (1), 509–513, 1990.
[19]Unser, M., Eden, M., “Multiresolution feature extraction and selection for texture segmentation”. IEEE Trans. Pattern Anal. 2, 717–728, 1989.
[20]Haralick, R.M., Shanmugam,K.K., Dinstein, I., “Texture
features for image classification”. IEEE Trans. Syst.
© 2015, IRJET ISO 9001:2008 Certified Journal