http://dx.doi.org/10.4236/jtts.2016.64021
Analysis of Dual-Core Type City and Its
Hinterland Contact Pattern under the
Background of High-Speed Rail
Networking—Urban Agglomeration
in Zhejiang Province as an Example
Xiaohong Ren
Economics and Management School, Chongqing Jiaotong University, Chongqing, China
Received 4 June 2016; accepted 19 July 2016; published 22 July 2016
Copyright © 2016 by author and Scientific Research Publishing Inc.
This work is licensed under the Creative Commons Attribution International License (CC BY). http://creativecommons.org/licenses/by/4.0/
Abstract
Under the background of high-speed rail networking, this paper uses the passenger trains, the type and direction of the railway via Hang Yong and its extension road line, to construct adsorp-tion and dependency index among cities, depict the contact pattern between the Hang Yong dual- core and its hinterland, measure the “net effect” that two center cities (Hangzhou, Ningbo) have on their hinterland, and estimate population agglomeration potential and future possible population flows of Zhejiang Province and the main sample cities. The result shows that, compared with Ningbo, Hangzhou has stronger radiation force to the vast majority of sample cities, and the sam-ple cities affected more by Ningbo mainly concentrates in Ningbo-Taizhou-Wenzhou along; in ad-dition, the sample cities such as Hangzhou, Ningbo and so on show better population agglomera-tion, then the population “scramble” phenomenon between cities has begun to appear.
Keywords
High-Speed Rail Networking, Contact Pattern, Measurement
1. Introduction
Since 2008, at a distance of 300 - 750 km between cities, HSR is gradually becoming the best mean of transpor-tation, and the twins linkage development era within a radius of 500 km has been opened. At present, almost every Chinese coastal province is dual-core [1]. In the group of dual-core cities which has opened HSR in the same province, Hangzhou (Hang) and Ningbo (Yong) of Zhejiang Province are fairly representative. With the opening of the Yong-tai-wen Railway, Wen-Fu Railway, Hang Yong specialized passenger railway, Shang-hai-Hangzhou intercity high-speed railway and Hangzhou high-speed rail, Zhejiang has become one of the most intensive provinces in China high-speed rail network. Hangzhou metropolitan area was selected as China first comprehensive reform experiment site of metropolitan area economic transformation and upgrading in 2014, therefore the practice of Zhejiang shoulders great times responsibility that leads Chinese cities linkage and re-gional integration. Take Zhejiang province as an example, to discuss the linkage relationship between the Hang Yong dual-core and its hinterlands in Yangtze River Delta polycentric urban system pattern, measuring Hang Yong dual city and its hinterland contact pattern under the background of high-speed rail networking are helpful to understand the evolution trend of the future contact pattern between China coastal regions as well as other urban agglomerations and provide observation sample for the linkage development between China central city and its hinterland.
A more extensive exploration on regional spatial contact patterns measurement has been made by academia. Relative research can be summed up in the following two aspects: one is describing the regional economic con-tact pattern based on population, GDP and other related socio-economic indicators [2]-[4]. The other is measur-ing the regional spatial contact pattern based on the traffic accessibility, cargo flow, passenger flow and infor-mation flow [5]-[13]. However, the possibility of cities contact and attracting scope [14] are offered by analysis based on the transportation network accessibility, but the actual flow occurred among cities can’t be represented by the index. Although analysis based on social network can judge the city’s close contact degree and the overall pattern, it can’t offer urban linkage directions, dependency or radiation relationship. Except that, proximity ef-fect and distance attenuation characteristics have been largely ignored. The study of Chen Jianjun etc. has made the beneficial attempt, but the relative importance of the category of the trains is still unable to be identified by the adoption of commuter frequency indicator between any two cities [13]. Throughout, the urgent needs are to reconstruct methodology, and to find new way of data sources, especially assessment method whose form is simple but connotation is rich [15]. Four effects caused by high-speed rail, which are space-time, border break-through, regional enhancement, and elements integration, so far lack much data to support, and the study of the influence high-speed rail has on urban system spatial pattern is mainly in form of qualitative description, syn-thesize and technology-based tool [16]. In addition, the domestic related research tends to be “heavy grade, light contact”, which lacks systematic study on directed contact between cities [17] [18]. The research based on rela-tionship data’s influence on the networking contact between cities is still rare, and research on the relarela-tionship of interaction and linkage between cities is still in the initial exploratory stage [19].
In view of this, urban agglomeration in Zhejiang Province is taken as an example to depict the space contact pattern between the Hang Yong dual-core and its hinterland, measure the “net effect” that two center cities (Hangzhou, Ningbo) have on their respective hinterland, and fit and contrast the population of Zhejiang Prov-ince and other main central cities in Yangtze River Delta, according to the passenger trains, the type and direc-tion of railway to construct adsorpdirec-tion and dependency index among cities. This research is based on the fol-lowing considerations: First, the flow of people implies most information of various elements flows. The quan-tity and structure of population are ultimate decision variables of urban development, whose flow direction de-termines physical capital, information and goods flow directions, and population scale and direction in the flow can be well characterized by the railway passenger trains and running direction. Second, because of the difficul-ties in obtaining the data, current research on the accurate measurement of urban association, which is based on the comparability, is very rare. There is no substantial change in the function of railway transportation since the 19th century, and the space-time effect based on the connection of railway passenger transportation to evaluate the high-speed networking can undoubtedly establish an analytical framework in which the urban contact pattern is more accurate.
2. Method Design and Data Collection
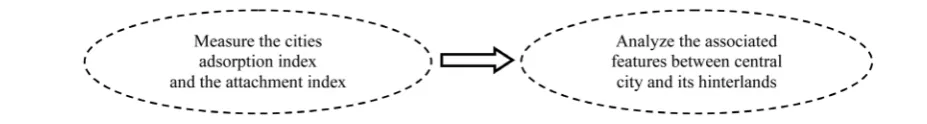
Figure 1. A flow block diagram of study method.
2.1. Delimit the Distribution Area of Sample Cities
Based on railway passenger links, to depict the correlation features of Hang Yong twins and urban agglomera-tion in Yangtze River Delta, and the geographical scope of the sample cities: Shanghai and all prefecture-level cities in Zhejiang provinces, Jiangsu provinces and Anhui provinces as well as those counties in their railway lines, part cities of Hunan, Jiangxi, Fujian via by the railway extension line, which passes Hang Yong dual cities, as well as a part of the reference cities beyond Hang Yong railway and its extension line, including Shanghai, Nanjing, Hangzhou, Ningbo, Hefei, Changsha, Nanchang, and other cities. Then based on the main railway and its extension line via Hang Yong twins, to determine the sample city unit and site. Sample cities are mainly lo-cated in Hang Yong railway line and within the distance of 500 km radius, and parts of sample cities are distri-buted in 500 - 1000 km railway extension line. What’s more, we introduce a small amount of reference cities. By screening, there are 93 sample cities and 106 sites included in the analysis and measurement at last. Among them, there is one municipality, three deputy provincial cities, 49 prefecture-level cities (including a small area of municipalities), and 40 county-level cities (districts and counties). Sample cities and its provincial domain re-fer to Table 1.
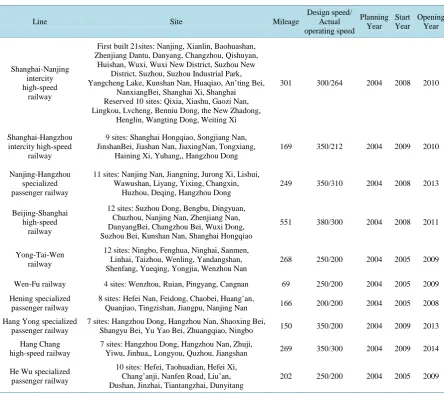
At present, the main railway lines operated in Yangtze River Delta region include Beijing-Shanghai Railway, Nanjing-Qidong Railway, Shanghai-Hangzhou Railway, Zhejiang-Jiangxi Railway, Xin Chang Railway, the Longhai Railway and other ordinary railway lines, as well as the Shanghai-Nanjing high-speed railway, Shang-hai-Hangzhou high-speed railway, Nanjing-Hangzhou high-speed railway, Beijing-Shanghai high-speed railway, Hening part of Shanghai-Chengdu high-speed railway, NingAn intercity railway, railway Ningbo-Taizhou- Wenzhou high-speed railway and other high-speed railway lines. Railways under construction include Shang-hai-Nantong railway, Lianyungang-Yancheng railway, Jiangsu coastal railway, Lian-Huai-Yang-Zhen railway, Hangzhou-Huangshan high-speed railway and Shang-He-Hang high-speed railway, etc. High-speed rail lines in Yangtze River Delta region, which have been opened and are about to open by the end of 2016 and the site de-tails are shown in Table 2.
2.2. Index Construction
According to method of Zhou Jingxiang [20] and the railway passenger trains, type and the corresponding weights to construct city’s adsorption (Adsorption) and dependency (Dependency) index. Calculation method of city’s adsorption index is
3 8
1 1
1
Adsorptivity n1 i ij
i j
j
X j n
η
= =
=
=
∑ ∑
∑
(1)where Xij is the quantity of trains, j is the weight of trains’ type, according to the importance of different train-types, the weight is decreasing in turn. I is the ways passenger trains go through the city which include “origi-nator”, “route” and “end to”, and its weight (ηi) is assigned 0.35, 0.3 and 0.35. Calculation method of city’s de-pendence index:
( ) ( )
2 8 2 8
A B A B A B
=1 1 1 1
1 1
1 1
Dependency n i ij n i ij
i j i j
j j
X j X j
n n
η η
→ ↔ ∨
= = =
= =
= ⋅ + ⋅
∑ ∑
∑ ∑
∑
∑
(2)Table 1. Sample cities and its belonging province area.
Area Main sample cities
Zhejiang
Deputyprovincial cities(Hangzhou, Ningbo); Prefecture-level cities (Wenzhou, Jiaxing, Huzhou, Shaoxing, Jinhua and Quzhou, Zhoushan, Taizhou, Lishui); County-level cities (Yuhang, Lin’an, Chun’an, Yuyao,
Fenghua, Ninghai, Rui’an, Leqing, Yongjia, Cangnan, Shangyu, Zhuji, Deqing, Changxing, Anji, Haining, Pinghu, Tongxiang, Jiashan, Haiyan, Dongyang, Yiwu, Linhai, Wenling, Sanmen)
Shanghai Municipality (Shanghai); Deputy prefecture-level cities (Songjiang, Jinshan)
Jiangsu
Deputyprovincial cities (Nanjing); Prefecture-level cities (Wuxi, Xuzhou, Changzhou, Suzhou, Nantong, Lianyungang, Huai’an, Yancheng, Yangzhou, Zhenjiang, Taizhou and Suqian); County-level cities
(Yixing, Liyang, Kunshan, Danyang, Jurong, Jiangning, Lishui)
An’hui
Prefecture-level cities (Hefei, Wuhu, Huainan, Ma’an’shan, Huaibei, Tongling, Anqing, Huangshan, Fuyang, Suzhou, Chuzhou, Liu’an, Xuancheng, Chizhou, Haoozhou);
County-level cities (Quanjiao, Dingyuan, Guangde, Dongzhi)
Jiangxi Prefecture-level cities (Nanchang, Jiujiang, Shangrao, Pingxiang, Yingtan); County-level cities (Yushan, Pengze, Hukou)
Fujian Prefecture-level cities (Fuzhou, Ningde); County-level cities(Fuding)
Hu’nan Prefecture-level cities (Changsha, Zhuzhou, Xiangtan, Changde)
Note: According to history and publicly reported data sorting summary. Table 2 is the same.
Table 2. The Yangtze River Delta high-speed rail line and the site overview.
Line Site Mileage
Design speed/ Actual operating speed Planning Year Start Year Opening Year Shanghai-Nanjing intercity high-speed railway
First built 21sites: Nanjing, Xianlin, Baohuashan, Zhenjiang Dantu, Danyang, Changzhou, Qishuyan,
Huishan, Wuxi, Wuxi New District, Suzhou New District, Suzhou, Suzhou Industrial Park, Yangcheng Lake, Kunshan Nan, Huaqiao, An’ting Bei,
NanxiangBei, Shanghai Xi, Shanghai Reserved 10 sites: Qixia, Xiashu, Gaozi Nan, Lingkou, Lvcheng, Benniu Dong, the New Zhadong,
Henglin, Wangting Dong, Weiting Xi
301 300/264 2004 2008 2010
Shanghai-Hangzhou intercity high-speed
railway
9 sites: Shanghai Hongqiao, Songjiang Nan, JinshanBei, Jiashan Nan, JiaxingNan, Tongxiang,
Haining Xi, Yuhang,, Hangzhou Dong
169 350/212 2004 2009 2010
Nanjing-Hangzhou specialized passenger railway
11 sites: Nanjing Nan, Jiangning, Jurong Xi, Lishui, Wawushan, Liyang, Yixing, Changxin,
Huzhou, Deqing, Hangzhou Dong
249 350/310 2004 2008 2013
Beijing-Shanghai high-speed
railway
12 sites: Suzhou Dong, Bengbu, Dingyuan, Chuzhou, Nanjing Nan, Zhenjiang Nan, DanyangBei, Changzhou Bei, Wuxi Dong, Suzhou Bei, Kunshan Nan, Shanghai Hongqiao
551 380/300 2004 2008 2011
Yong-Tai-Wen railway
12 sites: Ningbo, Fenghua, Ninghai, Sanmen, Linhai, Taizhou, Wenling, Yandangshan, Shenfang, Yueqing, Yongjia, Wenzhou Nan
268 250/200 2004 2005 2009
Wen-Fu railway 4 sites: Wenzhou, Ruian, Pingyang, Cangnan 69 250/200 2004 2005 2009
Hening specialized passenger railway
8 sites: Hefei Nan, Feidong, Chaobei, Huang’an,
Quanjiao, Tingzishan, Jiangpu, Nanjing Nan 166 200/200 2004 2005 2008
Hang Yong specialized passenger railway
7 sites: Hangzhou Dong, Hangzhou Nan, Shaoxing Bei,
Shangyu Bei, Yu Yao Bei, Zhuangqiao, Ningbo 150 350/200 2004 2009 2013
Hang Chang high-speed railway
7 sites: Hangzhou Dong, Hangzhou Nan, Zhuji,
Yiwu, Jinhua,, Longyou, Quzhou, Jiangshan 269 350/300 2004 2009 2014
He Wu specialized passenger railway
10 sites: Hefei, Taohuadian, Hefei Xi, Chang’anji, Nanfen Road, Liu’an, Dushan, Jinzhai, Tiantangzhai, Dunyitang
[image:4.595.90.535.329.723.2]Continued
He Bang specialized passenger railway
6 sites: Hefei, Hefei North City, Dabao Ying line Station, Shuijia Lake,
Huainan Dong, Bengbu Nan
131 350/208 2004 2009 2012
He Fu railway
11 sites: Hefei Nan, Changlin Rive, Chaohu, Wuwei, Tongling Bei, Nanling, Jingxian, Jingde,
Jixi Bei, Shexian Bei, Huangshan Bei
343 350/300 2004 2010 2015
Zheng Xu specialized passenger railway
4 sites: Dangshan Nan, Yongcheng Bei,
XiaoxianBei, Xuzhou Dong 109 350 2004 2012 2015
Ning An high-speed railway
12 sites: Nanjing Nan, Jiangning Xi, Ma’anshan Dong, Dangtu Dong, Wuhu new railway (in situ conversion), Fanchang Xi, Zhongming Bei (Reserved), Tongling, Maya (Reserved), Chizhou,
Yan Tang (Reserved), Q An’qing New
257 250 2005 2008 2015
Zheng Xu specialized passenger railway
5 sites: Dangshan Nan, Yongcheng Bei,
Xiaoxian Bei, Xuzhou Dong, Lianyungang (New plus) 109 350 2005 2012 2016
2.3. Data Collection
The actual city passenger train data used in this paper is all from the website: Where to go. Where to go provides sites, lines, trains and other information of railway passenger transportation query time between April 20, 2015-May 20, 2015.City site information includes all trains and types of the “originator”, “route” and “end to” in railway stations. After choosing departure and arrival, information of the line shows all trains and types of the “originator”, “route” and “end to”. When making data statistics of city sites and passenger trains between cities, according to the type of trains (G, C, D, Z, T, K, L, O, etc.) to classify, to distinguish the importance of different types of trains in urban linkages. Empirical part involves urban household population, the resident population, GDP, total fixed asset investment as well as its growth rate of the whole society and other variables, whose data is derived from “National Economy and Social Development Statistics Bulletin” and “Government Work Report” of the city over the years. What is more, other data that can’t be obtained is filled by “China city statistical Yearbook” and “regional economic China statistical Yearbook”.
3. Calculation Results
After 2008, high-speed rail lines are opened one after another in the Yangtze River Delta region, which increas-es the uncertainty of the city population size and flow direction. Transportation system reform caused by high- speed rail is changing the spatial connection and development pattern among cities.
3.1. Adsorption Capacity and Spatial Distribution Pattern of Hinterland Cities
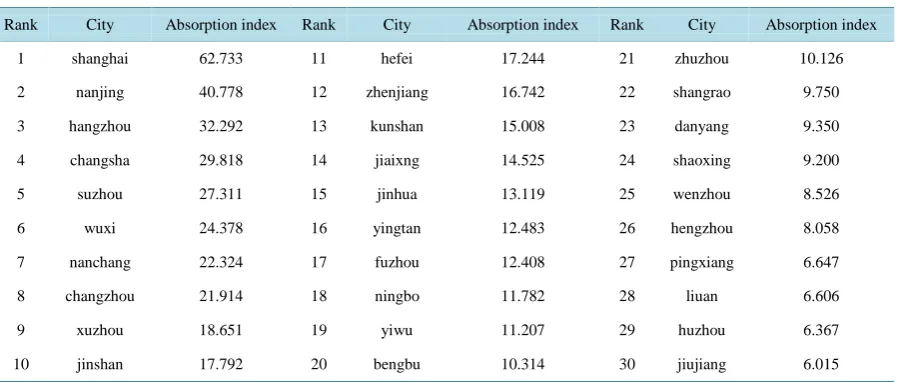
According to the adsorption capacity of sample cities calculated by Formula (1), the cities whose absorption in-dex greater than 20 are Shanghai, Nanjing, Hangzhou, Suzhou, Wuxi and Changzhou, and three cities of the top are Shanghai, Nanjing and Hangzhou, whose city absorption index in order are 62.73, 40.78, and 32.29. Shang-hai’s is nearly 20 more than Nanjing’s which ranked second, showing a very strong adsorption capacity of the population. Cities whose absorption index ranges from 10 to 20 include: Xuzhou, Jinshan, Hefei, Zhenjiang, Kunshan, Jiaxing, Jinhua, Ningbo, Yiwu, Bengbu; absorption index ranges from 5 to 10: Danyang, Shaoxing, Wenzhou, Quzhou, Huzhou, Yuyao, Taizhou, Haining, Yixing, Zhuji; absorption index less than 5: Chuzhou Shangyu, Tongxiang, Changxing, Huainan, Wenling, Liyang, Deqing, Quanjiao, Jiashan, Fuyang, Yushan and Songjiang etc. Take Zhoushan as an example of reference points of the city although located in the axis of de-velopment (Shaoxing, Huzhou) or have special industries (Zhoushan’s Fishery), the absorption index is 0 due to traffic inconvenience. Table 3 shows the top 30 sample cities and their rank features, and Figure 2 shows their spatial distribution.
3.2. The Dependency Pattern of Hinterland Cities on the Central City
Figure 2. The spatial distribution of the top 30 cities of Adsorption index. Note: Figure 2 and Figure 3 respectively com-bined with data of Table 3 andTable 4, draw according to the city's latitude and longitude.
Table 3. Absorption index and its rank of sample cities in Zhejiang province.
Rank City Absorption index Rank City Absorption index Rank City Absorption index
1 shanghai 62.733 11 hefei 17.244 21 zhuzhou 10.126
2 nanjing 40.778 12 zhenjiang 16.742 22 shangrao 9.750
3 hangzhou 32.292 13 kunshan 15.008 23 danyang 9.350
4 changsha 29.818 14 jiaixng 14.525 24 shaoxing 9.200
5 suzhou 27.311 15 jinhua 13.119 25 wenzhou 8.526
6 wuxi 24.378 16 yingtan 12.483 26 hengzhou 8.058
7 nanchang 22.324 17 fuzhou 12.408 27 pingxiang 6.647
8 changzhou 21.914 18 ningbo 11.782 28 liuan 6.606
9 xuzhou 18.651 19 yiwu 11.207 29 huzhou 6.367
10 jinshan 17.792 20 bengbu 10.314 30 jiujiang 6.015
Note: According the results by author’s calculation, then sort out this table.
Shanghai, Hangzhou, Ningbo, Nanjing and Hefei. The dependency index of Hangzhou to Shanghai is 525.1, and Shanghai to Hangzhou is 340.2. The dependency index of Shanghai to Nanjing is 634.3, and Nanjing to Shang-hai is 884.55. Likewise, Hangzhou to Ningbo is 239.2, and Ningbo to Hangzhou is 179.3, Hangzhou is most closely related to Ningbo in the five cities, and the following city is Shanghai, whose dependency index to Ningbo is 108.95, and converse is 171.1. It is not difficult to find that there are significant spatial differences in the strength and direction of contact between each two cities of five cities. As shown in Table 4.
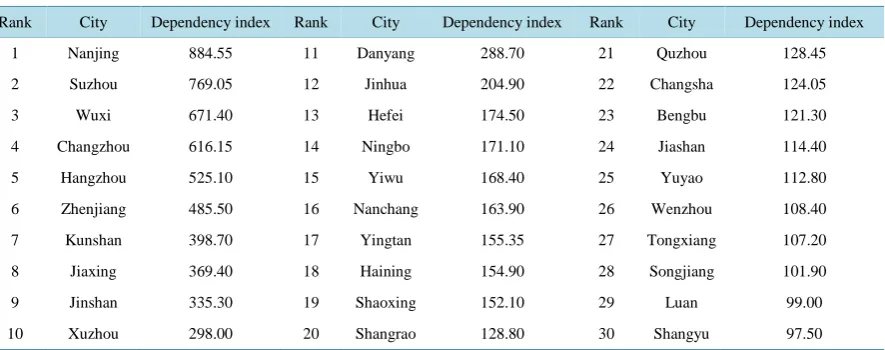
Next measure the dependency pattern of sample cities to regional center (Shanghai). Among them, the de-pendencyof Nanjing to Shanghai is the strongest, followed by four cities: Suzhou, Wuxi, Changzhou and Hangzhou, and their respective dependency indexes to Shanghai in the order are884.55, 769.05, 671.4, 616.15 and 525.1. The dependency index of Ningbo to Shanghai is 171.1, ranking 14th. These cities, which are not in the Yangtze River Delta and with a longer space distance away from Shanghai, such as Nanchang, Yingtan, Shangrao, Changsha, to Shanghai’s dependency index also enter the top 30. The cities of the top 30 of depen-dency index gather in Nanjing to Shanghai, Shanghai to Hangzhou, but are relatively sparse between Hang Yongtwins, as is shown in Figure 3. Comparing Figure 2 with Figure 3, it is not difficult to find that there is great overlapin the dependency index between the sample cities and the cities of the top 30 of dependency index. The latter’s concentration degree between Shanghai-Hangzhou, Shanghai-Nanjing and Hang Yong is higher than the former. The top 30 cities of dependency index are shown in Table 5.
[image:6.595.91.540.244.435.2]Figure 3. The spatial distribution of the top 30 cities toward Shanghai Dependency index. Note: Figure 2 and Figure 3 re-spectively combined with data of Table 3 andTable 4, draw according to the city's latitude and longitude.
Table 4. Passenger trains contact and dependency index between core cities in the Yangtze river delta.
Contact direction Dependency index Contact direction Dependency index Contact direction Dependency index Contact direction Dependency index Contact direction Dependency index Hangzhou to
Shanghai 525.10
Nanjing to
Shanghai 884.55
Hangzhou
to Ningbo 239.20
Hangzhou to
Hefei 52.00
Ningbo
to Hefei 36.60
Shanghai to
Hangzhou 340.20
Shanghai to
Nanjing 634.30
Ningbo to
Hangzhou 179.30
Hefei to
Hangzhou 87.95
Hefei to
Ningbo 49.75
Ningbo to
Shanghai 171.10
Hefei to
Shanghai 174.50
Hangzhou
to Nanjing 240.40
Ningbo to
Nanjing 121.40
Nanjing
to hefei 86.00
Shanghai to
Ningbo 108.95
Shanghai to
Hefei 127.50
Nanjing to
Hangzhou 254.15
Nanjing to
Ningbo 112.85
Hefei to
Nanjing 135.00
Note: According the results by author’s calculation, then sort out this table.
Table 5. Dependency index and its rank of hinterland cities to Shanghai (At the top of 30).
Rank City Dependency index Rank City Dependency index Rank City Dependency index
1 Nanjing 884.55 11 Danyang 288.70 21 Quzhou 128.45
2 Suzhou 769.05 12 Jinhua 204.90 22 Changsha 124.05
3 Wuxi 671.40 13 Hefei 174.50 23 Bengbu 121.30
4 Changzhou 616.15 14 Ningbo 171.10 24 Jiashan 114.40
5 Hangzhou 525.10 15 Yiwu 168.40 25 Yuyao 112.80
6 Zhenjiang 485.50 16 Nanchang 163.90 26 Wenzhou 108.40
7 Kunshan 398.70 17 Yingtan 155.35 27 Tongxiang 107.20
8 Jiaxing 369.40 18 Haining 154.90 28 Songjiang 101.90
9 Jinshan 335.30 19 Shaoxing 152.10 29 Luan 99.00
10 Xuzhou 298.00 20 Shangrao 128.80 30 Shangyu 97.50
Note: According the results by author’s calculation, then sort out this table.
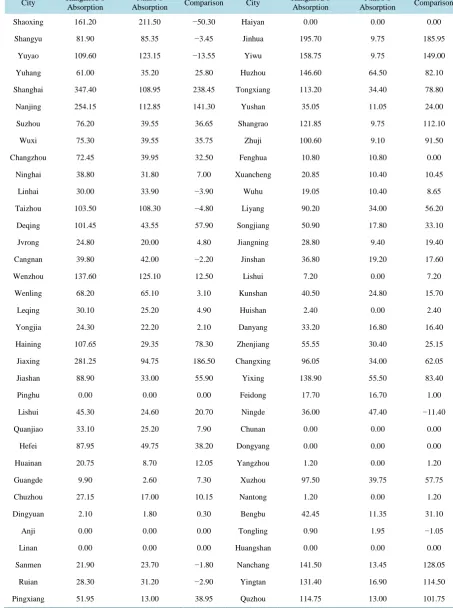
jority sample cities, Hangzhou’s radiation is more significant than Ningbo’s, and Ningbo’s radiation, only to Shaoxing, Shangyu, Yuyao, Ninghai, Linhai, Taizhou, Shen Fang, Chizhou, Cangnan, Fuzhou, Wenling, Yueq-ing, Yongjia, Xiapu, FudYueq-ing, Ningde, Lin’an, Rui’an and other 19 cities, is relatively strong. These cities, except for Shaoxing, Yuyao and Shangyu, mainly gather in Yong Tai Wen Railway along. Except the cities mentioned above, Ningbo’s radiation to the other sample cities is less significant than Hangzhou’s. The “net effect” which Hang Yong has on their respective hinterland cities is shown in Table 6.
3.4. Urban Population Agglomeration Potential under the Center-Periphery Pattern
[image:7.595.96.539.406.581.2]Table 6. Comparison on the net adsorption capacity of Hang Yong twins to hinterland cities.
City Hangzhou’s Absorption Absorption Ninbo’s Comparison City Hangzhou’s Absorption Absorption Ninbo’s Comparison
Shaoxing 161.20 211.50 −50.30 Haiyan 0.00 0.00 0.00
Shangyu 81.90 85.35 −3.45 Jinhua 195.70 9.75 185.95
Yuyao 109.60 123.15 −13.55 Yiwu 158.75 9.75 149.00
Yuhang 61.00 35.20 25.80 Huzhou 146.60 64.50 82.10
Shanghai 347.40 108.95 238.45 Tongxiang 113.20 34.40 78.80
Nanjing 254.15 112.85 141.30 Yushan 35.05 11.05 24.00
Suzhou 76.20 39.55 36.65 Shangrao 121.85 9.75 112.10
Wuxi 75.30 39.55 35.75 Zhuji 100.60 9.10 91.50
Changzhou 72.45 39.95 32.50 Fenghua 10.80 10.80 0.00
Ninghai 38.80 31.80 7.00 Xuancheng 20.85 10.40 10.45
Linhai 30.00 33.90 −3.90 Wuhu 19.05 10.40 8.65
Taizhou 103.50 108.30 −4.80 Liyang 90.20 34.00 56.20
Deqing 101.45 43.55 57.90 Songjiang 50.90 17.80 33.10
Jvrong 24.80 20.00 4.80 Jiangning 28.80 9.40 19.40
Cangnan 39.80 42.00 −2.20 Jinshan 36.80 19.20 17.60
Wenzhou 137.60 125.10 12.50 Lishui 7.20 0.00 7.20
Wenling 68.20 65.10 3.10 Kunshan 40.50 24.80 15.70
Leqing 30.10 25.20 4.90 Huishan 2.40 0.00 2.40
Yongjia 24.30 22.20 2.10 Danyang 33.20 16.80 16.40
Haining 107.65 29.35 78.30 Zhenjiang 55.55 30.40 25.15
Jiaxing 281.25 94.75 186.50 Changxing 96.05 34.00 62.05
Jiashan 88.90 33.00 55.90 Yixing 138.90 55.50 83.40
Pinghu 0.00 0.00 0.00 Feidong 17.70 16.70 1.00
Lishui 45.30 24.60 20.70 Ningde 36.00 47.40 −11.40
Quanjiao 33.10 25.20 7.90 Chunan 0.00 0.00 0.00
Hefei 87.95 49.75 38.20 Dongyang 0.00 0.00 0.00
Huainan 20.75 8.70 12.05 Yangzhou 1.20 0.00 1.20
Guangde 9.90 2.60 7.30 Xuzhou 97.50 39.75 57.75
Chuzhou 27.15 17.00 10.15 Nantong 1.20 0.00 1.20
Dingyuan 2.10 1.80 0.30 Bengbu 42.45 11.35 31.10
Anji 0.00 0.00 0.00 Tongling 0.90 1.95 −1.05
Linan 0.00 0.00 0.00 Huangshan 0.00 0.00 0.00
Sanmen 21.90 23.70 −1.80 Nanchang 141.50 13.45 128.05
Ruian 28.30 31.20 −2.90 Yingtan 131.40 16.90 114.50
Continued
Liling 27.10 0.00 27.10 Zhousahn 0.00 0.00 0.00
Zhuzhou 32.20 7.80 24.40 Lianyungang 0.00 0.00 0.00
Changsha 83.00 5.60 77.40 Taizhou 1.20 0.00 1.20
Jiujiang 7.80 1.95 5.85 Huaian 0.00 0.00 0.00
Hukou 0.90 1.95 −1.05 Yancheng 0.00 0.00 0.00
Pengze 0.90 1.95 −1.05 Anji 0.00 0.00 0.00
Dongzhi 0.90 1.95 −1.05 Luan 26.80 15.85 10.95
Chizhou 0.90 1.95 −1.05 Bozhou 8.05 5.60 2.45
Fuzhou 61.80 71.10 −9.30 Maanshan 5.30 0.00 5.30
Xiapu 32.40 35.70 −3.30 Huaibei 0.90 0.00 0.90
Fuding 30.60 36.00 −5.40 Fuyang 10.90 5.60 5.30
Note: According the results by author’s calculation, then sort out this table. “+” is the Hangzhou’s “Net absorption”, “−” is the Ningbo’s “Net absorp-tion”, the size of the numerical represent the size of the “net absorption”.
population flow. With Shanghai as the center, embedding the dependency index of the hinterland cities to Shanghai, we inversely deduce its “arrival” population scale, then generally judge the hinterland cities’ popula-tion scale in deviapopula-tion, growing space and flow direcpopula-tion, and reveal characteristics of populapopula-tion agglomerapopula-tion and diffusion between hinterland city and Shanghai.
Dependency index of hinterland cities to Shanghai and its fitting resident population (2014) show strong posi-tive correlation, as is showed in Figure 4, 2
0.3337
R = . Taking cities at prefecture level and above of Zhejiang Province and some of the major cities in the Yangtze River Delta as an example, according to the dependency index of hinterland cities to Shanghai, we fit their population scale. By comparing each hinterland city’s fitting population and resident population, we find that, the fitting population scale of Jiaxing, Huzhou, Jinhua, Quzhou, Zhoushan, and Lishui in Zhejiang province, and Nanjing, Wuxi, and Changzhou in Jiangsu province is greater than their actual resident population scale in 2014. To a certain extent, these cities’ population scale is “small”, and there is still some room for its growth. The fitting population scale of Hangzhou, Ningbo, Wenzhou, Shaoxing, Taizhou, Suzhou and Hefei is smaller than the actual resident population scale, revealing better clus-tering ability. The result is shown in Table 7.
Compare changes on the resident population of cities at prefecture level and above in Zhejiang province since 2006, we find that except for Quzhou, the resident population showed an increasing trend in the rest cities before 2010. The resident population of Hangzhou, Ningbo, Shaoxing, Huzhou, Jiaxing, Jinhua, Zhoushan and Lishui in 2014 increased than that of 2013 Among them, Ningbo showed the largest growth, reaching 14.8 million people, followed by Hangzhou, with an increase of 4.8 million. Hang Yong twins both show great population clustering ability, and Quzhou remains constant, while the resident population of Wenzhou and Taizhou, which take on a greater population absorption ability, has decreased, as is shown in Figure 5.
4. Conclusions
Placing Hang Yong twins into the background of the Yangtze River Delta, the paper is based on the Dependency and Absorption index of railway passenger trains to depict the contact pattern between dual-core-type city and its hinterland, and to measure the “net effect” that two central cities of Zhejiang have on their respective hinter-land city. By doing this, fit and compare the population agglomeration between Zhejiang province and the major cities in the Yangtze River Delta. The study finds that:
Figure 4. The relationship between Dependence index and the city’s resident population (2014). Note: The figures are drawn according to the statistical bulletin of the city over the years and the author’s calculation, the abscissa in Figure 4 represents the Dependency index of part cities in Zhejiang and the Yangtze River Delta, toward Shanghai.
Figure 5. The resident population of major cities in Zhejiang province (2006-2014). Note: The figures are drawn according to the statistical bulletin of the city over the years and the author’s calculation, the abscissa inFigure 4 represents the
De-pendency index of part cities in Zhejiang and the Yangtze River Delta, toward Shanghai.
Table 7. The fitting population and deviation of Zhejiang province prefecture-level cities above and major cities in the Yangtze river delta.
Region Dependency index
Resident population
Household population
Fitting
population Deviation Region
Dependency index
Resident population
Household population
Fitting
population Deviation
Hangzhou 525.10 889.20 715.76 858.66 30.54 Zhoushan 0.00 114.60 97.49 344.90 −230.30
Ningbo 171.10 781.10 583.80 512.30 268.80 Taizhou 82.60 601.50 597.10 425.72 175.78
Wenzhou 108.40 906.80 813.69 450.96 455.84 Lishui 0.90 213.10 265.65 345.78 −132.68
Jiaxing 369.40 457.00 348.14 706.32 −249.32 Nanjing 884.55 821.61 648.72 899.60 −77.99
Huzhou 9.10 293.00 263.78 353.80 −60.80 Suzhou 769.05 1060.40 661.08 835.98 224.42
Shaoxing 152.10 495.60 443.04 493.71 1.89 Wuxi 671.40 650.01 477.14 782.20 −132.19
Jinhua 204.90 543.70 475.07 545.37 −1.67 Changzhou 616.15 469.60 368.60 751.77 −282.17
Quzhou 128.45 212.40 255.67 470.58 −258.18 Hefei 174.50 769.60 712.81 508.50 261.10
Note: “+”indicates “too much”; “−” indicates “inadequate”, thus there still remains a huge space to absorb the population.
[image:10.595.89.538.505.651.2]Acknowledgements
The author gratefully acknowledges financial support from the National Social Science Fund Project (Grant No.: 16BJL121) and Humanities and social science fund of the Ministry of Education (Grant No.: 14YJAZH064). Thank Dan Ting and Du Zongyang for the contribution in translation, and thank Dr. Zhou Jingxiang for the helpful suggestions to this paper.
References
[1] Zhou, J.X. (2014) Twins Linkage Era—Dumbbell Twins Seek Common Development Is the Trend, the City Will Move to Integrate in the Competition. http://news.163.com/14/1214/12/ADE6T5NF00014AED.html
[2] Li, Y. and He, C.F. (2013) Analysis of Urban Agglomeration Economic Spatial Evolution in Yangtze River Delta Based on the “3D” Framework. Economic Geography, 33, 43-46.
[3] Li, T. (2012) The Relationship between Spatial Pattern of Traffic Accessibility and Population Change in the Pearl River Delta. Scientia Geographica Sinica, 9, 1661-1672.
[4] Wang, L. and Duan, X.J. (2009) Study on the Relationship between Population and Economic Spatial Distribution in the Yangtze River Delta. Economic Geography, 29, 1619-1623.
[5] Zhang, W.C. (1988) Tile Research on Passenger Interflow among Regions in China. Scientia Geographica Sinica, 8, 313-322.
[6] Goetz, A.R. (1992) Air Passenger Transportation and Growth in the US Urban System 1950-1987. Growth and Change, 23, 218-242. http://dx.doi.org/10.1111/j.1468-2257.1992.tb00580.x
[7] Rimmer, P.J. (1999) Flow of Goods, People and Information among Cities of Northeast Asia. The Korean Journal of Regional Science, 15, 39-74.
[8] Jin, F.J. and Zhang, W.C. (1991) Research on Interprovincial Transport Linkage in Railway Freight System. Scientia Geographica Sinica, 11, 1929.
[9] Meng, D.Y. and Lu, Y.Q. (2012) Analysis of Inter-Provincial Accessibility and Economic Linkage Spatial Pattern Based on the Railway Network. Geographical Research, 31, 107-122.
[10] Jiang, Y. (2012) Study on Space Contact Pattern in the County of Zhejiang Province Based on the Angle of Traffic Flow. Economic Geography, 32, 73-78.
[11] Wen, Y.Z., Zhong, Y.X. and Huang, J. (2013) The Influence of Traffic Network Evolution on the Range of Hinterland in the Central City—Jiangxi Province as a Example. Economic Geography, 6, 59-65.
[12] Chen, W.J., Ma, X.G., Cai, L.L., et al. (2013) Study on the Spatial Pattern Feature of the Cities Contact in the Pearl River Delta—Based on the Analysis of the Intercity Passenger Traffic Flow. Economic Geography, 33, 48-55.
[13] Chen, J.J., Zheng, G.J. and Liu, Y. (2014) The Influence of High-Speed Railway on the Evolution of Spatial Contract Pattern in the Yangtze River Delta. Economic Geography, 8, 54-60, 67.
[14] Zhang, L., Lu, Y.Q. and Zhao, Y.Z. (2009) The Division of City Attractive Range Based on Time Accessibility: The Yangtze River Delta as an Example. Geographical Research, 28, 803-816.
[15] Wu, J.S., Liu, H., Peng, J. and Ma, L. (2014) Hierarchical Structure and Spatial Pattern of City System in China—An Empirical Study Based on DMSP/OLS Nighttime Light Data. Acta Geographica Sinica, 6, 759-770.
[16] Wang, J.X. and Lin, C.H. (2011) The Influence of High-Speed Railway on City Spatial Evolution: Based on Analysis Ideas of Chinese Characteristics, City Development and Its Influencing Factors. Urban Planning International, 26, 16- 23.
[17] Yang, Y.C., Ling, B.R., Tan, Y.M. and Li, T.T. (2011) The World City Network Research Theory, Methods and Its Enlightenment to the Study of City System. Geographical Research, 6, 1009-1020.
[18] Bao, C. and Chen, X.J. (2014) Review and Prospect of the Study on the Spatial Pattern of Urban System in China. Pro- gress in Geography, 33, 1300-1311.
[19] Bi, X.J. and Ning, Y.M. (2013) Spatial Econometric Analysis of Metropolitan Area Spatial Spillover in Yangtze River Delta and Urban Agglomeration Diffusion. Economic Geography, 1, 46-53.
Submit or recommend next manuscript to SCIRP and we will provide best service for you: Accepting pre-submission inquiries through Email, Facebook, LinkedIn, Twitter, etc.
A wide selection of journals (inclusive of 9 subjects, more than 200 journals) Providing 24-hour high-quality service
User-friendly online submission system Fair and swift peer-review system
Efficient typesetting and proofreading procedure
Display of the result of downloads and visits, as well as the number of cited articles Maximum dissemination of your research work