Theoretical Study of Electromagnetic Wave Propagation:
Gaussian Bean Method
E. I. Ugwu, J. E. Ekpe, E. Nnaji, E. H. Uguru
Department of Industrial Physics, Ebonyi State University, Abakaliki, Nigeria Email: [email protected]
Received March 21, 2013; revised April 21, 2013; accepted April 29, 2013
Copyright © 2013 E. I. Ugwu et al. This is an open access article distributed under the Creative Commons Attribution License, which permits unrestricted use, distribution, and reproduction in any medium, provided the original work is properly cited.
ABSTRACT
In this work, we present the study of electromagnetic wave propagation through a medium with a variable dielectric
function using the concept of Gaussian Beam. First of all, we start with wave equation
2
2 2
2 0
r
E E
t
with
which we obtain the solution in terms of the electric field and intensity distributions approximate to Gaussian Function,
2 2
2
, e
r x y
I
. With this, we analyze the dependency of r on Gaussian beam distribution spread, the distant from the
axis at which the intensity of the beam distribution begins to fall at a given estimate 12
e of its peak value. The influ-ence of the optimum beam waist wo and the beam spread on the intensity distribution will also be analyzed.
Keywords: Electromagnetic Wave; Wave Equation; Dielectric Medium; Distribution; Gaussian Function; Intensity;
Electric Field; Beam Waist; Wave Propagation
1. Introduction
Along with the rapid evolution of fiber optics, integrated optics and application of laser in both medicine and technology, there has been a growing interest in the study of Gaussian beam propagation. This is based on the fact that Gaussian beam has to do with focusing and modifi-cation of shape of propagating electromagnetic wave or laser beam. From the earlier finding on the research on laser beam, it has been found that laser beam propagation can be approximated by an ideal Gaussian beam intensity profile [1,2]. Understanding of the basic properties of Gaussian beam has been specifically found to be very vital. I select the best optics for practical application [3]. Sequel to this, lots of scientists had worked on Gaussian beam applications in electromagnetic wave propagation and in optics. For instance, a work has been carried out on nonspecular phenomena for beam reflection at mono- layer and multilayered dielectric interface respectively from where it has revealed that under various conditions nonspecular beam phenomena is more realizable [4-6]. Tamir on his own presented a unified and simplified analysis of the lateral and longitudinal displacement with
angular deflection on reflection of a Gaussian beam at a dielectric interface with two or more layer [7,8].
However in this paper, we intend to study electromag-netic wave propagation using the concept of Gaussian beam starting from general wave equation with which obtain the Gaussian function in which waves operating on the fundamental transverse mode is approximated to Gaussian profile. The distribution profile is analyzed with intent to observe the influence of the beam waist on the profile.
2. Theoretical Framework
In this case we start with wave equation in terms of elec-tric field given as
2
2 2
0 2 0
r
E E
t
(1)
where r is the dielectric constant as a function wave
solution of the form
, , , exp r
EE x y z itk
r (2)re-fractive index, we have
2
0 0
r
E
2 (3) where the propagation constant in the medium is given by
0
r
k (4)
With this, Equation (2) becomes
2 2
E k r E
(5)
In general, if the medium is absorbing or exhibit gain, the its dielectric constant r is considered to have real
and imaginary part, but in a situation where the medium conducts with conductivity . then the complex propa-gation vector is introduce which obeys.
2 2
0
1
r
r
k i
[9]. (6)
However, a simple solution of this type is inadequate to describe the field distributions of transverse mode. As a result, we seek solution to the plane wave equation of the form.
0 , , exp z
EE x y z ik (7)
Propagating in the z-direction and localized the z-axis. Thus the idea is to obtain a solution of the wave equation that gives phase front that can be approximated over a narrow region. Thus substituting Equation (7) into Equa-tion (4) we obtain.
2 2 2
0
2 2 2 2
E E E E
ik z
x y z
0 (8)
Since we are looking for a paraxial beam-like solution, then E0 varies slowly with z and Equation (8) becomes
2 2
0
2 2 0
E E E zik z x y
(9)
With a solution given as
20 , , exp
k
E x y z ip z r
w z 2 (10)
where is the square distant of the points x, y from the axis of propagation where
2 2
r x y
z
p and q z are beam parameters Equation (10) gives the fundamen-tal Gaussian beam of time-independent wave equation.
3. Intensity of Gaussian Beam
The intensity of I x y, of Gaussian beam is given by
, 2 exp exp 2 2 x y z z I EE k kip z r ip r
q z q
where p z
and
z
q are the complex conjugate of z
p and q z respectively hence
2 1 1
exp z z exp
z
z z
ikr
EE ip p
z q q
(12)
Considering two real beam parameters that R z and
relating to q z by depend on z
2
1 1 ,
z
i
q R w
(13)
z
p is that describes the axial distance from the Gaus-sian beam waist.
We can express Equation (11) as
2
2 2
exp 2
ikr i i
EE w w
(14)
1
2 2 2 exp x y r I w
(15)
Signifying the dependency of Gaussian beam intensity to r while w signifies the distance from the axis at z
where the intensity of the beam falls to 12
e of it its peak value on the axis p z total power of the beam with these parameters Equation (10) is now written as
22 1 exp 2 z kr i
E i kz p
R
(16)
z
p is evaluate to give
0
qq z (17)
where 0 is a constant of integration the expresses the
value of the beam parameter at the plane q
0
z for
which when we consider d ,
d o
p i
z q qz we obtain
z
In 0
Inp i zq i q0
(18)where iIn q0 defines a constant of integration
sub-stituting Equation (18) into (16) we have 2
2 0
1
exp In 1 z kr i
E i kz i
q z R
(19) The factor exp i
p is a constant phase factor. Thus
2
2 0
1
exp In 1 z kr i
E i kz i
q z R
(20)
2
(11)
4. Diffraction Effect
quickly acquires curvature and begin to spread in accor-dance with
2 2 0
1
z
w
R z
z
(21)
and
1 2
2
0 2
0
1
z
z
w w
w
(22)
where z is the distance propagated from the plane where the wave-front is flat wavelength of light,
is the radius of the 12
e irradiance contour at the
w
plane where wave-front is flat, w z is the radius of the
2
1
e contour after the wave has propagated a distance
z.
Considering the optimum starting beam radius for a
distance z, we have
1 2
0 ,
z w
Equation (22) can
be reduced to
z 32 0
w w (23)
With the irradiance distance distribution of the Gaus-sian beam described as
2 2
0 2 2
2 2
exp exp
r r p
I I
w 2
2r
(24)
where ww z and is the total power in the beam which is the same at all cross sections of the beams we also obtain that
p
2
2 0 2
0
3 2
In 2
2
r I
r r
I w
(25)
2 2
0 0
In Ir 3
x y
I
(26) at optimism starting beam radius for a given distance,
z.
0 2
2p
0
I w
w
(27)
5. Discussion
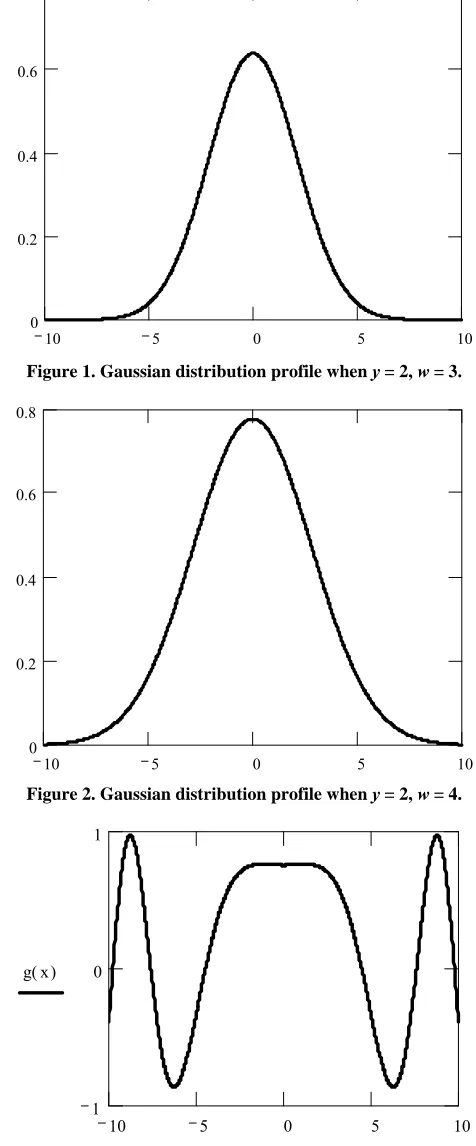
From the displayed results in Figure 1, the distribution
profile when y = 2, x = 2 and w = 2, the distribution beam
width ranged within −5 to 5, In Figure 2, for y = 2 and x
= 3 when w = 2, the width of the beam ranged from −6.5
to 6.5. In Figures 3 and 4 the distribution profiles
dis-played is found to be departed from normal distribution shape as in the other figures when w is increased to 5 for
10 5 0 5 10
[image:3.595.60.534.84.659.2]0 0.2 0.4 0.6 0.8
Figure 1. Gaussian distribution profile when y = 2, w = 3.
10 5 0 5 10
0 0.2 0.4 0.6 0.8
Figure 2. Gaussian distribution profile when y = 2, w = 4.
g x( )
x
10 5 0 5 10
1 0 1
Figure 3. Gaussian distribution profile when y = 2, w = 5.
y = 2 when w = 10, the departure became more
pro-nounced pattern as shown in Figure 5. However, the
[image:3.595.301.539.95.668.2] [image:3.595.112.251.112.209.2]f x( )
x
10 5 0 5 10
[image:4.595.57.290.83.249.2]1 0 1 2
Figure 4. Gaussian distribution profile when y = 2, w = 5.
f x( )
x
10 5 0 5 10
[image:4.595.311.533.217.560.2]1 0 1
Figure 5. Gaussian distribution profile when λ = 0.50 m, y = 2, w = 10.
contour radius as displayed in Figure 6 indicate the fact
that as the contour decreases, the beam distribution tap-pers showing that there is a point known as spot size
where the intensity of the distribution is fallen to 1 e. This indicates that Gaussian distribution function de-pends on r as shown in Equation (16) that depicts char-acteristic of normal distribution function.
However, the shape of the distribution depends gener-
ally on diameter at which the intensity has fallen of 1 e as in Figure 7 when x = y coupled with the optimum
beam waist that is given as
1 2
optimum
o
z w
,
axial distance and Raleigh range which is given in Equa-
tion (22) with o R
w z
[9] These values provide the
best combination for minimum starting beam diameter for good minimum spread according to [10] whose ratio
is w z
z over a distant z and a particular wavelength. Figure 8
6. Conclusions
Gaussian intensity profiles as observed from this study seem to manifest one feature that is based on the fact that beam waist, w plays a role in determining the distribution
profile. This explains the fact that the far-field divergence
[image:4.595.59.286.263.443.2]Figure 6. Percentage irradiance.
Figure 7. Gaussian distribution intensity as function of pro-file width, w.
[image:4.595.310.539.600.707.2]must be measured at a distance greater than the half width of intensity distribution while the near or mid-field di-vergence values are obtained by measuring a distance less than the half width of the intensity distribution in order to obtain a good normal distribution profile. Therefore in order to achieve optimum beam spread, and collimation over a distance, the optimum starting beam radium/waist must be determined. Though one should note that this depends strictly on the type of beam that is whether the beam is coherent or not, the general expression for opti-mum starting beam radius for any given distance, z is
1 20 optimum .
z
w
This study also reveals that the concept of Gaussian beam is realizable when it is focused on a small spot as it spreads out rapidly as it propagate away from the spot From Figures 3 to 6, it is clearly shown that at certain
value of the beam waist, the distribution profile changes. Therefore for a beam to be well collimated, it must have a large diameter. This relation is as a result of diffraction. Thus in order to achieve normal Gaussian beam distribu-tion, the product of the width and divergence of the beam profile must be as small as possible to be achieved when paraxial approximation is considered. Thus this implies that the idea of Gaussian beam model is realizable and valid only for beam whose width is larger than that of equation.
REFERENCES
[1] A. Siegman, “Lasers Sensitization,” C.A University
Sci-ences Books, 1986.
[2] S. A. Self, “Focusing of Spherical Gaussian Beam,” Ap-plied Optics, Vol. 22, No. 5, 1983, pp. 658-661.
[3] H. Sun, “Thin Lens Equation for a Real Laser Beam with Weak Lens Aperture Truncation,” Optical Engineering, Vol. 37, No. 11, 1998, pp. 2903-2913.
http://dx.doi.org/10.1117/1.601877
[4] J. W. Ra, H. L. Bertoni and L. B. Felsen, “Reflection and Transmission of Beam at Dielectric Interface,” SIAM Journal on Applied Mathematics, Vol. 24, No. 3, 1973, pp. 396-413.
[5] M. McGuirik and C. K. Carniglia, “An Angular Spectrum Representation Approach to the Goos-Hänchen Shift,” Journal of the Optical Society of America, Vol. 67, No. 1, 1977, pp. 103-107.
http://dx.doi.org/10.1364/JOSA.67.000103
[6] R. P. Riesz and R. Simon, “Reflection of a Gaussian Beam from a Dielectric Slab,” Journal of the Optical So- ciety of America A, Vol. 2, No. 11, 1985, pp. 558-565. [7] T. Tamir, “Nonspecular Phenomena in Beam Field
Re-flected by Multilayered Media,” Journal of the Optical Society of America A, Vol. 3, No. 4, 1986, pp. 586-594. [8] S. Z. Zhang and C. C. Fan, “Nonspecilar Phenomena on
Gaussian Beam Reflection at Dielectric Interface,” Jour-nal of the Optical Society of America A, Vol. 5, No. 9, 1988, pp. 1407-1411.
http://dx.doi.org/10.1364/JOSAA.5.001407
[9] F. Pampaloni and J. Enderlein, “Gaussian, Hermite- Gaussian, and Laguerre Gaussian Beam: A Primer,” 2004, 29p.