Munich Personal RePEc Archive
Empirical Analysis of Export Demand
Behavior of LDCs: Panel Cointegration
Approach
Shigeyuki, Hamori and Yoichi, Matsubayashi
Kobe University, Kobe University
14 September 2009
Empirical Analysis of Export Demand Behavior of LDCs: Panel Cointegration Approach*
Shigeyuki Hamori
Faculty of Economics, Kobe University [email protected]
and
Yoichi Matsubayashi
Faculty of Economics, Kobe University [email protected]. ac.jp
Abstract
In this paper, we use panel data to empirically analyze the stability of the export functions of LDCs for the period 1980-2004 using the nonstationary panel time series analysis. We find that the use of panel data for the region of the LDC clearly supports a cointegrating relationship. Our empirical results also show that price elasticity ranges between -0.24 and -0.34 and income elasticity ranges between 1.36 and 1.79 for the panel of LDCs.
JEL classification number: F41
Keywords: LDCs, export demand function, panel unit root, panel cointegration
1
1. Introduction
In the initial stages of the development of a country's economy, economic transactions with other countries are limited and macroeconomic development is highly dependent on the course of domestic demand, in the form of consumption and investment. However, as greater activity develops in international economic transactions and trade activities in particular, it is highly likely that the foreign demand is likely to become the main driver of economic growth.
To illustrate, beginning in the 1970s, NIEs (Newly Industrializing Economies) and ASEAN (Association of Southeast Asian Nations) members among East Asian countries enjoyed extremely high rates of economic growth as a result of so-called export-oriented growth strategies. Reliance on such strategies appeared to have been discouraged by the Asian currency crisis of 1997, but governments were again relying on policies based on them by the beginning of the new century. China has achieved high economic growth rates approximating 10% since 1990 largely because of growth in exports of industrial and high-tech products, and has, in a real sense, become "the world's factory."
Exports, therefore, play a significant role in economic growth. And it can be said that the achievement of sustainable economic growth depends on whether a country’s macroeconomic policy management can achieve stable exports. To test whether that is true, it is necessary to determine whether there is a long-term stable relationship between the primary factors affecting exports, and exports. Here, the key variables among the primary factors affecting exports are, specifically, relative export prices and economic conditions in trading partners.
It is not uncommon for such export functions to reflect stability even for Least Developed Countries (LDCs). Instability in the relationship between relative export prices and income levels in trading partners, on the one hand, and exports, on the other, exposes the limits of an export-oriented economic growth strategy. It is, therefore, meaningful to examine the stability of the export functions of LDC economies.
The quantitative analysis of stability in export functions has developed in the following two steps. In the first, a linear regression model, with real export as explained variables and relative export prices and trading partner income as explanatory variables, was estimated, and the stability of regression coefficients (export price elasticity and income elasticity) was examined. Much has been written in this area, but Stern et al (1976), Goldstein and Khan (1985) and Sawyer and Sprinkle (1999) are good examples of the principal survey papers.
2
Senhadji and Montenegro (1999) examined export function stability for 75 countries between the years 1960 and 1993, and reported relative export price elasticity of about -1.0 and income elasticity of 1.5. Arize (2001) examined the stability of export demand function in Singapore over the period 1973-1997, and reported that cointegrating relationship was found to exist when structural changes were taken into account. And Straub (2002), after examining the stability of export functions for the US, Canada, and Germany for the years 1975-2000, found that cointegrating relationships generally existed for each country.
The quantitative analysis of export function stability has advanced with each of the two steps mentioned above, and we would like to move it forward to its next step. In this paper, we analyze the stability of the export functions of LDCs by applying nonstationary panel data analysis.1 The common difficulty in obtaining sufficient sample sizes for developing countries is overcome by the use of the panel analysis approach and a combination of cross-sectional and time series data, which make it possible to perform a stable analysis. The nonstationary panel time series analysis was developed as a powerful alternative to individual nonstationary time-series analysis. The latter is thought to be of limited power when used for data with small sample size. We pool the data on LDCs, in an attempt to increase the power of unit root and cointegration tests by adding cross-sectional variation to the data.
2. Model and Data
Following the traditional approach, we treat the demand for exports as a function of world trade volume and relative prices, as follows:
(1) EXt =f RP WT( t, t), fRP <0, fWT >0
were EXt is real imports at time t , WTt is the world trade volume at time t , RPt
is the relative price (export price divided by the world price) at time t . The demand for export will decrease when the relative price rises (fRP < 0,) and increase when the world trade volume rises (fWT >0). For our empirical study, we specify the export demand
function, (1) as follows:
3
(2) ln(EXt)=β0 +β1ln(RPt)+β2ln(WTt)+ut, β1 <0, β2 >0
where ut is the stationary error term with zero mean and finite variance.
This paper analyzes the export demand function over the period from 1980 to 2004 (annual data) for 15 countries, selected on the basis of the availability of the data: the People's Republic of Bangladesh (Bangladesh), the Republic of Benin (Benin), Burkina Faso, the Republic of Burundi (Burundi), the Republic of Chad (Chad), the Union of Comoros (Comoros), the Democratic Republic of the Congo (Congo), the Republic of The Gambia (Gambia), the Republic of Guinea-Bissau (Guinea-Bissau), the Republic of Haiti (Haiti), the Republic of Malawi (Malawi), the Republic of Mali (Mali), the Republic of Mozambique (Mozambique), the Union of Myanmar (Myanmar), and the Republic of the Sudan (Sudan).
The data for real export, export prices, and world trade volume are obtained from the World Development Indicators (World Bank). Real exports are defined as exported goods and services in constant local currency units. The relative export price is obtained as the ratio of the export price to the world consumer price index. The world consumer price index is obtained from the International Financial Statistics (International Monetary Fund). Each piece of data is measured in logarithms.
For our empirical analysis, we use three sample periods:
Case 1: 1980-2004; Case 2: 1985-2004; Case 3: 1990-2004.
These three sample cases start in different years but end in the same year. We use these cases to examine whether our empirical results are robust to the chosen sample periods.
As preliminary analysis, we perform unit root tests for each variable. Four types of tests are used for ln(EXt) and ln(RPt): the Levin, Lin, and Chu t-test; the Im, Pesaran,
and Shin W-test; the ADF-Fisher Chi-square test; and the PP-Fisher Chi-square (Levin, Lin, and Chu, 2002; Im, Pesaran and Shin, 2003; Maddala and Wu, 1999). The
Dickey-fuller GLS test is used for ln(WTt).
2
The auxiliary regression of each test
includes a constant term. We find that the null hypothesis of a unit root is accepted for the level of each variable, whereas the null hypothesis of a unit root is rejected for the first difference of each variable. These results are common to case 1, case 2 and case 3. Thus, our empirical results for the unit root tests are found to be robust to the choice of
2 Note that ln( )
t
4
sample periods.
3. Empirical Results 3.1 Panel Cointegration Tests
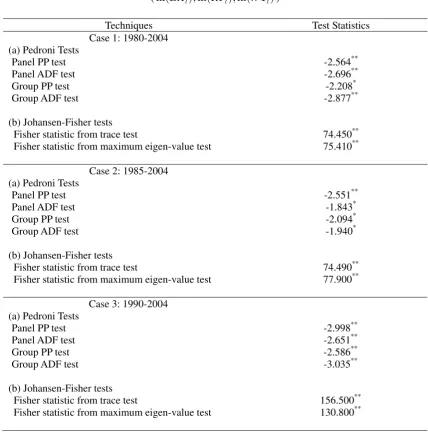
We perform panel cointegration tests for real exports, relative prices, and world trade volume. Two types of panel cointegration tests are conducted. The first is the residual-based panel cointegration test developed by Pedroni (1999, 2004). Pedroni proposed several tests for cointegration that allow for heterogeneous slope coefficients across cross-sections. Here we consider four tests: the Panel PP-test, Panel ADF test, Group PP test, and Group ADF-test. In the null hypothesis, the residuals are nonstationary (i.e., there is no cointegrating relationship). In the alternative hypothesis, the residuals are stationary (i.e., there is a cointegrating relationship). It is assumed that the residuals of the alternative hypothesis have common AR coefficients for the first two tests and individual AR coefficients for the second two tests.
The second panel cointegration test we apply is the Johansen-type panel cointegration test developed by Maddala and Wu (1999).3 As an alternative test for cointegration in panel data, Maddala and Wu used Fisher's result to propose a method for combining tests from individual cross-sections to obtain a test statistic for the full panel. Two kinds of Johansen-type tests have been developed: the Fisher test from the trace test and the Fisher test from the maximum eigen-value test. In the Johansen-type panel cointegration test, we set the lag order as one.
Table 1 shows the results of panel cointegration tests. Under the null hypothesis of no cointegration, the test statistic is -2.564 for Panel PP test, -2.696 for Panel ADF test, -2.208 for Group PP test, -2.877 for Group ADF test, 74.450 for Fisher statistic from trace test, and 75.410 for Fisher statistic from maximum eigen-value test for case 1. The null hypothesis is rejected at the 5% significance level in every test. Table 1 also indicates that similar results are obtained for case 2 and case 3. Thus, it can be said that exports, relative prices, and world trade volume have a cointegrating relation in all cases.
3.2 Panel Cointegration Estimation
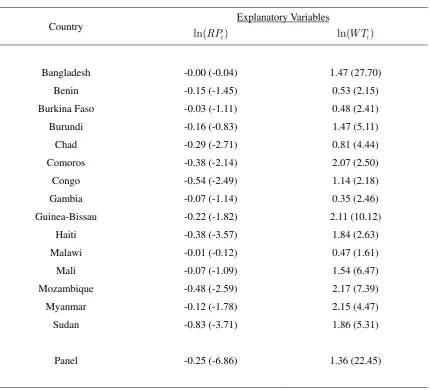
Having found that the existence of the cointegrating relationship is supported, we go on to estimate the export demand function using the fully modified OLS (FMOLS)
5
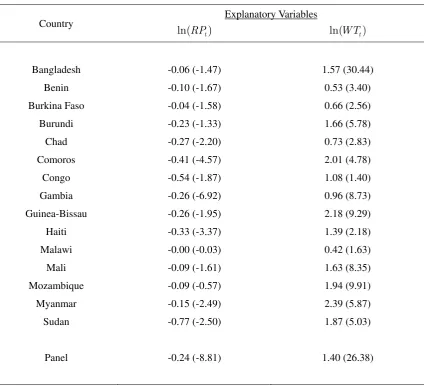
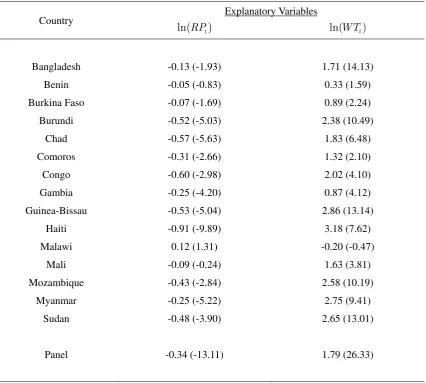
developed by Pedroni (2001). Table 2a shows the estimation results for case 1. As the table demonstrates, the sign condition of the export demand function holds. The relative price elasticity is significantly estimated at a negative value of -0.25 for the panel of LDCs, while the trade volume elasticity is significantly estimated at a positive value of 1.36 for the panel of LDCs for case 1. As seen in Tables 2b and 2c, these results are robust to the sample periods chosen. The relative price elasticity is significantly estimated at a negative value of -0.24 (case 2) and -0.34 (case 3) for the panel of LDCs, while the trade volume elasticity is significantly estimated at a positive value of 1.40 (case 2) and 1.79 (case 3) for the panel of LDCs.
On the basis of the above results, we find that the use of panel data for the region of the LDC clearly supports a cointegrating relationship, and thus we can conclude that the existence of the export demand function is statistically supported.
4. Some Concluding Remarks
In this paper, we used panel data to empirically analyze the stability of the export functions of LDCs for the period 1980-2004. This paper is distinguished by its application of nonstationary panel time series analysis of export demand functions. Bayoumi (1999) used standard panel data approach to estimate individual product export functions for 21 industrialized countries, and obtained relative export price elasticity of -0.31 and income elasticity of 1.84. Our empirical results are generally consistent with his results.
In general, reasonable relative export price elasticity and income elasticity values are obtained for LDCs, and it becomes evident that, even for LDCs with low export ratios, income and price factors governing export activity are important. It is hoped that this analysis will be seen as having provided valuable information in light of the near total absence of quantitative analyses of LDC export activity, as well as for purposes of mapping possible economic growth strategies for the LDCs examined.
References
Arize A.C. (2001) "Traditional Export Demand Relation and Parameter Instability: An Empirical Investigation"Journal of Economic Studies28, 378-398.
6
Goldstein, M. and M.S. Khan (1985) "Income and Price Effects in Foreign Trade" in R. W. Jones and P. B. Kenen, Eds., Handbook in International Economics, Vol.II, Amsterdam: North-Holland, Chapter 20.
Im, K.S., Pesaran, M. H. and Y. Shin (2003) "Testing for Unit Roots in Heterogeneous Panels"Journal of Econometrics115, 53 – 74.
Johansen, S. (1988) "Statistical Analysis of Cointegrating Vectors"Journal of Economic Dynamics and Control12, 213–54.
Johansen, S. and K. Juselius (1990) "Maximum Likelihood Estimation and Inference on Cointegration – with Application to the Demand for Money" Oxford Bulletin of Economics and Statistics52, 169–210.
Levin, A., Lin, C. F. and C.-S. J. Chu (2002) "Unit Root Tests in Panel Data: Asymptotic and Finite-Sample Properties"Journal of Econometrics108, 1–24.
Maddala, G. S. and S. Wu (1999) "A Comparative Study of Unit Root Tests with Panel Data and a New Simple Test" Oxford Bulletin of Economics and Statistics 61, 631–52.
Matsubayashi, Y. and S. Hamori (2009) "Empirical Analysis of Import Demand Behavior of Least Developed Countries" Economics Bulletin 29 (2), 1460-1475. Pedroni, P. (1999) "Critical Values for Cointegration Tests in Heterogeneous Panels with
Multiple Regressors"Oxford Bulletin of Economics and Statistics61, 653–70. Pedroni, P. (2001) "Purchasing Power Parity Tests in Cointegrated Panels" Review of
Economics and Statistics 83, 727-731.
Pedroni, P. (2004) "Panel Cointegration: Asymptotic and Finite Sample Properties of Pooled Time Series Tests with an Application to the PPP Hypothesis" Econometric Theory20, 597–625.
Sawyer, W. C. and R.L. Sprinkle (1999) "The Demand for Imports and Exports in the World Economy" Aldershot: Ashgate.
Senhadji, A.S. and C.E. Montenegro (1999) "Time Series Analysis of Export Demand Equations: A Cross-Country Analysis"IMF Staff Papers46, 259-273.
Stern, R. M., Francis, J. and B. Schumacher (1976) "Price Elasticities in International Trade" London: Macmillan.
7
Table 1 Panel Cointegration Tests
(ln(EXt), ln(RPt), ln(WTt))
Techniques Test Statistics
Case 1: 1980-2004 (a) Pedroni Tests
Panel PP test -2.564**
Panel ADF test -2.696**
Group PP test -2.208*
Group ADF test -2.877**
(b) Johansen-Fisher tests
Fisher statistic from trace test 74.450**
Fisher statistic from maximum eigen-value test 75.410**
Case 2: 1985-2004 (a) Pedroni Tests
Panel PP test -2.551**
Panel ADF test -1.843*
Group PP test -2.094*
Group ADF test -1.940*
(b) Johansen-Fisher tests
Fisher statistic from trace test 74.490**
Fisher statistic from maximum eigen-value test 77.900**
Case 3: 1990-2004 (a) Pedroni Tests
Panel PP test -2.998**
Panel ADF test -2.651**
Group PP test -2.586**
Group ADF test -3.035**
(b) Johansen-Fisher tests
Fisher statistic from trace test 156.500**
Fisher statistic from maximum eigen-value test 130.800**
Note:
*
shows that the null hypothesis is rejected at the 5% level.
**
8
Table 2a Panel FMOLS Results
Case 1: 1980-2004
Country Explanatory Variables
ln(RPt) ln(WTt)
Bangladesh -0.00 (-0.04) 1.47 (27.70)
Benin -0.15 (-1.45) 0.53 (2.15)
Burkina Faso -0.03 (-1.11) 0.48 (2.41)
Burundi -0.16 (-0.83) 1.47 (5.11)
Chad -0.29 (-2.71) 0.81 (4.44)
Comoros -0.38 (-2.14) 2.07 (2.50)
Congo -0.54 (-2.49) 1.14 (2.18)
Gambia -0.07 (-1.14) 0.35 (2.46)
Guinea-Bissau -0.22 (-1.82) 2.11 (10.12)
Haiti -0.38 (-3.57) 1.84 (2.63)
Malawi -0.01 (-0.12) 0.47 (1.61)
Mali -0.07 (-1.09) 1.54 (6.47)
Mozambique -0.48 (-2.59) 2.17 (7.39)
Myanmar -0.12 (-1.78) 2.15 (4.47)
Sudan -0.83 (-3.71) 1.86 (5.31)
Panel -0.25 (-6.86) 1.36 (22.45)
Note:
9
Table 2b Panel FMOLS Results
Case 2: 1985-2004
Country Explanatory Variables
ln(RPt) ln(WTt)
Bangladesh -0.06 (-1.47) 1.57 (30.44)
Benin -0.10 (-1.67) 0.53 (3.40)
Burkina Faso -0.04 (-1.58) 0.66 (2.56)
Burundi -0.23 (-1.33) 1.66 (5.78)
Chad -0.27 (-2.20) 0.73 (2.83)
Comoros -0.41 (-4.57) 2.01 (4.78)
Congo -0.54 (-1.87) 1.08 (1.40)
Gambia -0.26 (-6.92) 0.96 (8.73)
Guinea-Bissau -0.26 (-1.95) 2.18 (9.29)
Haiti -0.33 (-3.37) 1.39 (2.18)
Malawi -0.00 (-0.03) 0.42 (1.63)
Mali -0.09 (-1.61) 1.63 (8.35)
Mozambique -0.09 (-0.57) 1.94 (9.91)
Myanmar -0.15 (-2.49) 2.39 (5.87)
Sudan -0.77 (-2.50) 1.87 (5.03)
Panel -0.24 (-8.81) 1.40 (26.38)
Note:
10
Table 2c Panel FMOLS Result:
Case 3: 1990-2004
Country Explanatory Variables
ln(RPt) ln(WTt)
Bangladesh -0.13 (-1.93) 1.71 (14.13)
Benin -0.05 (-0.83) 0.33 (1.59)
Burkina Faso -0.07 (-1.69) 0.89 (2.24)
Burundi -0.52 (-5.03) 2.38 (10.49)
Chad -0.57 (-5.63) 1.83 (6.48)
Comoros -0.31 (-2.66) 1.32 (2.10)
Congo -0.60 (-2.98) 2.02 (4.10)
Gambia -0.25 (-4.20) 0.87 (4.12)
Guinea-Bissau -0.53 (-5.04) 2.86 (13.14)
Haiti -0.91 (-9.89) 3.18 (7.62)
Malawi 0.12 (1.31) -0.20 (-0.47)
Mali -0.09 (-0.24) 1.63 (3.81)
Mozambique -0.43 (-2.84) 2.58 (10.19)
Myanmar -0.25 (-5.22) 2.75 (9.41)
Sudan -0.48 (-3.90) 2.65 (13.01)
Panel -0.34 (-13.11) 1.79 (26.33)
Note: