Munich Personal RePEc Archive
Diminished Expectations, Double Dips,
and External Shocks: The Decade After
the Fall
Reinhart, Carmen and Reinhart, Vincent
University of Maryland, College Park, Department of Economics
September 2010
September 13, 2010
Diminished Expectations, Double Dips, and External Shocks: The Decade After the Fall
Carmen M. Reinhart
University of Maryland, CEPR and NBER
and
Vincent R. Reinhart
American Enterprise Institute
The process of contraction, like the process of expansion,is cumulative and
self-reinforcing. Once started, no matter how, there is a tendency for it to go on, even if the force by which it was provoked has in the meantime ceased to operate.
Gottfried Haberler, Prosperity and Depression, 1937
In our recent paper, (Reinhart and Reinhart, 2010) we examine the behavior of
real GDP (levels and growth rates), unemployment, inflation, bank credit, and real estate
prices in a twenty one-year window surrounding selected adverse global and
country-specific shocks or events. In this note, we summarize some of the main findings of that
paper, including that economic growth is notably slower in the decade following a
macroeconomic disruption. We extend those results to provide evidence of several
post-crisis “double dips” in the years following the post-crisis. A faltering of economic recovery is
not uncommon after a severe financial shock, although this can often be ascribed to
exogenous events.
The episodes we study include the 1929 stock market crash, the 1973 oil shock,
the 2007 U.S. subprime collapse, and fifteen severe post-World War II financial crises.
The focus was not on the immediate antecedents and aftermath of these events but on
longer horizons that compare decades rather than years.1
1. Methodology preamble
1
The statistical analysis, which is described in more detail in the paper, is based on
nonparametric comparisons of the data that are applied to the episodes listed in Table 1.
Simply put, we examine if key macroeconomic indicators seem to come from the same
distribution before and after a dislocating event. The exact time periods of the
before-and-after windows vary across our exercises, but we usually try to employ the longest
possible spans of comparison.
Table 1. Episodes and Coverage
3 global episodes 1929, 1973, 2006
15 country-specific severe financial crises
Advanced economies Spain 1977, Norway 1987, Finland 1991, Sweden 1991, Japan 1992
Asian crisis emerging markets Indonesia, Korea, Malaysia, Philippines, and Thailand, all 1997
Other emerging markets Chile 1981, Mexico 1994, Colombia 1998, Argentina 2001, and Turkey 2001
2. Growth, GDP levels, and unemployment
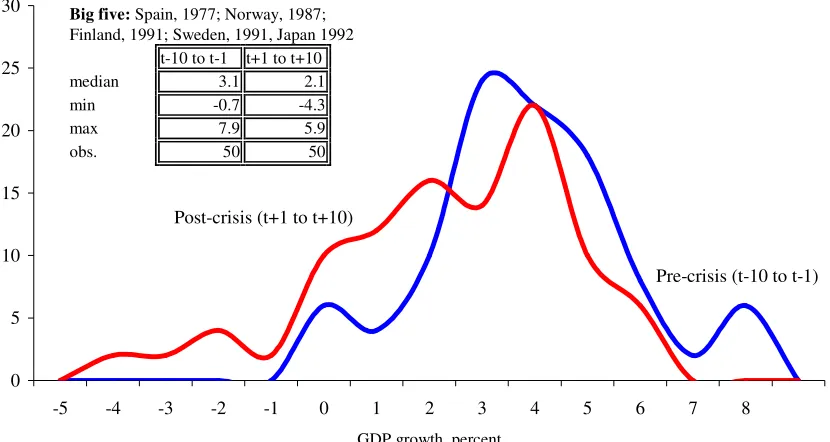
Real per capita GDP growth rates are significantly lower during the decade
following severe financial crises and the synchronous world-wide shocks. The median
post-financial crisis GDP growth decline in advanced economies, as shown in Figure 1,
is about 1 percent.
During the first three years following the 2007 U.S. subprime crisis (2008-2010),
median real per capita GDP income levels for allthe advanced economies is about 2
percent lower than it was in 2007; this is comparable to the median output declines in the
first three years after the fifteen severe post World War II financial crises. However, 82
percent of the observations for per capita GDP during 2008 to 2010 remain below or
60 percent, indicating that during the current crisis episode recessions have been deeper,
Figure 1. Real Per Capita GDP Growth in the Decade Before and the Decade After Severe Financial Crises: Post-WWII, Advanced Economies
Probability density function
Big five: Spain, 1977; Norway, 1987; Finland, 1991; Sweden, 1991, Japan 1992
t-10 to t-1 t+1 to t+10
median 3.1 2.1
min -0.7 -4.3
max 7.9 5.9
obs. 50 50
0 5 10 15 20 25 30
-5 -4 -3 -2 -1 0 1 2 3 4 5 6 7 8
GDP growth, percent
Pre-crisis (t-10 to t-1) Post-crisis (t+1 to t+10)
Sources: Reinhart and Reinhart (2010) and sources cited therein.
In the ten-year window following severe financial crises, unemployment rates are
significantly higher than in the decade that preceded the crisis. The rise in unemployment
is most marked for the five advanced economies, where the median unemployment rate is
about 5 percentage points higher (Figure 2). In ten of the fifteen post-crisis episodes,
unemployment has never fallen back to its pre-crisis level, not in the decade that
Figure 2. Unemployment Rate in the Decade Before and the Decade After Severe Financial Crises: Post-WWII, Advanced and Asian Economies
Probability density function, five advanced economies
Big five: Spain, 1977; Norway, 1987; Finland, 1991; Sweden, 1991, Japan 1992
t-10 to t-1 t+1 to t+10
median 2.7 7.9
min 1.1 2.5
max 6.1 21.2
obs. 50 50
0 5 10 15 20 25 30 35 40 45 50
1 3 4 6 7 9 10 12 13 15 16 18 19 21 22
Unemployment rate, percent Pre-crisis, (t-10 to t-1)
Post-crisis (t+1 to t+10)
Sources: Reinhart and Reinhart (2010) and sources cited therein.
3. Housing and credit
Real housing prices for the full period is available for ten of the fifteen financial
crisis episodes. For this group, over an eleven-year period (encompassing the crisis year
and the decade that followed), about 90 percent of the observations show real house
prices below their level the year before the crisis. Median housing prices are 15 to 20
percent lower in this eleven-year window, with cumulative declines as large as 55
percent. The observations on unemployment and house prices, of course, may be related,
as a protracted slump in construction activity that accompanies depressed housing prices
Figure 3. Real House Prices Before and Ten Years After Severe Financial Crises: Ten Post-WWII Episodes
Probability density function: Advanced economies
Big five: Spain, 1977; Norway, 1987; Finland, 1991; Sweden, 1991, Japan 1992 Index, t-1=100 t-1 to t+10
median 83.0
min (Finland, 1993) 58.9 max (Spain, 1987) 123.2
observations 60
0 2 4 6 8 10 12 14 16 18 20
55 60 65 70 75 80 85 90 95 100 105 110 115 120 125
Real house prices, t-1=100 House prices below pre-crisis level
House prices above pre-crisis level
Sources: Reinhart and Reinhart (2010) and sources cited therein.
Another important driver of the cycle is the leverage of the private sector. In the
decade prior to a crisis, domestic credit/GDP climbs about 38 percent and external
indebtedness soars. Credit/GDP declines by an amount comparable to the surge (38
percent) after the crisis. However, deleveraging is often delayed and is a lengthy process
lasting about seven years. The decade that preceded the onset of the 2007 crisis fits the
historic pattern. If deleveraging of private debt follows the tracks of previous crises as
4. Double dips and external shocks
The media is filled with concerns about a “double dip,” or that the economic
recovery will stall out after only a few quarters of growth. Our analysis is based on
annual data, so brief spurts of growth bracketed by output declines might be smoothed
away in yearly observations. But a more general pattern, often applied to Japan’s
experience in the late 1990s (which actually stretches the window to encompass the 5th
and 6th year after the crisis), is documented in Table 2. Of the 15 post World War II
episodes examined, nearly one half of these (seven episodes) involved a broadly-defined
double dip.
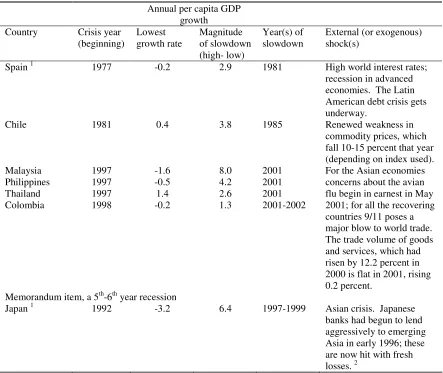
As shown in Table 2, growth rates often became negative once more after the
crisis. The magnitude of the slowdown (measured as the highest post-crisis growth rate
less the lowest recorded subsequently) also provides a sense of the loss of momentum.
These post-crisis downturns help explain why growth rates are significantly lower and
unemployment rates higher in the decade after the crisis and why there results are not
driven by weak economic performance that is common in the vicinity of the crisis.
Concluding observations
As Reinhart and Rogoff (2009) and our paper document for the public and
private sectors, respectively, the years following severe financial crises are characterized
by high levels of debt and leveraging. This observation is essential in understanding
why these financially frail economies are particularly vulnerable to adverse shocks,
whether they emanate from the demand and supply factors discussed in our paper. A
drag on spending might owe to mistakes in domestic policies or hysteresis effects of the
“bad luck,” originating in exogenous events or external developments that strike at a
[image:9.612.85.528.195.568.2]time when the economy remains highly vulnerable.
Table 2.Episodes of a marked slowdown or recession in 3rd or 4th year after the crisis
Annual per capita GDP growth Country Crisis year
(beginning) Lowest growth rate Magnitude of slowdown (high- low) Year(s) of slowdown
External (or exogenous) shock(s)
Spain 1 1977 -0.2 2.9 1981 High world interest rates;
recession in advanced economies. The Latin American debt crisis gets underway.
Chile 1981 0.4 3.8 1985 Renewed weakness in
commodity prices, which fall 10-15 percent that year (depending on index used).
Malaysia 1997 -1.6 8.0 2001
Philippines 1997 -0.5 4.2 2001
Thailand 1997 1.4 2.6 2001
Colombia 1998 -0.2 1.3 2001-2002
For the Asian economies concerns about the avian flu begin in earnest in May 2001; for all the recovering countries 9/11 poses a major blow to world trade. The trade volume of goods and services, which had risen by 12.2 percent in 2000 is flat in 2001, rising 0.2 percent.
Memorandum item, a 5th-6th year recession
Japan 1 1992 -3.2 6.4 1997-1999 Asian crisis. Japanese
banks had begun to lend aggressively to emerging Asia in early 1996; these are now hit with fresh losses. 2
1
It is important to note that, unlike the other 13 financial crises in our sample Spain 1977 and Japan 1992 “escaped” an initial recession at the time of crisis.
2
See Kaminsky and Reinhart (2000) for an analysis of the patterns of bank lending during the Asian crisis.
References
Kaminsky, Graciela L., and Carmen M. Reinhart, Bank Lending and Contagion:
Evidence From the Asian Crisis in Takatoshi Ito and Anne Krueger (eds.) Regional and
Global Capital Flows: Macroeconomic Causes and Consequences (Chicago: University
Reinhart, Carmen M. and Vincent R. Reinhart,After the Fall, NBER Working Paper
16334, September 2010, forthcoming in Federal Reserve Bank of Kansas City Economic
Policy Symposium Volume, Macroeconomic Challenges: The Decade Ahead at Jackson Hole, Wyoming, on August 26-28, 2010.