Journal Electrical and Electronic Engineering
2013;1(1): 35-40Published online May 20, 2013 (http://www.sciencepublishinggroup.com/j/jeee) doi: 10.11648/j.jeee.20130101.14
RFID radio channel performance analysis
Salvador Ricardo Meneses González, Roberto Linares y Miranda
Instituto Politécnico Nacional Escuela Superior de Ingeniería Mecánica y Eléctrica, Campus ZacatencoU.P.A.L.M. Col. Lindavista, C. P. 07738, México, D. F.México
Email address:
[email protected] (S. R. M. González), [email protected] (R. L. y Miranda)
To cite this article:
S. R.Meneses González. R. Linares y Miranda. RFID Radio Channel Performance Analysis. Journal Electrical and Electronic Engineer-ing. Vo. 1, No. 1, 2013, pp. 35-40. doi: 10.11648/j.jeee.20130101.14
Abstract:
RFID applied to vehicular identification operates under a complex electromagnetic environment; the radio waves emitted by the reader, propagate, attenuate and join to the reflected waves from the ground and adjacent vehicles, being received by the antenna tag; part of the electromagnetic wave signal is backscattered/reflected back to the reader. In order to obtain a propagation model is carried a deterministic and statistical radio channel analysis out, in such a way that the signal performance could be predictable in an outdoor environment. RFID radio channel multipath environment analysis is the focus of this work.Keywords:
Rayleigh, Rician, Radio Channel, Tag, RFID1. Introduction
Radio wave propagation can be defined as the energy transfer by the electromagnetic radiation in the radiofre-quency band. The radio wave propagates in several ways being dependent of the path geometry, the frequency and the electric properties of the propagation medium. In a radio mobile typical application, the base station has a fix position meanwhile the mobile station is moving; this is the case of the Radio Frequency Identification Technology, RFID applied to the vehicular identification, where the wireless communication link is provided between a remote transponder (antenna and integrated circuit), known as tag, containing the information into the memory block, strapped to the vehicle windshield, and an interrogator or reader used to identify with no physical contact or visual supervi-sion; the objective is to have all the motor vehicle informa-tion, for example, owner name, driver´s license, etc. RFID Technology works in the low, high, ultra high and super high band frequency. ISO 18006-C standard establishes the requirements of the physical and logical levels, where the reader starts the communication in the RFID system, operating in the 860-960 MHz frequency range [1].
Radio waves reach the tag antenna from different paths, each one with different amplitude, phase, and time delay, situation known as multipath propagation, being the asphalt surface, vehicles located at adjacent lines, and all the ob-jects around the covering area, regular and irregular
reflec-tive sources of reflected waves, which change continuously and randomly; a dynamic multipath situation, where a con-tinuous change in the electrical length of each path or ray, and the relative phase shifts between them, as a function of spatial position, complicating the signal envelope, causing a space selective fading as a result of the multipath propa-gation which is translated into a time selective fading expe-rienced by the mobile receiver on the received signal as phase shifts between the different paths, causing construc-tive contribution or destrucconstruc-tive contribution depending upon the relative phases. In this way a propagation channel analysis has become more important because it is useful for the simulation and analysis of digital transmission and for the quantification of the communication-link degradation within the channel.
This is the focus and motivation of this work, analyze the RFID radio channel, in order to establish a ray trace tracta-ble model to characterize radio propagation RFID channel, in accordance with the observed signal properties in field.
2. Radio Channel
36 S. R. Meneses Gonzálezet al.: RFID Radio Channel Performance Analysis
the received power is composed of a direct ray plus nu-merous rays due to reflections off objects, diffraction around objects, and transmission through objects, as shown in Figure 1, then, in order to predict power spectra, there is a direct path between the transmitter and the receiver, and reflected waves limited to a range of reflection angles. Therefore, RFID system under test is surrounded by the ground (asphalt) and walls (buses, vans, sport cars, etc., located at adjacent lanes), and it can be modeled as deter-ministic and/or stochastic model.
In this way, a model based on scattering is suita-ble,assuming that the incident electric field on the tag an-tenna is composed by a cluster of vertically or horizontally polarized travelling plane waves of random phase, with spatial angles of arrival and phase angles which are random and statistically independent. Then, let us analyze the situa-tion from the deterministic and stochastic point of view.
Figure 1. Multipath Environment.
2.1. Deterministic Model: Ray Tracing
As a result from the applied tests, the RFID feasibility to vehicular identification, depends of several variables, for example, the mismatch polarization between the tag anten-na and the reader antenanten-na due to frequent sceanten-nario’s geo-metry changes, it should be remembered that the vehicle’s windshield angle is not always the same, the speed of the mobile due to the vehicles don´t move with uniform speed at the reader’s antenna coverage area and incident reflected waves to the tag antenna coming from the reflecting surface and other objects. These parameters must be considered in an effort to meet a radio channel model.
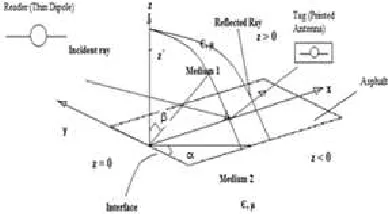
Figure 2. RFID Radio Channel Geometry.
In this way, let us consider an incident plane wave transmitted by the reader from region 0 (free space), where the plane of incidence is parallel to the plane xz, as shown in Figure 2. Expression (1) considers a multi ray situation [2] in accordance with the statement of the problem, in-volving the antenna polarization and the reflection coeffi-cient in uplink and downlink communication.
(
)
2(
1)
( )
(
)
21 1
1 1
exp exp
4
N
r t t r T i i
i i
P PGG PLF jkr jkr
r r
λ α
π =
= − + Γ −
∑
(1)
where:
r
P , received power Gt , transmitting antenna gain
λ
π
2 =
k , wave number
P
t , transmitted power λ, wavelength of radio frequency signalPLF, polarization loss factor
(
)
2 2 1 21 d h h
r = + − , direct ray length
(
)
2 2 1 22 d h h
r = + + , reflected ray length
(
)
(
1 2 2)
1
sin h + h r
= −
α , incidence angle on the reflecting surface
1 h and
2
h are the height of the reader antenna and height of the tag antenna respectively
d , separation between antennas , total reflection coefficient
The reflected wave is the incident wave in itself affected by the Fresnel Reflection Coefficient, which alters the amplitude, phase and delay; the electric field polarization is defined relative to the plane of incidence, which contains the normal to the reflecting surface and the incident propa-gation vector, that is, parallel polarized electric fields lie in the plane of incidence and perpendicular polarized fields are orthogonal, given respectively by:
Vertical Polarization [3, 4]:
( )
α
α
α
α
α
ε ε
ε ε
2 2
sin
cos
sin
cos
−
+
−
−
=
Γ
∏k
k
k
k
Horizontal Polarization [3, 4]:
And the complex permittivity is given by:
σλ
ε
ε
j
60
k
=
r−
whereε
r is the relative dielectric constant of the reflecting surface,σ
(Siemens/m)is the conductivity of the reflecting surface andλ
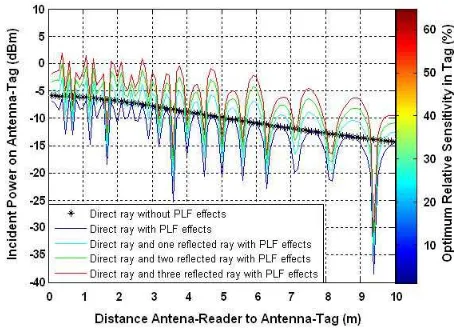
is the wave-length of the incident radio frequency signal.Graphic of Figure 3 shows the radio channel perfor-mance, the rays are constructively or destructively com-bined in different points of covering area. It is convenient
( )
T αi Γ( )
cos
sin
22cos
sin
k
k
ε
ε
α
α
α
α
α
⊥
−
−
Γ
=
Journal Electrical and Electronic Engineering 2013;1(1):35-40 37
to be mentioned that the ground surface is dry asphalt [5],
5
=
r
ε
.Figure 3.Vertical polarization, εr =5 (dry asphalt).
2.2. Statistical Model
Reader sends a continuous wave carrier; tag receives the carrier for power supply, given by (2) and backscatters by changing the reflection coefficients of antenna. In such a way, data is sent to reader from tag.
( )
= n − n n+n t C t x
E
α
β
λ
π
ω
2 ( cos coscos[ 0 0
(2)
]
)
sin
cos
sin
00 n n
z
n ny
α
β
+
β
+
φ
where:
( )
∑
( )
=
= N n
n t
E t E
1
, resultant field at the receiving point
(
x
0,
y
0,
z
0)
n
C
, nth incoming wave amplituden
α
, spatial angle of arrival,x-y plane, as shown in Fig. 2.n
β
, spatial angle of arrival, x-z plane, as shown in Fig. 2.n
φ
, nth incoming wave phaseMeanwhile the tag (the mobile) moves in the plane x-y with a velocity v in a direction making a certain angle re-spect to the x-axis in accordance with the car movement, the tag antenna is under far field, as it comes closer to the reader, it is under the near field influence. Far electric field is due to when the distance between source and observation is large, and the near field when the source and observation point is short.
As we know in the passive RFID System, the reader supplies tag with electromagnetic energy, in this way, the interrogation signal is detected by the tag demodulator, which can be expressed in terms of in-phase and quadrature components [7], given by:
( )
(
n n)
N
n
n
t
C
t
I
=
∑
ω
+
θ
=
cos
1 (3)
( )
∑
(
)
=
+ = N
n
n n
n t
C t Q
1
sin
ω
θ
On the other hand, a small Doppler Shift of the nth wave
component is given by:
(
n)
nn
v
ϕ
α
β
λ
π
ω
=
2
cos
−
cos
n n n
z
β
φ
λ
π
θ
=2 0sin +Quadrature components are Gaussian components cha-racterized by zero-mean, from that,
〈
E
( )
t
〉
=
0
in conse-quence the varianceσ
2ofI
( )
t
andQ
( )
t
is the same and equal to mean square value, that is, the mean power, in this way the probabilistic distribution function, pdf, is given by:( )
−
= 22
2 exp 2 1
σ π
σ
x x
pX
where:
( ) ( )
t I tx = Or x
( )
t =Q( )
tN
C
C
n2 02
=
〈
〉
=
σ
,C
0constantAnd the complex signal envelope
E
( )
t
is expressed by:( )
t I( )
t Q( )
t r = 2 + 2( )
( )
( )
= −
t I
t Q
t 1
tan
θ (4)
Figure 4 shows the tag demodulator in terms of In-phase
and Quadrature components.
Figure 4. In-phase and quadrature components.
38 S. R. Meneses González
2.2.1. Rayleigh Distribution
It is possible to presume the presence of a direct prop gation path. However, line of sight shadowing may occur when a tag to be read is in the nominal reader foot print and the tag is behind a tall vehicle that obstructs the direct path. In a practical scenario the tag to front vehicle distance is determined by the car hoot and the safety guard distance that tends to increase with vehicles’ speed reducing the likelihood of a mobile being in a shadowing region, as shown in Figure 5. In traffic jam conditions the vehicles separation will be less and the speed will also be reduced increasing the number of readings as the mobile stays longer in the interrogator footprint.
In this case, the subject is a scenery scattered enviro ment and each ray is independent and randomly phased, thus, the envelope of the signal will be Rayleigh Distrib tion, and the received signal envelope is described as Ra leigh Density Function [8] expressed as:
( )
−
= 2
2 2
2 exp
σ σ
r r
r pr
where:
2
σ
, mean power 22
r , signal power
And the statistical parameters of the envelope are: Mean Value:〈r〉=1.2533σ
Mean Square Value: 2 2 2σ =
〉 〈r Variance: 2 2 429 .
0 σ
σr =
It should be considered an additional effect, the phase fluctuations, however pdf follows a uniform distribution in the received signal as a result of the multipath propagation and due to RFID application works in the UHF Frequency Band, the wavelength is short and not disturbed in the phase by small changes in path length. Then
assume that the phase angles have a uniform density fun tion:
π θ〉=
〈 ; 〈σ2〉=4π2 3; σ
2.2.2. Rician Distribution
In this case there is a line of sight propagation path, as shown in Figure 6, the buses at side of the vehicle under test are the scattered environment part causing that nal reaches at the receiver by several different paths, but at least one of them is line of sight as shown in Figure 3.
Figure 5. Rayleigh Environment
S. R. Meneses Gonzálezet al.: RFID Radio Channel Performance Analysis
It is possible to presume the presence of a direct propa-gation path. However, line of sight shadowing may occur when a tag to be read is in the nominal reader foot print and is behind a tall vehicle that obstructs the direct path. In a practical scenario the tag to front vehicle distance is determined by the car hoot and the safety guard distance that tends to increase with vehicles’ speed reducing the eing in a shadowing region, as shown in Figure 5. In traffic jam conditions the vehicles separation will be less and the speed will also be reduced increasing the number of readings as the mobile stays
he subject is a scenery scattered environ-ment and each ray is independent and randomly phased, thus, the envelope of the signal will be Rayleigh Distribu-tion, and the received signal envelope is described as Ray-leigh Density Function [8] expressed as:
And the statistical parameters of the envelope are:
It should be considered an additional effect, the phase fluctuations, however pdf follows a uniform distribution in the received signal as a result of the multipath propagation to RFID application works in the UHF Frequency Band, the wavelength is short and not disturbed in the phase by small changes in path length. Then, it is possible assume that the phase angles have a uniform density
func-3 2 2 π
σθ =
In this case there is a line of sight propagation path, as shown in Figure 6, the buses at side of the vehicle under test are the scattered environment part causing that
thesig-the receiver by several different paths, but at least one of them is line of sight as shown in Figure 3.
Rayleigh Environment.
First part in the expression (1) represents the power in the line-of-sight,
C
022
, andreflected and scattered components, that is, a dominant component signal and Rician Fading signal, which can be represented in terms of in-phase and quadrature comp nents, as shown in Figure 7.
Figure 6. Rician Environmen
The mean value of the In-Phase and Quadrature comp
nents in Rician fading is non
strong wave [9], the line of sight ray, being the Rician fa
tor K defined as the ratio of dominant component power
over the (local-mean) scattered
lope power produced by the mean value of
given by, 2
0 2
σ
C
K= .
Figure 7. Dominant component and Rician Fading signal.
The number of the component waves vary as the tag moves, the envelope follows a non
cess, that would mean, a root mean square value
constant, that is,
σ
( )
t
, and the received signal tag antenna will be a Rician Distribution fluctuating quantity with a baseband spectrum approximately equal tothe mobile speed. Hence if the tag detection is successful when the speed of the vehicle is up to approximately 120 Km/H, thus the Rician Distribution baseband spectrum fluctuates up to 203 Hz.
2.3. Speed Factor
Let us remember that the Passive RFID tags answer to a reader query by transponding a modulated signal according RFID Radio Channel Performance Analysis
First part in the expression (1) represents the power in , and the second part represents the reflected and scattered components, that is, a dominant Rician Fading signal, which can be phase and quadrature
compo-Rician Environment.
Phase and Quadrature
compo-nents in Rician fading is non-zero due to a deterministic
strong wave [9], the line of sight ray, being the Rician
fac-tor K defined as the ratio of dominant component power
mean) scattered power, that is,
fadedenve-produced by the mean value of I
( )
t andQ( )
t ,Dominant component and Rician Fading signal.
The number of the component waves vary as the tag moves, the envelope follows a non-Stationary RicianPro-cess, that would mean, a root mean square value
σ
not, and the received signal tag antenna will be a Rician Distribution fluctuating quantity with a baseband spectrum approximately equal to
2
v
λ
, being, v, the mobile speed. Hence if the tag detection is successfulcle is up to approximately 120 Km/H, thus the Rician Distribution baseband spectrum
Journal Electrical and Electronic Engineering
to the information already stored in the memory of the tag, operating on the road, where vehicles are passively tagged on the windshield and read at high speeds while passing through a portal is subject to multiple random phenomena. Additionally, in the same way, a portal holding at mid Yagi at 5.4 m height with main beam tilted down
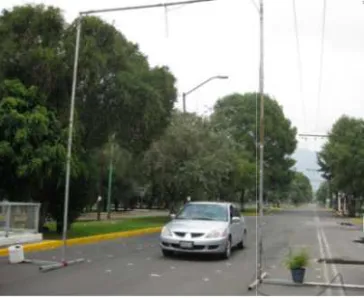
elevation angle is a common in some scenarios in order to ensure successful readings in the close proximity of the reader. A minimum tag-reader distance clearance of 4 m ters is considered and the reader enquiries several attempts while the mobile traverses the footprint, as shown in Figure 8.
Figure 8. Vehicle under test crosses through the portal.
In this way, the communication between the reader the tag must be established during the short interval time when the vehicle crosses (40 km/H to 140 km/H) through the portal where the reader is installed.
in Figure 9 show the results of the performance tag dete tion at different speeds 80 Km/H, 120 Km/H, and 140 Km/H. Four different vehicles and different tags were used for the speed test.
Table 1. Different vehicles under test.
Vehicle TagNumber
Jeep Liberty Tag No. 91
GM Van Tag No. 90
Stratus Chrysler Tag No. 26
Mustang Ford Tag No. 88
The communication establishment must be able to adjust to the interval time during the vehicle crosses through the portal, the speed of the vehicle is going from 40 Km/H to 120 Km/H, and keeps uniform, the vehicle takes the area detection (4 meters), from 0.36 seg. to 0.12 seg., respe tively, resulting clear that these time intervals are enough long to host several reader tag communication trials. ever the obtained results have been very positive to this application,the test results in road casts doubts on the tag detection performance, due of the number of successful readings is lower when the vehicle crosses the portal at high speed, as shown in Figure 9, this failed tag detection
Journal Electrical and Electronic Engineering 2013;1(1):35-40
information already stored in the memory of the tag, operating on the road, where vehicles are passively tagged on the windshield and read at high speeds while passing through a portal is subject to multiple random phenomena. a portal holding at mid-lane Yagi at 5.4 m height with main beam tilted down
75
. This elevation angle is a common in some scenarios in order to ensure successful readings in the close proximity of the ce clearance of 4 me-ters is considered and the reader enquiries several attempts while the mobile traverses the footprint, as shown in Figurethrough the portal.
In this way, the communication between the reader and the tag must be established during the short interval time when the vehicle crosses (40 km/H to 140 km/H) through Table 1 and graphic in Figure 9 show the results of the performance tag
detec-peeds 80 Km/H, 120 Km/H, and 140 Km/H. Four different vehicles and different tags were used
Different vehicles under test.
TagNumber
Tag No. 91
Tag No. 90
Tag No. 26
Tag No. 88
The communication establishment must be able to adjust to the interval time during the vehicle crosses through the the speed of the vehicle is going from 40 Km/H to 120 Km/H, and keeps uniform, the vehicle takes the area to 0.12 seg., respec-tively, resulting clear that these time intervals are enough long to host several reader tag communication trials.
How-the obtained results have been very positive to this he test results in road casts doubts on the tag detection performance, due of the number of successful readings is lower when the vehicle crosses the portal at high speed, as shown in Figure 9, this failed tag detection
performance at high speed represents
system applied to vehicular identification, due to if the vehicle has been stolen, probably it will be running at very high speed to avoid be detected.
possible to say that the origin of this fail situation
time interval during the vehicle crosses at high speed is not enough long to enable the communication between rea er-tag and tag-reader, causing that commands or responses contained in the data frame are not appropriately received. Increase the data rate in both directions gives a chance to prevent it.
3. Conclusion
In this work the RFID radio channel applied to the veh cular identification has been analyzed from a deterministic and stochastic point of view, which conducts oneself as Rayleigh and/or Rician probabilistic density function. I been found that the antenna polarizations, ray incidence angles, reflections off objects, car speed are the factors that have influence on the radio channel
work model the RFID radio channel applied to vehicular identification which constitute a contribution resulted of the work in field and laboratory.
Figure 9. Speed Test Results.
References
[1] 860MHz – 930MHz Class I Radio Frequency Identification Tag Radio Frequency & Logical
Specification Candidate Recommendation, version 1.0.1, Auto-Id Center.
[2] Anderson, H. A., “A Ray Tracing Propagation Model for Digital Broadcast Systems in Urban Areas”, IEEE Transa tion on Broadcasting vol. 39, no. 3, September 1993. [3] E. C. Jordan and K. G. Balmain, “Electromagnetic Waves
and Radiating Systems”, 1968, Prentice Hall. [4] Collin R., “Antennas and Radio Wave Propagation”,
McGraw Hill, 1985.
[5] Shang, J. Q. and Umana, J. A., “Dielectric constant and relaxation time of asphalt pav
structure Systems, Vol. 5, no. 4, p. 135
39
performance at high speed represents a weaknesses of the system applied to vehicular identification, due to if the vehicle has been stolen, probably it will be running at very high speed to avoid be detected. Based in this analysis it is that the origin of this fail situation is due to time interval during the vehicle crosses at high speed is not enough long to enable the communication between
read-reader, causing that commands or responses frame are not appropriately received. data rate in both directions gives a chance to
In this work the RFID radio channel applied to the vehi-cular identification has been analyzed from a deterministic and stochastic point of view, which conducts oneself as robabilistic density function. It has been found that the antenna polarizations, ray incidence angles, reflections off objects, car speed are the factors that have influence on the radio channel.The expressions in this o channel applied to vehicular constitute a contribution resulted of the
Speed Test Results.
930MHz Class I Radio Frequency Identification Tag Radio Frequency & Logical Communication Interface Specification Candidate Recommendation, version 1.0.1,
Anderson, H. A., “A Ray Tracing Propagation Model for Digital Broadcast Systems in Urban Areas”, IEEE Transac-tion on Broadcasting vol. 39, no. 3, September 1993. E. C. Jordan and K. G. Balmain, “Electromagnetic Waves and Radiating Systems”, 1968, Prentice Hall.
Collin R., “Antennas and Radio Wave Propagation”,
40 S. R. Meneses Gonzálezet al.: RFID Radio Channel Performance Analysis
[6] Clarke R. H., “A Statistical Theory of Mobile Radio Recep-tion”, Bell System Technical Journal, July-August 1968. [7] Parsons, J. D. “The Mobile Radio Propagation Channel”,
Second Edition John Wiley & Sons, England 2000.
[8] A. Papoulis and S. U. Pillai, Probability, Random Variables and StochasticProcesses, McGraw-Hill, New York, 2001.
[9] Rice S. O., “Mathematical Analysis of Random Noise”, Bell System Technical Journal, 1944.