________________________________
Author for Correspondence:
Ajitha A
Research Article
ISSN Print 2231 – 3648 Online 2231 – 3656
Available Online at: www.ijpir.com
Method development and validation of ticagrelor in bulk and dosage form
Ajitha A*
1, Varsha P
*2, Sirisha
*2 *1Dept of Pharmaceutical Analysis and Quality Assurance, CMR College of Pharmacy, Medchal, Hyderabad, India-501401.
*2
Dept of Pharmaceutical Analysis and Quality Assurance, CMR College of Pharmacy, Medchal, Hyderabad, India-501401.
ABSTRACT
A simple, precise, rapid, specific and accurate reverse phase high performance liquid chromatography method was developed for estimation of Ticagrelor in pharmaceutical dosage form. The method was developed in reverse phase high Performance liquid chromatography using INERTSIL (Length 250mm x Dimension 4.6mm, Particle Size 5m) column with mobile phase comprising of mixture of Methanol: Phosphate buffer (pH 2.5 adjusted with ortho phosphoric acid) in ratio of 80:20 v/v, at flow rate of 1ml/min, with detection of 240 nm. The retention time of Ticagrelor was found to be 4.8. Linearity of Ticagrelor was found in the range of 75-150 µg/mL with correlation coefficient for Ticagrelor was 0.999. The LOD and LOQ values for Ticagrelor were 1.07 and 3.02 µg/mL respectively. The method so developed was validated in compliance with the regulatory guidelines by using well developed analytical method validation parameters like linearity, accuracy, precision, limit of detection and limit of quantitation, robustness and ruggedness are in acceptable criteria.
Keywords: Ticagrelor, RP-HPLC, Method Development and Validation
INTRODUCTION
High Performance Liquid Chromatography is the most widely used of all the analytical separation techniques. The reasons for its popularity are its sensitivity, ready adaptability to quantitative determination, suitable for non- volatile and thermally fragile species.
Ticagrelor
Ticagrelor (1S,2S,3R,5S)-3-(7-{[(1R,2S)-2-(3,4difluorophenyl)cyclopropyl] amino} -5
(propylsulfanyl)-3H-[1,2,3]triazolo[4,5-d]pyrimidin-3-yl)-5-(2-hydroxyethoxy)cyclopentane-1,2-diol is a platelet aggregation inhibitor produced by AstraZeneca. Unlike clopidogrel, ticagrelor is not a prodrug. These are polycyclic aromatic compounds
containing triazole ring fused to a pyrimidine ring. Triazole is a five-membered ring consisting of two carbon atoms and three nitrogen atoms. Pyrimidine is
a 6-membered ring consisting of four carbon atoms and two nitrogen centers at the 1- and 3- ring positions.
Figure-1 Chemical Structure of Ticagrelor
CAS Number 274693-27-5 Molecular weight 522.568 Molecular formula C23H28F2N6O4S Physical state Solid
Solubility Soluble in Acetonitril, Methanol, Ethanol Melting point 138-140°C
MATERIALS AND METHODS
Ticagrelor tablet dosage form, Ortho phosphoric acid, Potassium di hydrogen orthophosphate, Acetonitrile, Methanol, Distilled water. All the above chemicals and solvents are from Merck and Rankem.
Instruments
UV-Visible Spectrophotometer- Nicolet evolution 100 model YJ-5200 DT, HPLC- Shimadzu LC 20 AT VP, HPLC Column- INERTSILcolumn,C18(150x4.6 ID) 5µm C18 Ultra sonicator- Citizen, Digital Ultrasonic Cleaner YJ-5200 DT, pH meter- Global digital Digital pH meter, Electronic balance- Shimadzu Hpd-500.
Diluents
Based up on the solubility of the compound, diluents was selected, Phosphate Buffer (pH -2.5): Acetonitrile (20: 80).
Chromatographic Conditions
Mobile phase used are Phosphate Buffer (pH -2.5): Acetonitrile (20: 80). flow rate 1ml/min, column used are INERTSIL, C18(150x4.6 ID) 5µm, Detector wave length was 240nm, column temperature Ambient, Injection volume was 20µl, Run time 6min, Diluent used was Phosphate Buffer (pH -2.5) : Acetonitrile (20 : 80)
Assay
Procedure
20 µL of the standard and sample solutions were injected into the chromatographic system and area for the Ticagrelor peak was measured.
Calculation
The amount of Ticagrelor present in the formulation by using the formula given below Assay %
AT WS DT P Avg. Wt
--- x ---x --- x ---x--- X 100 AS DS WT 100 LC
Where:
AT = Average area counts of sample preparation. AS = Average area counts of standard preparation.
WS = Weight of working standard taken in mg. P = Percentage purity of working standard LC = LABEL CLAIM mg/ml.
RESULTS AND DISCUSSION
Optimized method
Figure 2- Optimized chromatogram of Ticagrelor
ASSAY
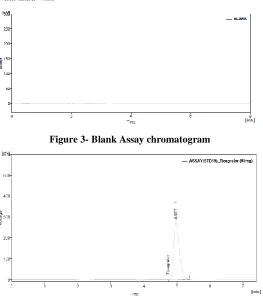
Figure 3- Blank Assay chromatogram
Figure 5- Sample chromatogram
Assay Results: (Ticagrelor)
3281.31 10 100 9 5 . 9 6 305.6
--- x ---x --- x ---x --- x 100 = 98.40 %. 3247.516 100 33.95 100 90
Table 1:
Formulation Label Claim (mg) % of Assay
BRILLINTA90mg Ticagrelor90mg 98.40
System Suitability Parameters
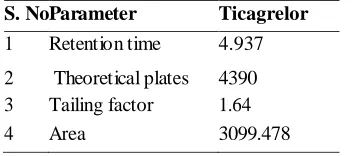
Table 2: System suitability studies ticagrelor
S. No Parameter Ticagrelor
1 Retention time 4.937 2 Theoretical plates 4390 3 Tailing factor 1.64
4 Area 3099.478
Linearity
Table 3: Calibration data of ticagrelor Linearity level Concentration (ppm)
1 50
2 75
3 100
4 125
Figure 6- Calibration curve of ticagrelor
Accuracy
Three concentrations 75%, 100%, 125%, were injected and amount Recovered and % Recovery were of following.
Table 4: Table for Accuracy
S. No. % spike level Area Amount recovered (mg) % Recovery % Mean recovery
1. 75 3404.393 66.3 98.22
98.2
2. 3069.834 66.2 98.07
3. 3296.104 66.5 98.5
1. 100 3838.430 89.6 99.6
98.84
2. 3285.170 88.4 98.22
3. 3327.673 88.9 98.7
1. 125 4838.317 111.3 98.9
98.36
2. 4781.051 110.53 98.2
3. 4663.219 110.2 98.0
Precision
Precision was performed and % RSD for Ticagrelor were found to be 0.205%
Table 5: Table for Precision Injection Ticagrelor Area %Recovery
Injection 1 3303.21 98.70 Injection 2 3304.2 98.76 Injection 3 3299.52 98.32 Injection 4 3309.3 98.84
y = 12.118x + 42.6 R² = 0.9988
0 1000 2000 3000 4000 5000 6000 7000
Injection 5 3301.9 98.51 Injection 6 3306.8 98.81
Mean 3304.11 98.65
Standard Deviation
3.56 0.202
% RSD 0.10 0.205
LOD: Limit of detection was calculated by standard deviation method for ticagrelor and LOD for ticagrelor were found to be 1.07μg/ml.
LOD = 3.3 * S.D slope
Table 6: Table for LOD
Drug Amount (µg/mL)
Ticagrelor 1.07
LOQ: Limit of Quantification was calculated by standard deviation method for ticagrelor and LOQ for ticagrelor were found to be 3.2μg/ml
LOQ = 10 * S.D Slope
Table 7: Table for LOQ
Drug Amount (µg/mL)
Ticagrelor 3.2
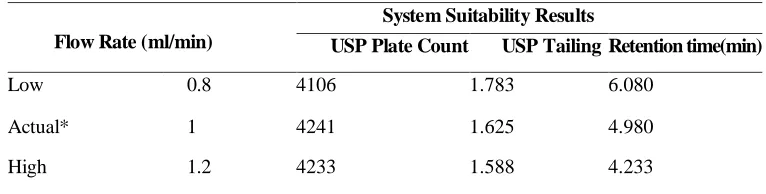
Robustness: Small deliberate changes in method like Flow rate and wavelength are made but there were no recognized change in the result. Hence it
indicates that the method is robust even by change in the flow rate±10 %and also wavelength.
Table 8: Flow Rate of Ticagrelor
Flow Rate (ml/min)
System Suitability Results
USP Plate Count USP Tailing Retention time(min)
Low 0.8 4106 1.783 6.080
Actual* 1 4241 1.625 4.980
High 1.2 4233 1.588 4.233
Table 9: Wavelength (nm) variations of Ticagrelor
System suitability parameters Wavelength (nm) Variation
CONCLUSION
The proposed HPLC method was found to be precise, specific, accurate, rapid and economical for estimation of Ticagrelor in tablet dosage form. The sample recoveries in all formulations were in good agreement with their respective Label Claims and this method can be used for routine analysis. It can be applied for routine analysis in laboratories and is suitable for the quality control of the raw
materials, formulations, dissolution studies and can be employed for bioequivalence studies for the same formulation.
Acknowledgement
The authors are thankful to Reference standards of drug samples and equipments were procured from CMR College of Pharmacy, Hyderabad, Telangana, India.
REFERENCES
[1]. Rajesh, K. P. Overview of Pharmaceutical Validation and Process Controls in Drug Development. Der Pharmacia Sinica. 1, 2010, 11 - 19.
[2]. Jay, B.; Kevin, J.; Pierre, B. Understanding and Implementing Efficient Analytical Methods Development and Validation. Pharmaceutical Technology Analytical Chemistry & Testing. 5, 2003, 6 - 13.
[3]. Ludwig, H. Validation of Analytical Methods. Agilent technologies. 2007, 1- 65.
[4]. Sandouk P, Bouvierd'Yvoire M, Chretien P, Tillement JP, Scherrmann JM. "Single-dose Apixaban in healthy volunteers".Biopharmaceutics& Drug Disposition 15(1), 1994.
[5]. Determination of ticagrelor and two metabolites in plasma samples by liquid chromatography and mass spectrometryHenrik Silléna, , , Melani cookb, Patty Davisc (Journal of Chromatography B) 878(25), 2010, 2299–2306.
[6]. L. Kalyani, A. Lakshmana Rao a validated stability-indicating HPLC method for determination of ticagrelor in bulk and its formulation (International Journal of Pharmacy) 3(3), 2013, 634-642
[7]. Ambasana, Mrunal A.; Kapuriya, Naval P.; Faldu, Nilkanth J.; Ladva, Kartik D. Development and validation of a UV spectrophotometric method for the determination of ticagrelor in bulk form (Academic Journal) 6(4), 2014, 237
[8]. Prashant Kaleab*, Yadavendra Agrawala, Gunjan Sonib, Pravin Patelb Simultaneous quantification of ticagrelor and its metabolite deshydroxyethoxy ticagrelor in human plasma by ultra-performance liquid chromatography electrospray ionization-tandem mass spectrometry( World Journal of Pharmaceutical Science) 3(1), 2015, 37-45
[9]. Caren Gobetti, Rubia Lazzaretti Pereira, Andreas Sebastian Loureiro Mendez and Cássia .Virginia Garcia Determination of the New Antiplatelet Agent Ticagrelor in Tablets by Stability-Indicating HPLC Method,Current Pharmaceutical Analysis. 12(4), 2016.