RESEARCH
Genomics insights into different
cellobiose hydrolysis activities in two
Trichoderma hamatum
strains
Peng Cheng
1,3*, Bo Liu
2†, Yi Su
1†, Yao Hu
2, Yahui Hong
1, Xinxin Yi
2, Lei Chen
1, Shengying Su
1, Jeffrey S. C. Chu
4*,
Nansheng Chen
2,5*and Xingyao Xiong
1Abstract
Background: Efficient biomass bioconversion is a promising solution to alternative energy resources and envi-ronmental issues associated with lignocellulosic wastes. The Trichoderma species of cellulolytic fungi have strong cellulose-degrading capability, and their cellulase systems have been extensively studied. Currently, a major limitation of Trichoderma strains is their low production of β-glucosidases.
Results: We isolated two Trichoderma hamatum strains YYH13 and YYH16 with drastically different cellulose degrad-ing efficiencies. YYH13 has higher cellobiose-hydrolyzdegrad-ing efficiency. To understand mechanisms underlydegrad-ing such differences, we sequenced the genomes of YYH13 and YYH16, which are essentially identical (38.93 and 38.92 Mb, respectively) and are similar to that of the T. hamatum strain GD12. Using GeneMark-ES, we annotated 11,316 and 11,755 protein-coding genes in YYH13 and YYH16, respectively. Comparative analysis identified 13 functionally important genes in YYH13 under positive selection. Through examining orthologous relationships, we identified 172,655, and 320 genome-specific genes in YYH13, YYH16, and GD12, respectively. We found 15 protease families that show differences between YYH13 and YYH16. Enzymatic tests showed that exoglucanase, endoglucanase, and β-glucosidase activities were higher in YYH13 than YYH16. Additionally, YYH13 contains 10 families of carbohydrate-active enzymes, including GH1, GH3, GH18, GH35, and GH55 families of chitinases, glucosidases, galactosidases, and glucanases, which are subject to stronger positive selection pressure. Furthermore, we found that the β-glucosidase gene (YYH1311079) and pGEX-KG/YYH1311079 bacterial expression vector may provide valuable insight for designing β-glucosidase with higher cellobiose-hydrolyzing efficiencies.
Conclusions: This study suggests that the YYH13 strain of T. hamatum has the potential to serve as a model organ-ism for producing cellulase because of its strong ability to efficiently degrade cellulosic biomass. The genome sequences of YYH13 and YYH16 represents a valuable resource for studying efficient production of biofuels.
Keywords: Trichoderma hamatum, Comparative genomics, Genetic diversity, β-Glucosidase, Cellobiose
© The Author(s) 2017. This article is distributed under the terms of the Creative Commons Attribution 4.0 International License (http://creativecommons.org/licenses/by/4.0/), which permits unrestricted use, distribution, and reproduction in any medium, provided you give appropriate credit to the original author(s) and the source, provide a link to the Creative Commons license, and indicate if changes were made. The Creative Commons Public Domain Dedication waiver (http://creativecommons.org/ publicdomain/zero/1.0/) applies to the data made available in this article, unless otherwise stated.
Open Access
*Correspondence: [email protected]; [email protected]; chenn@ sfu.ca
†Bo Liu and Yi Su contributed equally to this work
1 Hunan Provincial Key Laboratory of Phytohormones and Growth
Development, Hunan Provincial Key Laboratory for Crop Germplasm Innovation and Utilization, Hunan Agricultural University,
Changsha 410128, China
2 College of Life Science and Technology, Huazhong Agricultural
University, Wuhan 430070, China
4 Wuhan Frasergen Bioinformatics Co. Ltd, 666 Gaoxin Road, East Lake
High-tech Zone, Wuahn 430075, China
Background
The growing worldwide demand for energy and the desire to reduce dependency on fossil fuels have trig-gered increased interest in identifying alternative energy resources, especially liquid biofuels, such as bioethanol and biodiesel. Because renewable lignocellulosic bio-mass is generally considered to be cheaper resource, no competition with agricultural production and cleaner raw material for ethanol production comparing with oil-based fuels [1], efforts in generating liquid biofuels from renewable lignocellulosic biomass have been made.
Biodegradation of lignocellulosic residues is a process that is primarily performed by microorganisms that can enzymatically digest polymeric sugars to capture soluble monosaccharides and disaccharides as carbon sources for energy production. This ability is exploited by biotechno-logical industries to obtain large quantities of active, sta-ble, and specific enzymes using agricultural waste solids as raw materials [2]. In 2015, the global market for indus-trial enzymes is expected to reach more than 4 billion dollars [3]. The industrial enzymes market prefers micro-bial enzymes because they are more stable than enzymes from plants and animals. Fungi are particularly preferred for enzyme production because they are secreted as enzyme complexes that function in a synergistic manner, and their production is a relatively easy and inexpensive [4].
Currently, most kinds of commercial cellulase (includ-ing β-glucosidase) are derived from fungi, e.g. Tricho-derma, Aspergillus, Phanerochaete, Schizophyllum and Penicillium [5]. Aspergillus niger is used to produce many pectinases [6, 7] and hemicellulases [8] in industry. Trichoderma reesei QM6a was found to be a good pro-ducer of cellulose [9]. Due to their efficiency in producing and secreting a broad range of cellulases and hemicellu-lases, both of these fungi have been the focus of exten-sive studies on glycoside hydrolase (GH) discovery, and there is a marked effort to understand the regulation of the expression of genes that encoding them.
Species in Trichoderma spp. is a widely distributed saprophytic ascomycete and is well known for their biocontrol ability and lignocellulose degradation abili-ties. Recent genome sequencing projects have targeted eight species [10]: T. reesei, Trichoderma virens, Tricho-derma atroviride, Trichoderma harzianum, Trichoderma longibrachiatum, Trichoderma asperellum, Tricho-derma hamatum, and Trichoderma citrinoviride. It was observed that the tropical species T. reesei enhances the induction of its entire cellulolytic and hemicellulolytic arsenal when facing temperate R. solani, which is a very unlikely prey/host for this species in nature, whereas such a response is not observed for T. atroviride or T.
virens. The presence of a basidiomycete fungus may thus signal the availability of predigested plant biomass to T. reesei, consistent with the hypothesis that this species became a saprotroph by following basidiomycetes into their habitat [11].
A striking weakness of the Trichoderma system is that many Trichoderma strains isolated from the wild lack necessary lignocellulolytic enzymes for efficient bio-conversion processes [12], especially β-glucosidases, which are considered key rate- limiting enzymes in the process of cellulose degradation [13]. For exam-ple, under cellulase-inducing conditions, the produc-tion of secreted β-glucosidase comprises only about 1% of the total T. reesei cellulase [14], indicating that the hydrolysis of cellobiose constitutes a rate-limiting step during the enzymatic processing of cellulose [15, 16]. Although commercial cellulase is available, many of the most well-known biomass- degrading fungi display low β-glucosidase (cellobiose) activity, thus the initial bio-conversion of biomass to sugars remains a key bottleneck in the process of biofuel production. Thus, searching for Trichoderma strains with strong β-glucosidase activities is primary importance.
β-Glucosidases (EC 3.2.1.21) are found in all domains of living organisms, where they play essential roles in the removal of nonreducing terminal glucosyl residues from saccharides and glycosides. β-Glucosidases function in glycolipid and exogenous glycoside metabolism in ani-mals, defense, cell wall lignification, cell wall β-glucan turnover, phytohormone activation, and release of aro-matic compounds in plants, and biomass conversion in microorganisms. We identified T. hamatum strains from cultivated soil in HeJiaqiao, LiLing, Hunan prov-ince, China, among which YYH13 exhibited much higher antimicrobial activity against the bacterial wilt pathogen because of its higher expression of specific β-glucanase and chitinases, which play important roles as hydrolytic enzymes during cell wall degradation [17].
Results and discussion
YYH13 and YYH16 are two strains of T. hamatum
with different cellulose degradation activity
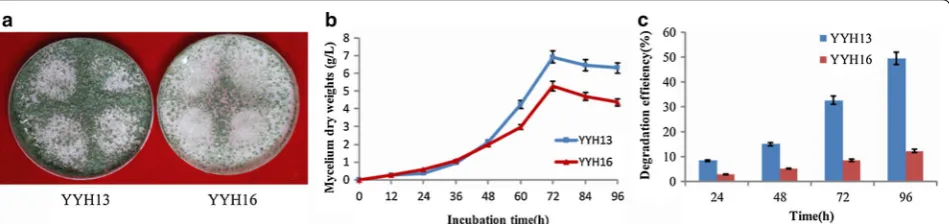
Trichoderma hamatum have unique mycelium, spore, and colonial morphology [18]. By colonial morphology analysis (Fig. 1a), we found YYH13 and YYH16 strains had moderate colony growth with white and dense colo-nies. The mycelium was white and the spore heads were green. YYH13 and YYH16 strains isolated in this study showed typical T. hamatum phenotype. However, these two strains had different mycelial growth when they started at the same spore densities (106 spores/mL), with YYH13 and YYH16 spore density generate difference after 48 h (Fig. 1b).
Many alternative mechanisms can cause microor-ganism growth inhibition, including mycoparasitism, bacteriolysis, nutrient, and space competition [19]. Trichoderma produces many hydrolases that degrade the cell wall, including chitinases, cellulases, xylanase, glu-canase and proteases. These enzymes are usually extra-cellular, of low molecular weight and highly stable. They may be produced in multiple forms or isozymes that differ in size, regulation, and ability. This trait has often been utilized as a means of in vitro screening for bio-control candidates. Various cell wall degrading enzymes play a very important role in the process of hyperpara-sitism. Some Trichoderma species have strong cellulose-degrading properties because they can secrete an enzyme system capable of degrading crystalline cellulose [20]. For example, T. reesei QM6a strain possesses a remarkable set of genes encoding hydrolytic enzymes.
We performed cellulose degradation test using filter paper as the substrate. As shown in Fig. 1e, filter paper degradation efficiency of YYH13 at 96 h was 37.14% higher than that of YYH16 at the same time point (P < 0.05), YYH13 also showed much stronger capabil-ity for the degradation of cellulose (Fig. 1e). The filter paper degradation analysis indicated that the action of
its enzymes is very potential in insoluble cellulosic sub-strates, due to the crystalline structure of filter paper, degradation of the filter paper would imply multiple cellulose activities, including exoglucanase activities because these enzymes work in crystalline regions. In conclusion, we observed that both YYH13 and YYH16 had rapid growth rates with the similar colonal morphol-ogies, and similar growth curves. Despite of these simi-larities, these two T. hamatum strains show significant differences in cellulose degradation activities.
Genome sequencing and assembly of YYH13 and YYH16
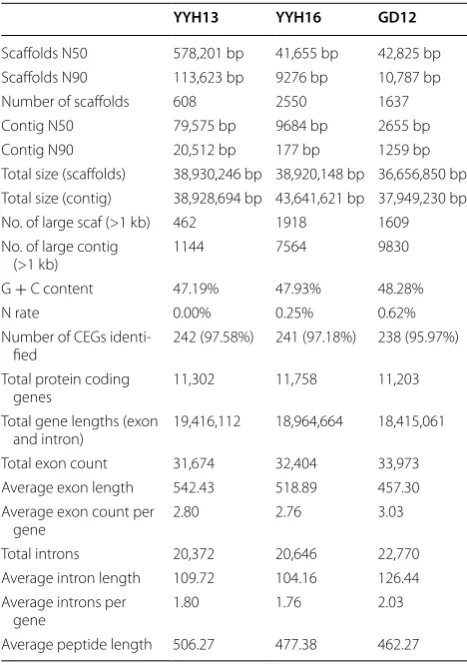
To identify the genetic causes of the observed pheno-typic differences, we sequenced the genomes of these two T. hamatum strains used Illumina Hiseq sequencing platform (Table 1). According to the sizes of assembled genomes of various Trichoderma species (Table 2), our sequencing data achieved approximately 292× and 95×, respectively. A 17-mer genomic survey using approxi-mately 70× of data showed that YYH13 had a sharp peak at approximately 60×, indicating low levels of heterozy-gosity and low levels of repetitive content. Although YYH16 showed a similar low level of heterozygosity, its distribution had a longer tail at higher depths, suggest-ing more repetitive content (Fig. 2). The K-mer analysis estimated 15% more repetitive sequences than YYH13 (Table 3). We carried out de novo genome assembly to obtain draft genome assemblies using SOAPdenovo. We obtained 608 and 2550 scaffolds with N50 of 578.2 and 41.6 Kb in YYH13 and YYH16, respectively. The final genome assembly sizes for the two genomes were 38.93 and 38.92 Mb (Table 2), respectively, which fell within the known range for the genomes of Trichoderma species [21–24].
To confirm that YYH13 and YYH16 are species of T. hamatum, we identified the rDNA gene cluster and extracted the sequences for ITS1 and ITS2. Construct-ing a phylogenetic tree usConstruct-ing these ITS sequences with
the 92 rDNA Trichoderma sequences previously identi-fied [25, 26] showed that YYH13 and YYH16 cluster with known T. hamatum, species (Fig. 3a). Similarly, according to three protein coding genes, Tef-1, Cal-1, and Chi18-5, the T. hamatum, species cluster together (Fig. 3b). This analysis further confirmed that YYH13 and YYH16 are strains of the T. hamatum species.
Genome annotations of YYH13 and YYH16
To evaluate the completeness of the assembled genomes, we performed a CEGMA (Parra et al. [26]) showed that both YYH13 and YYH16 identified more than 97% of all of the CEGs (complete and partial) (Table 2), higher than that for the published T. hamatum GD12, which only identified 95.97%. Thus, our genome assemblies of the two T. hamatum strains YYH13 and YYH16 are of good quality. We annotated the genomes for protein coding genes using GeneMark-ES and identified 11,316 and 11,755 genes in YYH13 and YYH16, respectively. The previous T. hamatum genome (GD12) was anno-tated using FgeneSH [21]. To assess the comparability of the two methods, we also annotated the GD12 assem-bly using GeneMark-ES and compared the annotation results. FgeneSH predicted 10,760 genes, and Gene-Mark-ES predicted 11,031 genes, for which 10,169 (94% of FgeneSH annotation) genes corresponded to identical annotation structures, and 46 genes were found only by FgeneSH. Thus, we conclude that the FgeneSH gene pre-diction was comparable to the GeneMark-ES prepre-dictions. For consistency, we used the GeneMark-ES annotations Table 1 Sequencing data size and output quality in YYH13 and YYH16
Type YYH13 Raw data YYH13 Clean data YYH16 Raw data YYH16 Clean data
Number of reads 62,431,080 58,834,452 20,861,707 19,051,316
Data size 12,486,216,000 11,766,890,400 (94.24%) 4,172,341,400 3,810,263,200 (91.32%)
N of fq1 0.00% 0.00% 0.02% 0.01%
N of fq2 0.01% 0.00% 0.06% 0.00%
Low qual base of fq1: (≤5) 2.73% 0.90% 4.13% 1.61%
Low qual base of fq2: (≤5) 5.07% 1.46% 6.79% 1.88%
Q20 of fq1 95.93% 98.03% 93.11% 96.21%
Q20 of fq2 92.60% 96.63% 90.70% 95.80%
Q30 of fq1 91.76% 94.25% 85.60% 89.43%
Q30 of fq2 87.71% 91.87% 83.15% 88.23%
GC of fq1 45.24% 45.04% 45.14% 44.86%
GC of fq2 45.10% 44.92% 45.04% 44.76%
Error of fq1 0.03% 0.03% 0.05% 0.04%
Error of fq2 0.04% 0.03% 0.06% 0.04%
Discarded reads related to N and low qual 5.76% 8.68%
Table 2 Genome assembly and annotation statistics of YYH13, YYH16, and GD12
YYH13 YYH16 GD12
Scaffolds N50 578,201 bp 41,655 bp 42,825 bp Scaffolds N90 113,623 bp 9276 bp 10,787 bp Number of scaffolds 608 2550 1637 Contig N50 79,575 bp 9684 bp 2655 bp Contig N90 20,512 bp 177 bp 1259 bp Total size (scaffolds) 38,930,246 bp 38,920,148 bp 36,656,850 bp Total size (contig) 38,928,694 bp 43,641,621 bp 37,949,230 bp No. of large scaf (>1 kb) 462 1918 1609 No. of large contig
(>1 kb) 1144 7564 9830
G + C content 47.19% 47.93% 48.28%
N rate 0.00% 0.25% 0.62%
Number of CEGs
identi-fied 242 (97.58%) 241 (97.18%) 238 (95.97%) Total protein coding
genes 11,302 11,758 11,203
Total gene lengths (exon
and intron) 19,416,112 18,964,664 18,415,061 Total exon count 31,674 32,404 33,973 Average exon length 542.43 518.89 457.30 Average exon count per
gene 2.80 2.76 3.03
Total introns 20,372 20,646 22,770 Average intron length 109.72 104.16 126.44 Average introns per
gene 1.80 1.76 2.03
Fig. 2 17-mer analysis of YYH13, YYH16, and T. reesei QM6a. A single peak is seen around 60 in YYH13 and YYH16. The longer tail of YYH16 suggest-ing more repetitive content
Table 3 17-mer analysis using YYH13, YYH16, and reesei sequencing data
Species Kmer Kmer count Kmer depth Genome
size (M) Revised genome size (M) Heterozygousity rate (%) Repeat (%)
YYH13 17 2,603,966,477 60.15 43.29 43.29 0.35 30.13
YYH16 17 2,942,740,366 59.05 49.83 49.82 0.51 46.59
REESEI 17 959,718,356 20.51 46.79 43.45 0.29 30.34
for all of the subsequent analyses. The average gene structures (gene size, exon size, and intron size) were also similar among the T. hamatum species (Table 2).
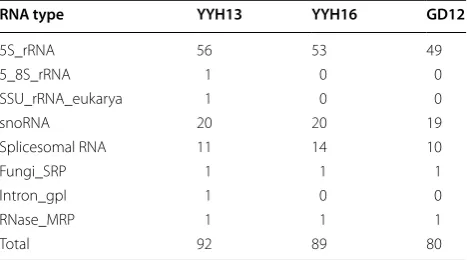
We then annotated repetitive elements using Repeat-Modeler and RepeatMasker and found 1.47% repetitive elements for YYH13 and 1.58% for YYH16, with the most contribution due to simple repeats (Table 4). In terms of transposable elements, T. hamatum had similar levels to T. atroviridae (0.49%), T. reesei (0.57%), and T. virens (0.48%) [22]. Finally, the non-coding RNA (ncRNA) annotation tracks were an important contribution to the genome-wide annotation datasets of both YYH13, YYH16, and GD12, not only contributing to the protein-based annotation but also helping to identify annotation errors (Table 5).
Identifying functionally important genes through selection pressure analysis
Selection pressure is an important source for genetic differences that may confer phenotypic differences. By
examining the nonsynonymous and synonymous sub-stitution rates of all of the one-to-one ortholog pairs of YYH13, YYH16, and GD12, we found that the majority of the genes (>98%) exhibited Ka/Ks <1, suggesting that most of the orthologs are highly conserved in evolution (Additional file 1). Nevertheless, we found that 131 genes between YYH13 and YYH16, 146 genes between GD12 and YYH16, and 154 genes between GD12 and YYH13 corresponded to Ka/Ks value greater than 1. To screen for YYH13 genes that underwent positive selection, we selected genes that satisfied positive selection criteria between YYH13 and the other two genomes but neutral or purifying selection between YYH16 and GD12. Inter-estingly, we found 13 genes that satisfied the above condi-tion, one of which (GB7226_YYH13) encodes a putative subtilisin protease, which has been shown to be an exo-protease during cellulose metabolism [23, 24].
Notably, the difference between the percentages of non-synonymous mutations was retained among the three strains, which may be due to the different physi-ological conditions used for the selection of the strains. The selection could have been stronger for YYH13, resulting in positive selection, and thus preferential retention of non-synonymous SNVs. Moreover, Darwin-ian selection was tested [27], and the results showed that positive selection drove the evolution of sequences lead-ing to well-known β-glucosidases involved in lignocellu-lose. Indeed, this study found that YYH13 has 13 genes with Ka/Ks >1, there is an obvious selection pressure will lead to β-glucosidase gene (YYH1311079) production diversity and genetic and functional difference.
Synteny analysis of T. hamatum strains
Because YYH13 and YYH16 were isolated from the same location, we expected their genomic structures to be highly similar. We examined synteny relationships using orthocluster based on the gene annotations and one-to-one orthologous relationships identified by Inpara-noid, and we found that YYH13 and YYH16 exhibited high synteny levels, whereas YYH16 and GD12 showed the least synteny (Fig. 4). This result is in agreement with the phylogenetic analysis that revealed YYH16 is slightly more distant to YYH13 and GD12, suggesting that YYH16 may have undergone genome rearrangement that caused a decrease in its lignocellulose degradation activity.
As previously argued, high synteny between organisms indicates evolutionary relatedness. Therefore, we expect to find more genes with high synteny than between more distant pairs of species. However, Berlin [28] argued that gene transposition, insertions, deletions, and duplications and rearrangements of chromosome fragments destroy synteny. We found that although some characteristics of Table 4 Repetitive element annotation in YYH13, YYH16,
and GD12
Type YYH13 YYH16 GD12
Repeat length 571,404 bp 614,668 bp 478,638 bp % of genome 1.47% 1.58% 1.31% DNA
transpo-sons 70,804 bp (0.18%) 27,383 bp (0.07%) 54,399 bp (0.15%) LINE 3710 bp (0.01%) 17,140 bp
(0.04%) 7052 bp (0.02%) SINE 0 bp (0%) 0 bp (0%) 0 bp (0%) LTR 43,448 bp
(0.11%) 44,856 bp (0.12%) 38,856 bp (0.11%) Satellites 7770 bp (0.02%) 7550 bp (0.02%) 6257 bp (0.02%) Simple repeats 402,017 bp
(1.03%) 432,358 bp (1.11%) 324,187 bp (0.88%) Low complexity 78,531 bp
(0.20%) 83,574 bp (0.21%) 66,153 bp (0.18%)
Table 5 Non-coding RNA annotation in YYH13, YYH16, and GD12
RNA type YYH13 YYH16 GD12
5S_rRNA 56 53 49
5_8S_rRNA 1 0 0
SSU_rRNA_eukarya 1 0 0
snoRNA 20 20 19
Splicesomal RNA 11 14 10
Fungi_SRP 1 1 1
Intron_gpI 1 0 0
RNase_MRP 1 1 1
the tri/TRI cluster have been conserved during evolution of YYH13 and YYH16, the cluster has undergone marked changes, including gene loss or gain, gene rearrangement, and divergence of gene function. In comparison, previous studies [29] have indicated that syntenic gaps in other genomes are enriched in genes that are important for species difference attributes. Although the mechanism and specific biological functions of YYH13 gene duplica-tion have not be clarified, Ambro [30] showed that gene evolution is accelerated to derive new functional genes after gene duplication.
Strain‑specific genes in YYH13, YYH16 and GD12
One way for obtaining a new phenotype is by acquiring new genes [31]. To examine this possibility, we identified strain-specific genes in YYH13, YYH16, and GD12 by examining orthologous relationships between gene anno-tations. Although over 90% of the orthologous genes are shared among all three genomes, a small fraction of genes show genome specificity. Based on the GeneMark-ES annotation, we identified 270 genes in YYH13, 808 genes in YYH16, and 508 genes in GD12 that are strain-spe-cific (Fig. 5). We employed a gene revision procedure to ensure that these genes were not identified due to tech-nical errors in gene annotation or inadequate genome assembly. After revision, we found 172 genes in YYH13, 655 in YYH16, and 320 in GD12 that we believe are genome difference with high confidence. However, the majority of these genes do not possess any known func-tional annotation and only match hypothetical genes in other species (Additional file 2). Of the genes that can be annotated, YYH13 possess a gene with a subtilase domain
and another gene with an alpha/beta hydrolase domain, both of which are domains found in many peptidases. In YYH16, we found three genes with helicase domains and two genes with transporter function. The comparison of gene functions in these genome difference genes showed that the functions between the genomes are quite differ-ent, suggesting that YYH13 and YYH16 may have under-gone strain difference evolution.
In this study, the rate of synonymous substitutions in the YYH13 gene was found to be very small, which generally
Fig. 4 Circos plot of synteny relationships between two genome assemblies. The synteny is based on imperfect synteny blocks identified by Orthocluster. The contigs for the relationships are ordered by the assemblies on the left. The number below the strain name is the genome size with contigs that show one-to-one orthologous relationships. Each line in the centre of the circos plot represent one synteny block between the two assemblies. A more ordered lines indicates higher level of synteny conservation while a more complex banding pattern represent less synteny conservation
occur in the process of evolution during a large-scale genome duplication event, indicating that recent duplica-tion has played an important role in the creaduplica-tion of syn-onymous substitutions. At the same time, the purification selection pressure after YYH13 difference gene duplication was less than gene duplication of communalism, which suggests that the difference of the difference genes is more likely to produce functional variations. Nevertheless, dif-ference genes of YYH16 may be due to functional redun-dancy, which contribute less to degrading lignocellulose. Similarly, the instability of transposable elements may lead to YYH16 gene rearrangement, and distribution imbal-ances of insertion sequences may also affect its evolution, leading to difference expression differences among strains.
Proteases gene family comparison
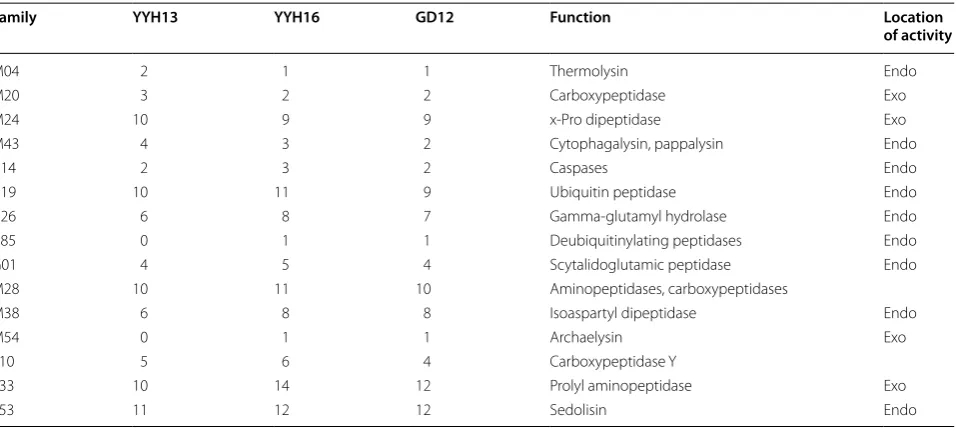
Proteases are important enzymes that digest and cleave peptides at various levels of metabolism. However, pro-teases of Trichoderma have not been systematically com-pared at the whole-genome scale. Here, we systematically annotated protease genes in the YYH13, YYH16, and GD12 genomes using the MEROPS database [32]. A large portion (9%) of the secreted protein of T. harzianum was identified as proteases when grown on cellulose [33], sug-gesting its importance in the cellulose degradation pro-cess. We annotated the gene and identified 58 protease families in the YYH13 and YYH16 genomes. Of these families, 26 initially showed gene family expansion or contraction. After gene revision, we found 15 gene fami-lies that still differ between YYH13 and YYH16 (Table 6).
Gene families that have more members in YYH13 include all of the metallopeptidases, whose activity requires metal ions, whereas those in YYH16 are more varied. Genomes show expansions in carboxypeptidases, which are involved in the degradation of barley cell walls by T. viride [34].
However, carboxypeptidases in the Trichoderma spe-cies with no known identified, thus the roles of the car-boxypeptidases of T. hamatum in these interactions are still unknown. The proteases of Trichoderma spp. and their biocontrol roles have been previously reported [35]. Interestingly, this work describes a protease gene fam-ily analysis of T. hamatum focusing on biomass degrad-ing activity. Proteases have evolved to utilize different mechanisms for proteolysis [36, 37]. Further studies are needed to understand what causes T. hamatum to pro-duce primarily protease-degrading enzymes when grown in the presence of cellulose.
CAZyme gene family comparison
CAZymes are families of enzymes that degrade, modify, or generate glycosidic bonds [38]. These enzymes, especially those of hydrolytic enzymes, have been associated with the mycoparasitism of Trichoderma [39]. Of the 140 CAZyme gene families that we annotated using dbCAN, we initially found 36 families that exhibited gene family expansion or contraction between YYH13 and YYH16. To ensure that the observed differences were not due to technical errors from annotation or genome assembly, we employed the same gene annotation revision to recover any gene
Table 6 Protease family showing difference between YYH13 and YYH16
Location of activity indicates whether the family is an endoprotease or exoprotease Enzymes: C cysteine proteases, G glutamic proteases, M metalloproteases, S serine proteases
Family YYH13 YYH16 GD12 Function Location
of activity
M04 2 1 1 Thermolysin Endo
M20 3 2 2 Carboxypeptidase Exo
M24 10 9 9 x-Pro dipeptidase Exo
M43 4 3 2 Cytophagalysin, pappalysin Endo
C14 2 3 2 Caspases Endo
C19 10 11 9 Ubiquitin peptidase Endo
C26 6 8 7 Gamma-glutamyl hydrolase Endo
C85 0 1 1 Deubiquitinylating peptidases Endo
G01 4 5 4 Scytalidoglutamic peptidase Endo
M28 10 11 10 Aminopeptidases, carboxypeptidases
M38 6 8 8 Isoaspartyl dipeptidase Endo
M54 0 1 1 Archaelysin Exo
S10 5 6 4 Carboxypeptidase Y
S33 10 14 12 Prolyl aminopeptidase Exo
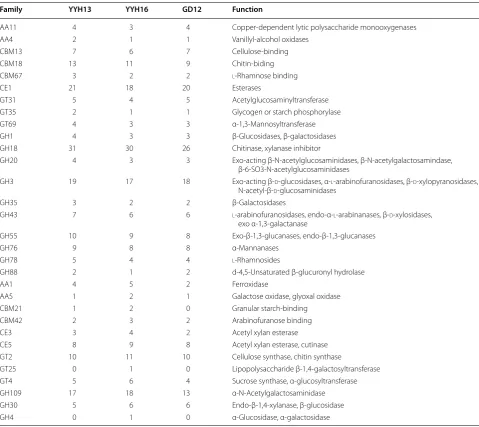
annotation that may have been missed. After our gene annotation revision, we found 31 gene families that still showed differences between YYH13 and YYH16, including four CAZyme auxiliary enzyme (AA) families, five carbo-hydrate-binding modules (CBM) families, three carbohy-drate esterase (CE) families, 13 glycoside hydrolase (GH) families, and six glycosyl transferase (GT) families (Addi-tional file 3). In general, YYH13 possesses more GH fam-ily members than YYH16. In fact, 10 of the 13 expanded GH family members are in YYH13, including many fami-lies of chitinases, glucosidases, galactosidases, and glu-canases (Table 7). However, the gene family expanded in
YYH16 functions in acetylgalactosaminidase, xylanase and α-glucosidase. All of these 10 GH families lacked clear orthologs in YYH16. The phylogenetic analysis indicated that the additional genes in YYH13 are primarily due to gene family expansion and only three families (GH1, GH3, and GH55) suggest gene family contraction in YYH16 (Fig. 6). The other three families with more members in YYH16 showed YYH16 gene family expansion in GH109 and YYH13 gene family contraction in GH30.
Of the GH families, those containing β-glucosidases include GH1, GH3, GH5, GH9, GH30 and GH116. The GH1, GH5, and GH30 β-glucosidases fall in GH Clan A,
Table 7 CAZyme families that show difference between YYH13 and YYH16
Function is based on CAZY database annotation
Enzymes: GH glycoside hydrolase, GT glycosyltransferase, CBM carbohydrate-binding module, AA auxiliary activity, CE carbohydrate esterase
Family YYH13 YYH16 GD12 Function
AA11 4 3 4 Copper-dependent lytic polysaccharide monooxygenases
AA4 2 1 1 Vanillyl-alcohol oxidases
CBM13 7 6 7 Cellulose-binding
CBM18 13 11 9 Chitin-biding
CBM67 3 2 2 l-Rhamnose binding
CE1 21 18 20 Esterases
GT31 5 4 5 Acetylglucosaminyltransferase
GT35 2 1 1 Glycogen or starch phosphorylase
GT69 4 3 3 α-1,3-Mannosyltransferase
GH1 4 3 3 β-Glucosidases, β-galactosidases
GH18 31 30 26 Chitinase, xylanase inhibitor
GH20 4 3 3 Exo-acting β-N-acetylglucosaminidases, β-N-acetylgalactosamindase, β-6-SO3-N-acetylglucosaminidases
GH3 19 17 18 Exo-acting β-d-glucosidases, α-l-arabinofuranosidases, β-d-xylopyranosidases, N-acetyl-β-d-glucosaminidases
GH35 3 2 2 β-Galactosidases
GH43 7 6 6 l-arabinofuranosidases, endo-α-l-arabinanases, β-d-xylosidases, exo α-1,3-galactanase
GH55 10 9 8 Exo-β-1,3-glucanases, endo-β-1,3-glucanases
GH76 9 8 8 α-Mannanases
GH78 5 4 4 l-Rhamnosides
GH88 2 1 2 d-4,5-Unsaturated β-glucuronyl hydrolase
AA1 4 5 2 Ferroxidase
AA5 1 2 1 Galactose oxidase, glyoxal oxidase
CBM21 1 2 0 Granular starch-binding
CBM42 2 3 2 Arabinofuranose binding
CE3 3 4 2 Acetyl xylan esterase
CE5 8 9 8 Acetyl xylan esterase, cutinase
GT2 10 11 10 Cellulose synthase, chitin synthase
GT25 0 1 0 Lipopolysaccharide β-1,4-galactosyltransferase GT4 5 6 4 Sucrose synthase, α-glucosyltransferase
GH109 17 18 13 α-N-Acetylgalactosaminidase
GH30 5 6 6 Endo-β-1,4-xylanase, β-glucosidase
which consists of proteins with (β/α)8 barrel structures. In contrast, the active site of GH3 enzymes comprises two domains, while GH9 enzymes have (α/α)6 bar-rel structures. The mechanism by which GH1 enzymes recognize and hydrolyze substrates with different spe-cificities remains an area of intense study [40]. For the rational design of improved biocatalysts, it is advanta-geous to work with a well-characterized enzymes or at least enzymes from well-studied families, such as the GH1. These results are consistent with the fact that GH1 enzymes have a large range of potential substrates and specificities, particularly regarding aglycone. To examine whether the activity is indeed higher in YYH13, we sub-jected YYH13, YYH16, and T. reesei QM6a to enzymatic tests on rice straw in exoglucanase, endoglucanase, and β-glucosidase. Our results showed that YYH13 was sev-eral-fold higher in activity than YYH16 (Fig. 7).
The saprotrophic species T. reesei is a model for study-ing Trichoderma physiology [41]. Comparative genom-ics showed that YYH13 has a bigger genome than the
mycoparasitic species T. reesei, suggesting that gene expansion events have occurred in an ancestor of YYH13. YYH16 is a close relative of YYH13, although YYH13 has more lignocellulose degrading related genes, includ-ing CAZymes, than YYH16, suggestinclud-ing that additional saprotrophic gene expansion events occurred in YYH13 after divergence from YYH16. In summary, T. reesei is an efficient producer of cellulases and hemicellulases and is used as the major industrial resource of these enzymes [42]. YYH13 is also an efficient cellulase producer. Fur-thermore, comparing cellulolytic enzymes and hemicel-lulolytic enzymes indicates that the number of these genes did not reduce but was increased in YYH13. The increase in lignocellulose degrading ability is affiliated with the increase in the number of lignocellulose degrad-ing-related genes. Saprotrophy of plant biomass and the high efficiency of cellulolytic enzymes and hemicel-lulolytic enzyme production suggest that these enzymes may have been optimized to improve specific activities or expression levels in YYH13. In addition, chitinases,
Fig. 6 Examples of gene families with gene family expansion in YYH13 or gene family contraction in YYH16. The trees were constructed from a
GH1, b GH3, and c GH55 with genes found in YYH13, YYH16, and GD12. The red dots indicate gene the expanded genes in YYH13 and the green dot
indicate sub-family with missing YYH16 likely due to gene family contraction
glucosidases, galactosidases, and glucanases are subject to stronger positive selection pressure in YYH13, imply-ing that these enzymes may also play crucial roles in lig-nocellulose degradation.
The omics data analysis and experimental results showed that YYH13 genome expansion is affected by environmental conditions. To adapt to the specific requirements of the host environment, more genes of YYH13 have been differentiated and have formed mul-tiple gene families. The Red Queen hypothesis [43, 44] considers that microorganisms are constantly faced with a contradiction between evolution and adaptation in the biological environment such that their genomes must be modified and transformed to overcome the contradic-tion. Phylogenetic analysis revealed that YYH13 muta-tions function significantly stronger than the effect of homologous recombination and that the classification characteristics and genealogy of YYH13 and YYH16 were shaped by these mutations. Consequently, given the dif-ferences in the genomes of strains isolated from the same area and phylogenetic classifications among different
geographical regions, notwithstanding the environmental and geographic distribution distance factors, there may be other factors driving the evolution of YYH13, YYH16, and GD12 genomes and their population difference.
Expression assay of GH1 genes in YYH13 and YYH16
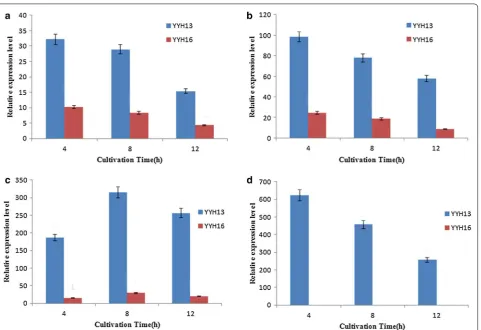
As shown in Fig. 8, gene expression levels for cellobiose as a carbon source were higher in YYH13 than YYH16. Minimal glucose but no cellobiose was detected in the YYH13 culture, suggesting that cellobiose was read-ily hydrolyzed to glucose by extracellular β-glucosidases rather than transported into cells. The expression levels of six genes were substantially higher in YYH13 than in YYH16 from 4 to 12 h. The maximum expression levels of YYH137902 (YYH1612), YYH13952 (YYH1611163) and YYH134611 (YYH164503) in YYH13 were three times, four times and 10 times higher than that in YYH16, respectively (Fig. 8). Moreover, the expression of YYH1311079 was notably higher than other genes when grown on cellobiose in YYH13, indicating stronger deg-radation levels of cellobiose.
In contrast, we found that the activity of β-glucosidase in YYH13 was significantly higher than QM6A (Fig. 7c). In fact, β-glucosidase is an important component of the cellulase enzyme system that not only participates in cel-lulose degradation but also plays a key role in hydrolyzing cellulose to fermentable glucose by relieving the inhibi-tion of exoglucanase and endoglucanase from cellobiose. However, it is difficult for T. reesei to efficiently convert cellobiose to glucose due to the lack of β-glucosidase, although it is a good producer of cellulase [24].
Cellobiose, which is an intermediate product, is also a strong inhibitor of endoglucanase and exoglucanase and is one of the key bottlenecks in enzymatic hydrolysis [45]. To prevent this inhibition process, the cellobiose unit must be immediately removed. β-glucosidase reduces cellobiose inhibition by hydrolyzing the disaccharide to glucose, allowing cellulolytic enzymes to function more efficiently [46]. Therefore, homologous produc-tion and evoluproduc-tionary studies of the β-glucosidase gene (YYH1311079) from the biomass-degrading fungus T. hamatum gives new insights into the physicochemical parameters and biodiversity of this family.
Cloned YYH1311079 gene and construction of pGEX‑KG/YYH1311079 expression vector
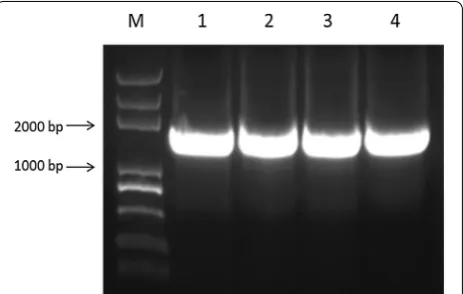
In the present study, YYH1311079 gene fragment of about 1575 bp was cloned according to the YYH13 cDNA library by PCR (Fig. 9). After the double digestion of the recombinant plasmid with BamHI and HindIII, the result of 1% agarose gel electrophoresis of positive clones showed two specific bands. One was close to the location of plasmid before the digestion, the other had a uniform size as the target gene (Fig. 10). The result of DNA sequencing showed that the inserted fragment was 1575 bp, and when it was matched with the YYH1311079 gene sequence recorded in the YYH13 genome, the sequencing results were 100% homologous.
YYH1311079 cDNA clone was inserted in the pGEX-KG, a expression vector at BamHI and HindIII sites. Fol-lowing transformation to Escherichia coli BL21 (DE3) cells, the recombinant clone was selected and propa-gated. The recombinant plasmid with YYH1311079 gene insert was confirmed following the digestion with BamHI and HindIII which released the fragment of desired 1575 bp. Ampicillin resistance gene and ColE1 origin are provided for selection and maintenance of recombinant in E. coli.
The pGEX-KG/YYH1311079 engineered bacteria was constructed according the antibiotic resistance, colony PCR and sequencing analysis. It indicated that the expres-sion plasmid was constructed correctly. Overall, our results will provide a valuable gene that will be explain whether β-glucosidase is a key rate-limiting enzyme
in the process of cellulose degradation. YYH13 strain whether displayed better characteristics in cellulose degradation, and showed great application potentials in ethanol production through degrading renewable ligno-cellulosic biomass although correlative mechanisms still need further exploration.
Methods
Morphological analysis
The isolates were cultured on PDA (Potato Dextrose Agar, Difco) and were incubated in normal light for 3 days at 28 °C. For morphological characterization of T. hamatum, observations on morphology of mycelium, spore, and colonial were made using Microscopic Imag-ing System-MVC2000 [17].
Strains growth conditions and mycelium dry weights determinations
Mature spores of YYH13 and YYH16 strains were col-lected and re-suspended in sterile distilled water contain-ing 0.05% Tween 20 (Sigma, USA). Spores were counted
Fig. 9 Amplified products of YYH1311079 gene (M Trans2K Plus DNA Marker, 1–4 PCR products)
by haemacytometer. 5 × 10⁵ spores of YYH13 and YYH16 strains were added to 50 mL PDA liquid media respectively, and cultured at 28 °C in the conditions of dark and continuous shaking. For the determination of fungal dry weights, mycelia were collected by two lay-ers of paper filter (Whatman GF-C) after culture of 12, 24, 36, 48, 60, 72, 84 and 96 h respectively. Mycelia were rinsed with distilled water three times and then dried in oven at 60 °C.
Strains liquid fermentation culture conditions
YYH13 (T. hamatum), YYH16 (T. hamatum) and QM6A (T. reesei) strains at the same growth states were cul-tured in liquid fermentation medium (NH4NO3·2 g, KH2PO4·4 g, MgSO4·7H2O 0.3 g, CaCl2·2H2O 0.3 g, MnSO4·7H2O 0.007 g, FeSO4·7H2O 0.005 g, NaCl 0.1 g, 1% of rice straw, 1000 mL H2O, pH 6.0) at 28 °C and while shaking at 120 rpm for 0, 24, 48, 72, or 96 h. Crude enzyme extract was obtained via centrifugation at 13,000g× 10 min at 4 °C, and the supernatants were used for enzyme activity assays.
YYH13 and YYH16 strains at the same growth state were cultured in the minimal medium (NH4NO3·2 g, KH2PO4·4 g, MgSO4·7H2O 0.3 g, CaCl2·2H2O 0.3 g, MnSO4·7H2O 0.007 g, FeSO4·7H2O 0.005 g, NaCl 0.1 g, peptone 3 g, 1000 mL H2O, pH 6.0). After 48 h of cul-tivation at 28 °C while shaking at 120 rpm, the mycelia were harvested and transferred to the same medium con-taining no peptone, and 1% d-cellobiose was added. The cultures were then incubated at 28 °C while shaking at 120 rpm for 0, 4, 8, or 12 h. All of the assays were per-formed in triplicate.
Enzyme assays
All enzyme activities were presented as specific activi-ties using international units (IU) per mL supernatant. The FPase (FPA) activity and endoglucanase (EG) activ-ity were measured by the DNS method with glucose as a standard, as described in [47, 48]. The β-glucosidase activity was determined using p-Nitrophenyl-β-d-glucopyranoside (pNPG) as a substrate based on the reported method by Takashima [49]. The exo-1,4-β-glucanase (CBH) activity was measured as reported by Deshpande [50].
Sequencing and assembly
The sequenced reads were examined for low quality reads by filtering reads with adaptor sequences of >10% Ns or >50% nucleotides of quality (Q) ≤5. The final output was the clean reads. A genome survey was per-formed with the clean reads by counting the frequency of 17-mers from 3.8 Gb of data from YYH13 and YYH16. The K-mer frequency was plotted using R.
The assembly was performed using SOAPdenovo [51] with K-mer ranging from 21 to 111, and the assembly with the largest N50 was chosen. Scaffolds that are less than 500 bp were removed in the final assembly.
Phylogenetic analysis of YYH13 and YYH16
Genomic sequence spanning ITS1 and ITS2 were extracted from a previous sequencing study [21]. A total of 54 ITS1-ITS2 sequences were used as queries in BLAST against YYH13 and YYH16 assemblies. A phylo-genetic tree with the ITS1-ITS2 sequences from YYH13 and YYH16 was built by first aligning 92 other sequences from JGI database (http://jgi.doe.gov/) and GenBank (https://www.ncbi.nlm.nih.gov/genbank/). Species recog-nition in Trichoderma is usually based on the application of the genealogical concordance phylogenetic species recognition concept based on the partial genes sequences of translation elongation factor 1ɑ (Tef-1), calmodulin (cal1-1), and chitinase 18-5 (chi18-5) [52]. To further confirmed that YYH13 and YYH16 are strains of the T. hamatum species, the concatenated sequence of Tef-1, cal1-1, and chi18-5 genes were used to construct a phy-logenetic tree as described. Consensus tree was inferred using the neighbour-joining method. Bootstrap analy-sis was conducted using the MEGA 5.1 (http://www. megasoftware.net/) with 1000 replications to obtain the confidence value for the aligned sequence dataset. A phy-logenetic tree was constructed via maximum parsimony.
Genome annotation
Gene annotation was performed using GeneMark-ES 2.3.e [53] on YYH13, YYH16, and GD12 assemblies. The GD12 assembly and FgeneSH annotation on GD12 was downloaded from JGI. Each gene was annotated for its putative function using GO, the NCBI-nr database, KOG, and KEGG. Putative functional domains were anno-tated using Pfam (Protein families). Genes with puta-tive CAZyme functions were annotated using dbCAN [54] with version 4 of the database. A valid annotation required database alignment >80 aa, E-value < 1e−5, and percent alignment coverage >30%. Genes with putative protease functions were annotated using the MEROPS database Release 9.13 (Rawlings et al. [32]) with BlastP PID >35%, E-value < 1e−5, and bit score >30. Repetitive element annotation was performed using RepeatModeler and RepeatMasker (www.repeatmasker.org) under the default settings.
Genome sequence analysis
was performed via reciprocal genBlastG [56] compari-sons between YYH13 and YYH16. Thus, genBlastG was performed with YYH13 genes as the query and the YYH16 genome as the target, and vice versa. The gen-BlastG model must lie within the same coordinates as the original gene model. The revised model is from the highest global PID among the three gene pairs (I: Origi-nal YYH13 gene and origiOrigi-nal YYH16 gene; II: OrigiOrigi-nal YYH13 gene and genBlastG model in YYH16 genome; III: Original YYH16 gene and genBlastG model in YYH13 genome).
The gene model revision in GD12 was performed first using the revised YYH13 gene set as the query and further improved using YYH16. If a gene model was improved by both YYH13 and YYH16, only the revision from YYH13 was kept. Finally, the mean PID and stand-ard deviation were calculated based on the revised one-to-one relationships for each pair of genome.
Genome difference genes were identified using Tribe-MCL (inflation value = 1.6) [57] with the original gene set. Each genome difference genes were examined using genBlastG. For each genome difference gene, genBlastG was used against the two other genomes under the default settings. If the genBlastG model and the query showed a global PID ≥ mean PID-2 standard deviations, then the genome difference gene was considered a false positive and filtered.
Synteny analysis
The synteny blocks between two genomes were analyzed using orthocluster with parameters “-f–rs”. The perfect synteny blocks did not allow for any mismatches. Imper-fect synteny blocks were obtained with additional “-i 5–o 5” parameters. The orthologous relationships used as input were the one-to-one relationships based on the Inparanoid results. The Circos diagram was constructed by including only the scaffold containing gene models. The genome on the right was considered the reference, and the genome on the left were reordered.
Gene family comparison
The gene family annotation for CAZyme and proteases were annotated to the orthologous relationships from Inparanoid. Genomes that were missing orthologous genes in the family were examined using genBlastG revi-sion to ensure the difference observed was not due to misassembly or misannotation. First, if genBlastG was able to produce a gene model in the target genome with percent identity (PID) > mean PID-2 standard deviation, then the model was considered a valid homologous gene. Otherwise, it was considered a low PID and was filtered. If gene family expansion had occurred, a valid genBlastG model may overlap with an existing gene annotation.
Thus, if a valid genBlastG model overlapped with an existing gene annotation that already had an ortholog, then the genBlastG model was filtered. The genBlastG models were also annotated using dbCAN and MEROPS, as previously described, and marked as “No annotated function” if the sequence did not pass the annotation criteria.
Ka/Ks analysis
Synonymous and non-synonymous mutations were determined from pair-wise alignments of revised one-to-one relationships. Ka/Ks ratio was calculated using Ka/Ks Calculator 2.0 using the MYN algorithm.
Real‑time polymerase chain reaction
Mycelia were harvested, frozen and ground in liquid nitrogen. Total RNAs from the mycelia were extracted using TRIzol (Invitrogen, USA), and polyA mRNAs were purified using a PolyATract mRNA Isolation System (Promega, Madison, WI) according to the manufacturer’s instructions. All cDNAs were synthesized via reverse transcription reaction performed using ReverTra Ace (Toyobo, Japan) at 42 °C for 1 h and then 85 °C for 15 min to stop the reaction. The standard protocol was 95 °C for 10 min followed by 40 cycles at 95 °C for 10 s and 59 °C for 50 s. All reactions were performed in triplicate. The GAPDH was used as internal reference gene. GH1 fam-ily beta-glucosidase genes (YYH137902, YYH13952, YYH134611, YYH1311079, YYH1612, YYH1611163, YYH164503) were classified using dbcan analysis system, including YYH1311079 was specific gene, YYH137902 and YYH1612, YYH134611 and YYH164503, YYH13952 and YYH1611163 were between homologous genes. qRT-PCR was performed using PikoReal 96-well thermal cyclers (Thermo, USA) with primers and temperatures as described in Additional file 4.
Cloning and construction of recombinant plasmid expression vector
Escherichia coli strains BL21 (DE3) (Invitrogen, Carlsbad, CA, USA) were used for cloning and expression experi-ments. E. coli strains were grown in Luria–Bertani (LB) broth or on agar plates at 37 °C. Ampicillin (Sangon Bio-tech, Shanghai, China) was used in growth media when required. The vectors pGEX-KG (Takara, China) was used for polymerase (Additional file 5) chain reaction (PCR) cloning. The coding sequence of YYH1311079 was amplified by PCR using a sense primer (5′-CGCGG
ATCCATGTCCAAAGAGGCGTC GATGTTC-3′) and
an antisense primer (5′-CCCAAGCTTCTATATCCCT
followed by 30 cycles of amplification (95 °C for 10 s, 58 °C for 50 s, and 72 °C for 2 min) and an additional extension step at 72 °C for 10 min. Two white single colonies were selected and inoculated to 5 mL LB cul-ture solution containing 5 µL 100 μg/mL ampicillin and underwent shake culture at 37 °C overnight. The plas-mid DNA was extracted using alkaline lysis, and under-went two single digestions with BamHI and HindIII respectively, and then electrophoresis with 1% agarose gel was done to identify the positive clone. Some of the constructed pGEX-KG/YYH1311079 expression plas-mid were sent to Shen Zhen HuiDa an corp in China for sequencing.
Abbreviations
pNPGase: the β-glucosidase activity; pNPCase: the CBH activity; CMCase: the CMC activity; FPase: the filter paper activity; PDA: potato dextrose agar; IU: international units; pNPG: p-nitrophenyl-β-d-glucopyranoside; PCS: the pre-treated corn stover; GAPDH: glyceraldehyde-3-phosphate dehydrogenase.
Authors’ contributions
CP, JC, and NC designed research. CP,BL,YH AND XY performed research. XX,LC and SS contributed reagents and analytic tools. CP,BL,YS and YH analyzed data. CP,NC, and YS wrote the paper. All authors read and approved the final manuscript.
Author details
1 Hunan Provincial Key Laboratory of Phytohormones and Growth
Develop-ment, Hunan Provincial Key Laboratory for Crop Germplasm Innovation and Utilization, Hunan Agricultural University, Changsha 410128, China.
2 College of Life Science and Technology, Huazhong Agricultural University,
Wuhan 430070, China. 3 National Center for Citrus Improvement, Hunan
Agri-cultural University, Changsha 410128, China. 4 Wuhan Frasergen Bioinformatics
Co. Ltd, 666 Gaoxin Road, East Lake High-tech Zone, Wuahn 430075, China.
5 Department of Molecular Biology and Biochemistry, Simon Fraser University,
Burnaby, BC V5A 5S6, Canada.
Acknowledgements
The present study was supported by National Natural Science Foundation of China (31570372), Scientific research outstanding youth project of Hunan Provincial Education Department (15B112), Science and technology project of Hunan Province (2015NK3005), The Natural Science foundation of Hunan Province (2016JJ3074), Science and technology project of Changsha City (kh1601179), The Open Science Foundation of Hunan Provincial Key Labora-tory for Germplasm Innovation and Utilization of Crop (15KFXM13).
Competing interests
The authors declare that they have no competing interests. Additional files
Additional file 1. Ka/Ks calculations for each orthologs pair between YYH13, YYH16, and GD12.
Additional file 2. Genome difference genes annotated with NCBI NR, GO, KEGG, KOG, and Pfam.
Additional file 3. CAZyme families that; show difference in member numbers between YYH13 and YYH16.
Additional file 4. Primers used in qRT-PCR for validation of differentially expressed genes.
Additional file 5. Primers used in PCR for amplified products of
YYH1311079 gene.
Availability of data and materials
Data supporting the conclusions of this article are included within the article.
Publisher’s Note
Springer Nature remains neutral with regard to jurisdictional claims in pub-lished maps and institutional affiliations.
Received: 1 December 2016 Accepted: 9 April 2017
References
1. Castro LDS, Pedersoli WR, Antoniêto ACC, Steindorff AS, Silva-Rocha R, Martinez-Rossi NM, Rossi A, Brown NA, Goldman GH, Faça VM, et al. Comparative metabolism of cellulose, sophorose and glucose in Tricho-derma reesei using high-throughput genomic and proteomic analyses. Biotechnol Biofuels. 2014;7(1):196–202.
2. Fang T, Liao B, Lee S. Enhanced production of xylanase by Aspergillus carneus M34 in solid-state fermentation with agricultural waste using statistical approach. New Biotechnol. 2009;27(1):25–32.
3. Sanatan PT, Lomate PR, Giri AP, Hivrale VK. Characterization of a chemo-stable serine alkaline protease from Periplaneta americana. BMC Biochem. 2013;14(22):1–9.
4. He J, Kieselbach T, Jönsson LJ. Enzyme production by filamentous fungi: analysis of the secretome of Trichoderma reesei grown on unconventional carbon source. Microb Cell Fact. 2010;10(47):68.
5. Baba Y, Sumitani JI, Tani S, Kawaguchi T. Characterization of Aspergillus aculeatus, β-glucosidase 1 accelerating cellulose hydrolysis with Tricho-derma, cellulase system. AMB Express. 2015;5(1):1–9.
6. Bussink HJ, Buxton FP, Fraaye BA, de Graaff LH, Visser J. The polygalacturo-nases of Aspergillus niger are encoded by a family of diverged genes. Eur J Biochem. 1992;208(1):83–90.
7. Patil SR, Dayanand A. Optimization of process for the production of fungal pectinases from deseeded sunflower head in submerged and solid-state conditions. Bioresour Technol. 2006;97(18):2340–4. 8. Polizeli ML, Rizzatti AC, Monti R, Terenzi HF, Jorge JA, Amorim DS.
Xyla-nases from fungi: properties and industrial applications. Appl Microbiol Biotechnol. 2005;67(5):577–91.
9. Mandels M, Reese ET. Induction of cellulase in Trichoderma viride as influ-enced by carbon sources and metals. J Bacteriol. 1957;73:269–78. 10. Mukherjee PK, Horwitz BA, Herreraestrella A, Schmoll M, Kenerley
CM. Trichoderma research in the genome era. Annu Rev Phytopathol. 2013;51(1):105–29.
11. Druzhinina IS, Shelest E, Kubicek CP. Novel traits of Trichoderma, predicted through the analysis of its secretome. FEMS Microbiol Lett. 2012;337(1):1–9.
12. Seidl V, Seiboth B. Trichoderma reesei: genetic approaches to improving strain efficiency. Biofuels. 2010;1(2):343–54.
13. Beitel SM, Knob A. Penicillium miczynskii β -glucosidase: a glucose-toler-ant enzyme produced using pineapple peel as substrate. Ind Biotechnol. 2013;9:103–8.
14. Karkehabadi S, Helmich KE, Kaper T, Hansson H, Mikkelsen NE, Gudmundsson M, Piens K, Fujdala M, Banerjee G, Scott-Craig JS, et al. Biochemical characterization and crystal structures of a fungal fam-ily 3 beta-glucosidase, Cel3A from Hypocrea jecorina. J Biol Chem. 2014;289(45):31624–37.
15. Duff SJB, Cooper DG, Fuller OM. Cellulase and beta-glucosidase produc-tion by mixed culture of Trichoderma reesei Rut C30 and Aspergillus phoenicis. Biotechnol Lett. 1985;7:185–90.
16. Chuang YC, Li WC, Chen CL, Hsu WC, Tung SY, Kuo HC. Trichoderma reesei
meiosis generates segmentally aneuploid progeny with higher xylanase-producing capability. Biotechnol Biofuels. 2015;8(1):1–15.
17. Cheng P, Song W, Gong X, Liu YS, Xie WG, Huang LH, Hong YH. Proteomic approaches of Trichoderma hamatum to control Ralstonia solanacearum
causing bacterial wilt. Int J Agric Biol. 2015;17(6):987–90.
• We accept pre-submission inquiries
• Our selector tool helps you to find the most relevant journal • We provide round the clock customer support
• Convenient online submission • Thorough peer review
• Inclusion in PubMed and all major indexing services • Maximum visibility for your research
Submit your manuscript at www.biomedcentral.com/submit
Submit your next manuscript to BioMed Central
and we will help you at every step:
19. El-Hassan SA, Gowen SR, Pembroke B. Use of Trichoderma hamatum for biocontrol of lentil vascular wilt disease: efficacy, mechanisms of interac-tion and future prospects. J Plant Prot Res. 2013;53(1):12–26.
20. Toyama H. 1Hp20 Enhancement of the degrading ability of micro-crystalline cellulose in the selected strain derived from Trichoderma reesei
QM9414 treated with colchicine under lower temperature conditions. Manag Decis. 2013;52(5):934–49.
21. Studholme DJ, Winsbury R, Perera V, Ryder L. Investigating the beneficial traits of Trichoderma hamatum GD12 for sustainable agriculture-insights from genomics. Front Plant Sci. 2013;4:258.
22. Kubicek CP, Martinez DA, Druzhinina IS, Thon M. Comparative genome sequence analysis underscores mycoparasitism as the ancestral life style of Trichoderma. Genome Biol. 2011;12(4):81–9.
23. Baroncelli R, Piaggeschi G, Fiorini L, Bertolini E, Zapparata A, Pè ME, Sar-rocco S, Vannacci G. Draft whole-genome sequence of the biocontrol agent Trichoderma harzianum T6776. Genome Announc. 2015;3(3):1–2. 24. Martinez D, Berka RM, Henrissat B, Saloheimo M, Arvas M, Baker SE,
Chap-man J, Chertkov O, Coutinho PM, Cullen D, et al. Genome sequencing and analysis of the biomass-degrading fungus Trichoderma reesei (syn.
Hypocrea jecorina). Nat Biotechnol. 2008;26(5):553–60.
25. Sun RY, Liu ZC, Fu K, Fan L, Jie C. Trichoderma biodiversity in China. J Appl Genet. 2012;53(3):343–54.
26. Parra G, Bradnam K, Korf I. CEGMA: a pipeline to accurately annotate core genes in eukaryotic genomes. Bioinformatics. 2007;23(9):1061–7. 27. Levasseur A, Saloheimo M, Navarro D, Andberg M, Pontarotti P, Kruus
K, Record E. Exploring laccase-like multicopper oxidase genes from the ascomycete Trichoderma reesei: a functional, phylogenetic and evolution-ary study. BMC Biochem. 2010;11(1):1–10.
28. Berlin A, Maximenko V, Bura R, Kyu-Young K, Neil G, Jack S. A rapid microassay to evaluate enzymatic hydrolysis of lignocellulosic substrates. Biotechnol Bioeng. 2006;93(5):880–6.
29. Machida M, Asai K, Sano M, Toshihiro T, Toshitaka K, Goro T, Kusumoto KI, Arima T, Akita O, Kashiwagi Y, et al. Genome sequencing and analysis of
Aspergillus oryzae. Nature. 2005;438(7071):1157–61.
30. Ambro VH. Conserved functions of yeast genes support the duplication, degeneration and complementation model for gene duplication. Genet-ics. 2005;171(4):1455–61.
31. Lange C, Weld RJ, Cox MP, Bradshaw RE, Mclean KL, Stewart A, Steyaert JM. Genome-scale investigation of phenotypically distinct but nearly clonal Trichoderma strains. PeerJ. 2016;4(5):e2023.
32. Rawlings ND, Waller M, Barrett AJ, Bateman A. MEROPS: the database of proteolytic enzymes, their substrates and inhibitors. Nucleic Acids Res. 2014;42(Database Issue):503–9.
33. Do VL, Gómez-Mendoza DP, Kim MS, Kim MS, Pandey A, Ricart CA, Ximenes FFE, Sousa MV. Secretome analysis of the fungus Trichoderma harzianum grown on cellulose. Proteomics. 2012;12(17):2716–28. 34. Kanauchi M, Bamforth CW. Growth of Trichoderma viride on crude cell
wall preparations from barley. J Agric Food Chem. 2001;49(2):883–7. 35. Elad Y, Kapat A. The role of Trichoderma harzianum protease in the
bio-control of Botrytis cinerea. Eur J Plant Pathol. 1999;105(105):177–89. 36. Rawlings ND, Barrett AJ. Evolutionary families of peptidases. Biochem J.
1993;290:205–18.
37. Rawlings ND, Barrett AJ, Bateman A. MEROPS: the database of pro-teolytic enzymes, their substrates and inhibitors. Nucleic Acids Res. 2012;40:343–50.
38. Vincent L, Hemalatha GR, Elodie D, Coutinho PM, Bernard H. The carbohydrate-active enzymes database (CAZy) in 2013. Nucleic Acids Res. 2014;42:490–5.
39. Druzhinina IS, Verena SS, Alfredo HE, Horwitz BA, Kenerley CM, Enrique M.
Trichoderma: the genomics of opportunistic success. Nat Rev Microbiol. 2011;9(10):749–59.
40. James R, Ketudat C, Asim E. β-Glucosidases. Cell Mol Life Sci. 2010;67(67):3389–405.
41. Thornton CR. An immunological approach to quantifying the sapro-trophic growth dynamics of Trichoderma species during antagonistic interactions with Rhizoctonia solani in a soil-less mix. Environ Microbiol. 2004;6(4):323–34.
42. Bischof R, Fourtis L, Limbeck A, Gamauf C, Seiboth B, Kubicek CP. Com-parative analysis of the Trichoderma reesei transcriptome during growth on the cellulase inducing substrates wheat straw and lactose. Biotechnol Biofuels. 2013;6(1):1–14.
43. Hantsch L, Braun U, Haase J, Purschke O, Scherer-Lorenzen M, Bruelheide H. No plant functional diversity effects on foliar fungal pathogens in experimental tree communities. Fungal Divers. 2014;66(1):1–13. 44. And KC, Kover PX. The red queen hypothesis and plant/pathogen
interac-tions. Annu Rev Phytopathol. 1996;34(34):29–50.
45. George SP, Ahmad A, Rao MB. Studies on carboxymethyl cellulase produced by an alkalothermophilic actinomycete. Bioresour Technol. 2001;77(2):171–5.
46. Shin HJ, Yang JW. Galactooligosaccharide synthesis from lactose by
Penicillium funiculosum cellulase. Biotechnol Lett. 1996;18(2):143–4. 47. Xiao Z, Storms R, Tsang A. Microplate-based filter paper assay to measure
total cellulase activity. Biotechnol Bioeng. 2004;88(7):832–7. 48. Xiao Z, Storms R, Tsang A. Microplate-based carboxymethylcellulose
assay for endoglucanase activity. Anal Biochem. 2005;342(1):176–8. 49. Takashima S, Nakamura A, Hidaka M, Masaki H, Uozumi T. Molecular
cloning and expression of the novel fungal beta-glucosidase genes from
Humicola grisea and Trichoderma reesei. J Biochem. 1999;125(4):728–36. 50. Deshpande MV, Eriksson KE, Göran Pettersson L. An assay for
selec-tive determination of exo-1,4,-β-glucanases in a mixture of cellulolytic enzymes. Anal Biochem. 1984;138(2):481–7.
51. Li Y, Hu Y, Bolund L, Wang J. State of the art de novo assembly of human genomes from massively parallel sequencing data. Hum Genom. 2010;4(4):271–7.
52. Druzhinina IS, Komoń-Zelazowska M, Ismaiel A, Jaklitsch W, Mullaw T, Samuels GJ, Kubicek CP. Molecular phylogeny and species delimita-tion in the secdelimita-tion Longibrachiatum of Trichoderma. Fungal Genet Biol. 2012;49(5):358.
53. Besemer J, Lomsadze A, Borodovsky M. GeneMarkS: a self-training method for prediction of gene starts in microbial genomes. Implica-tions for finding sequence motifs in regulatory regions. Am Bank. 2001;29(12):2607–18.
54. Yanbin Y, Xizeng M, Jincai Y, Xin C, Fenglou M, Ying X. dbCAN: a web resource for automated carbohydrate-active enzyme annotation. Nucleic Acids Res. 2012;40:445.
55. Ostlund G, Schmitt T, Forslund K, Köstler T, Messina DN, Roopra S, Frings O, Sonnhammer EL. InParanoid 7: new algorithms and tools for eukary-otic orthology analysis. Nucleic Acids Res. 2010;38:196–203.
56. She R, Chu JS, Uyar B, Wang J, Wang K, Chen N. genBlastG: using BLAST searches to build homologous gene models. Bioinformatics. 2011;27(15):2141–3.