R E S E A R C H
Open Access
Total cholesterol to high-density
lipoprotein cholesterol ratio is a significant
predictor of nonalcoholic fatty liver:
Jinchang cohort study
Xiao Yu Ren
1,2, Dian Shi
1,2, Jiao Ding
3, Zhi Yuan Cheng
2,5, Hai Yan Li
3, Juan Sheng Li
2, Hong Quan Pu
3,
Ai Min Yang
2,4, Cai Li He
2, Jian Ping Zhang
2, Yu Bao Ma
2, Ya Wei Zhang
5, Tong Zhang Zheng
4, Ya Na Bai
2*and
Ning Cheng
1*Abstract
Background:Some studies found out that TC/HDL-C ratio is a predictor of Cardiovascular disease (CVD) and Nonalcoholic fatty liver (NAFLD) is related to CVD. And some researches have already studied that Apolipoprotein B to Apolipoprotein A1 ratio (ApoB/ApoA1) and Triglyceride to High-density lipoprotein cholesterol ratio (TG/HDL-C) were both related with CVD and NAFLD, but few studied the association between TC/HDL-C ratio and NAFLD. So, we suspected the ratio was also related to NAFLD. The research aims to study the predictive value of TC/HDL-C to NAFLD and to help the early detection of NAFLD.
Methods:Based on the Jinchang Cohort, the study contained 32,121 participants. We assessed the incidence of NAFLD by the quartiles of TC, HDL-C and TC/HDL-C. Then, the does-response relationship between these indicators and the risk of NAFLD was obtained. Finally, the receiver operator characteristic curve (ROC) was applied to decide the predictive value of TC/HDL-C.
Results:Among the study participants, the cumulative incidence of NAFLD was 6.30% and the rate of dyslipidemia was 40.37%. The biochemical indicators of NAFLD had a difference with general population. The incidence of NAFLD raised with the quartiles of TC, TG and LDL-C raising, while decreased with the HDL-C′quartiles raising. After controlling confounding factors, TC and TC/HD-C had a positive relationship with NAFLD, while HDL-C had the opposite. Finally, the ROC analysis showed the area under the curve (AUC) of TC/HDL-C (0.645) was greater than TC (0.554), HDL-C (0.627) and Apolipoprotein B to Apolipoprotein A1 (ApoB/ApoA1) (0.613).
Conclusions:The TC/HDL-C ratio has significant predictive value to NAFLD.
Keywords:High-density lipoprotein cholesterol, Jinchang cohort, Nonalcoholic fatty liver, Predictive value, Total cholesterol
* Correspondence:[email protected];[email protected]; [email protected]
2Institute of Epidemiology and Statistics, School of Public Health, Lanzhou
University, Lanzhou 730000, Gansu, People’s Republic of China
1Key Laboratory of Preclinical Study for New Drugs of Gansu Province, Basic
Medical College, Lanzhou University, Lanzhou, Gansu 730000, People’s Republic of China
Full list of author information is available at the end of the article
Introduction
Recently, NAFLD has been the most common chronic liver disease worldwide [1]. NAFLD is an important prob-lem which can affect the public health all over the world; in both adults and children, it’s accompanied high rates of Cardiovascular disease (CVD). Meanwhile, NAFLD has a relationship with insulin resistance and hyperglycaemia, thus, it’s closely linked to type 2 diabetes [2,3].
NAFLD is a global issue worldwide. In western countries such as North America, Europe and Australia, NAFLD has been the main chronic liver disease [4,5]. It has been esti-mated that the prevalence of NAFLD varies between 20 and 30% among the western countries, Middle East and Japan. India subcontinent is 16–32% while China has a similar prevalence of 15–30% [6,7]. Thus, it’s an important task for identifying the future development of NAFLD in the population.
A few researches have indicated that the ratio of ApoB/ ApoA1 is a predict factor of NAFLD [8], and the ratio is also associated with metabolic syndrome and CVD [9–11]. TC/HDL-C is the most important determining factor of high-sensitivity C-reactive protein (hs-CRP), and hs-CRP is a biomarker of CVD risk, so TC/HDL-C can also predict
CVD [12,13]. Besides, the Framingham Cardiovascular In-stitute suggested that TC/HDL-C should be <4-to-1 [14]. Several studies also proved the ratio also had relationship with coronary heart disease [15,16]. Because both of the ra-tio and NAFLD have relara-tionships with CVD and on the grounds of the biological evidence summarized above, we hypothesized that TC/HDL-C might predict incident NAFLD. The study aims to identify the population which is at risk for future development of NAFLD. So based on the Jinchang Cohort, which has already studied the all causes of death, especially for cancer and cardiovascular diseases [17–20], we investigate the association between TC/HDL-C and NAFLD.
Methods Participants
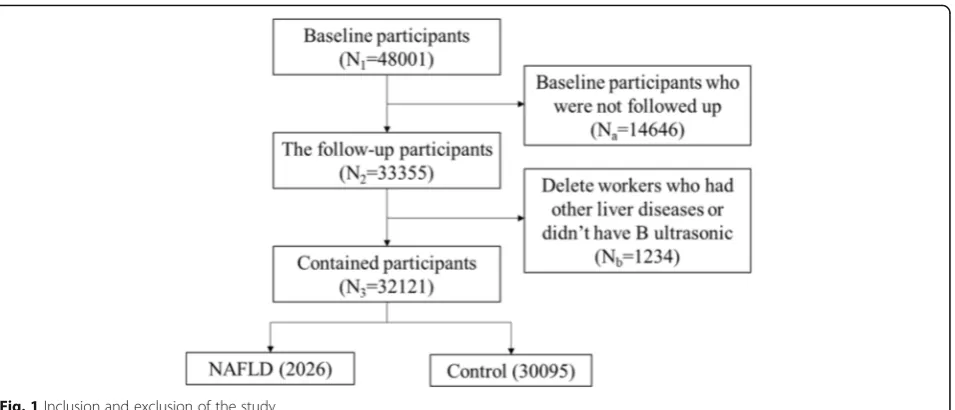
The research was based on Jinchang Cohort in Jinchang city, Gansu province, China. The cohort comes from a non-ferrous metals and chemical joint enterprise. The design and methods of the Jichang Cohort Study have previously been described in detail, so we just briefly in-troduced the cohort [21, 22]. Jichang Cohort was estab-lished by a baseline survey from June 2011 to December Fig. 1Inclusion and exclusion of the study
Table 1The incidence of NAFLD and the positive rate of dyslipidemia
Metabolic indicators Reference range Total Abnormal Incidence (%)
NAFLD – 32,121 2026 6.30
dyslipidemia† – 32,121 12,968 40.37
TC(μmol/L) <6.10 32,121 2201 6.85
TG(μmol/L) <1.82 32,121 11,418 35.55
HDL-C(μmol/L) >0.90 32,121 1785 5.56
LDL-C(μmol/L) <4.11 32,121 2100 6.54
†Dyslipidemia includes high TC, high TG, low HDL-C and elevated LDL-C
2013 which contained in-person interview, physical exams, lab-based tests and biosample collection of all 48,001 participants. From December 2013 to December 2015, the cohort has finished its first follow-up and 33,355 workers were followed up. After deleting 1234 workers who had other liver diseases or didn’t have B ultrasonic results, the study contained 32,121 workers at last. Figure 1 was the structure of the participants in or out. Consent was obtained from each participant in-cluded in the study and the study was approved by the Ethics Committee of JNMC.
Epidemiology survey
Questionnaire data was obtained from personal inter-views including the general demographic characteristics, lifestyle, dietary habits, the occupational history, the his-tory of diseases, the family hishis-tory and the female repro-ductive history. All the processes of data collection were under strict quality control: Investigators were profes-sional trained, and the auditors checked the question-naires strictly to find out the mistakes and corrected them. Afterwards, the professional keyboarders used Epi Data3.0 software to record the questionnaires by double blind, and meanwhile, they corrected logical errors to make sure the authenticity of the data.
Physical examination
The examination included height, weight, blood pres-sure, B ultrasonic, electrocardiogram and Chest X-ray and this study mainly used B ultrasonic. The diagnosis of NAFLD was in accordance with the NAFLD diagnos-tic criteria developed by European Association for the
Study of the Liver (EASL) [23,24]. NAFLD diagnosed in this study must has 3 points as follows at the same time:
1) Don’t have the history of drinking or the amount of alcohol< 30 g/d for men and < 20 g/d for women. 2) Despite the population with a history of specific
diseases which can result in NAFLD, including virus hepatitis (HBV and HCV), Wilson disease, haemochromatosis and autoimmune hepatitis. 3) The B ultrasonic shows that excessive hepatic fat
accumulation and the presence of steatosis in >5% of hepatocytes [23].
Laboratory examination
All participants provided blood samples, and 3 tubes of fasting venous blood were collected and were put re-spectively into centrifuge tubes which contained anti-coagulant and no antianti-coagulant. The examined indexes included TG, TC, HDL-C, LDL-C and so on. The 7600– 020 automatic biochemical analyzer which was made by Japan Hitachi Company was used for biochemical test of blood. Triglycerides test kits (1555-40-2009), High density lipoprotein cholesterol test kits (0967-40-2009) and Low density lipoprotein cholesterol test kits (0972-40-2009) which were produced by Shanghai Rongsheng biological pharmaceutical Co., LTD were used to test TG, HDL-C and LDL-C. Total cholesterol test kits (1555-40-2009) which were produced by Shanghai Kehua bio-engineering Co., LTD were used to test TC.
Confirming of the TC/HDL-C ratio
First, the study gave a brief description of physio-logical and biochemical indicators at baseline in the Jinchang Cohort and compared the indicators be-tween NAFLD and non-NAFLD group. Then, under the different levels of TC, HDL-C and TC/HDL-C, the relationships between these indicators and the in-cidence of NALFD were analyzed. After that, based on prospective cohort study, we assessed the effect of these three indicators to the risk of NAFLD. Finally, we analyzed TC/HDL-C, TC, HDL-C and ApoB/ ApoA1 with ROC, and compared the AUC to esti-mate the most valuable indicator.
Table 2Comparison of indexes between NAFLD and normal population(X ± S)
Characteristics Normal(n= 30,095) NAFLD(n= 2026) T P
Age(years) 46.58 ± 13.88 48.36 ± 13.53 −10.32 <0.01
BMI(kg/m2) 23.07 ± 3.12 26.25 ± 4.04 −77.32 <0.01
TC(mmol/L) 4.66 ± 0.89 1.92 ± 0.96 −23.29 <0.01
TG(mmol/L) 1.78 ± 1.39 2.58 ± 1.81 −43.87 <0.01
HDL-C(mmol/L) 1.41 ± 0.36 1.21 ± 0.29 44.92 <0.01
LDL-C(mmol/L) 2.97 ± 0.78 3.08 ± 0.86 −10.93 <0.01
NAFLDNonalcoholic fatty liver,BMIBody Mass Index,TCTotal cholesterol,TG
Triglyceride,HDL-CHigh-density lipoprotein cholesterol,LDL-CLow-density lipoprotein cholesterol
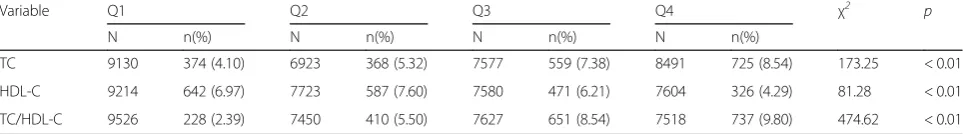
Table 3Different metabolic indexes and the ratios with the incidence of NAFLD
Variable Q1 Q2 Q3 Q4 χ2 p
N n(%) N n(%) N n(%) N n(%)
TC 9130 374 (4.10) 6923 368 (5.32) 7577 559 (7.38) 8491 725 (8.54) 173.25 < 0.01
HDL-C 9214 642 (6.97) 7723 587 (7.60) 7580 471 (6.21) 7604 326 (4.29) 81.28 < 0.01
TC/HDL-C 9526 228 (2.39) 7450 410 (5.50) 7627 651 (8.54) 7518 737 (9.80) 474.62 < 0.01
Statistical analysis
We used SPSS21.0 to conduct the general statistical descrip-tions, to do Student’s t-test to compare the means of differ-ent indicators, and to do Pearson chi-square test to compare the different ratios. Significance was set atα= 0.05. SAS9.3 was used to carry out restricted cubic spline regression (RCS) analysis and the MedCalc 15.8 was used to analyze the data with ROC.
Results
The incidence of NAFLD in the Jinchang cohort
Table 1 shows, the new cases of NAFLD were 2026 during the two years of follow up, and the cumulative incidence of NAFLD was 6.30%. The rate of dyslipidemia was 40.37% in the cohort, including TC 6.85%, TG 35.55%, HDL-C 5.56% and LDL-C 6.54%.
In Table 2, the physiological and biochemical indica-tors of NAFLD had a difference with the control group.
The average age of NAFLD population was 48.36 years old which was higher than the control group and the same with BMI. TC (4.66 mmol/L), TG (2.58 mmol/L), LDL-C (3.08 mmol/L) of NAFLD population were higher than control group, while HDL-C (1.21 mmol/L) was lower than the control group.
The effect of TC, HDL-C and TC/HDL-C to the incidence of NAFLD
Table3 shows the relationships between the quartiles of TC, HDL-C and TC/HDL-C these three indexes with the incidence of NAFLD. With the quartiles of TC and TC/HDL-C raising, the incidence of NAFLD raised as well and the trend had statistical significance. However, the incidence of NAFLD decreased because of the HDL-C′ quartiles raising and the trend had statistical significance as well.
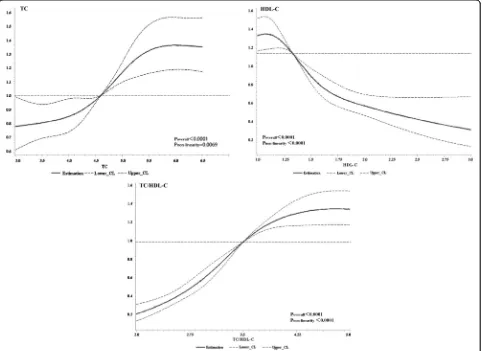
Fig. 2Dose-response relationship of TC, HDL-C, TC/HDL-C and the risk of NAFLD. By using RCS analysis, Cox regression model was applied to evaluate the Hazard Ratio (HR) of NAFLD. After adjusting sex, age, profession and education these possible confounding factors (See details in Additional file1: Table S1), the HR of NAFLD had non-linearity positive relationship with TC/HDL-C (Poverall<0.0001, Pnon-linearity<0.0001)and TC
(Poverall<0.0001, Pnon-linearity= 0.0069), non-linearity negative relationship with HDL-C (Poverall<0.0001, Pnon-linearity<0.0001). HR, Hazards Ratio; TC,
Dose-response relationship of TC, HDL-C, TC/HDL-C and the risk of NAFLD
Figure2showed the results of the relationships between lipid metabolisms and the risk of NAFLD by using RCS analysis. After adjusting the confounding factors (see Additional file 1: Tables S1 and S2), we found TC, HDL-C and their ratio had does-response relationship with the risk of NAFLD (Poverall<0.0001). TC had the positive relationship with NAFLD while HDL-C had the opposite. As for the ratio, TC/HDL-C had the positive relationship with NAFLD.
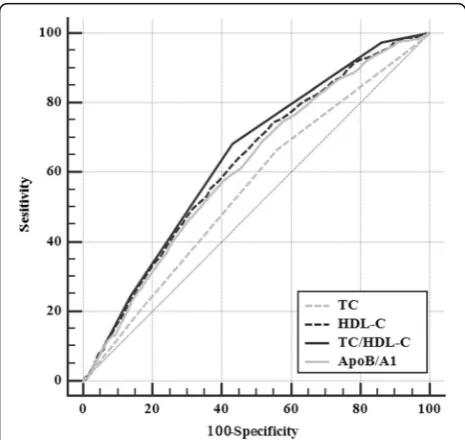
The ROC analysis of the ratio and the risk of NAFLD
Figure 3 was the ROC of TC, HDL-C, TC/HDL-C and ApoB/ApoA1. As the figure showed, the AUC of TC/ HDL-C was greater than TC, HDL-C and ApoB/ApoA1. This indicated that the predictive value of TC/HDL-C was higher than any of these indexes.
Discussion
In this cohort study, we found the cumulative incidence of NAFLD in the Jinchang Cohort was 6.30% after two years following up, and the abnormal rate of serum lipid indexes in the cohort was higher than the control group.
We also found the lipid indexes were associated with in-cidence of NAFLD, especially for TC/HDL-C. The AUC of TC/HDL-C for incident NAFLD was greater than those of TC and HDL-C, and also greater than that of ApoB/ApoA1.
There have been researches showed that low levels of HDL-C was caused by lacking of exercises, obesity and diabetes and all of these three factors were risk factors of NAFLD. Souza has pointed out that low levels of HDL-C was the risk factors of NAFLD [25, 26]. Some studies also mentioned TC was a dangerous factor of NAFLD [27]. Besides, NAFLD severity was associated with the risk of CVD and CHD [28–30], and higher TC/ HDL-C ratio was a predictive factor of CVD and CHD [12,15]. So, we hypothesized that in a way, TC/HDL-C might have connections with NAFLD. This article was based on the large sample prospective cohort to study the predictive value of TC/HDL-C to NAFLD.
The study found that under the different levels of TC, HDL-C and TC/HDL-C, the incidence of NAFLD was different as well in the population. With the levels of TC raising, the incidence of NAFLD raised as well, which was similar to the study conducted by Ballestri [27] However, the levels of HDL-C had the opposite effect with the incidence of NAFLD, and the Framingham Cohort as well as Naim Alkhouri [31,32] had the similar conclusions.
Many studies were the qualitative researches, and few of them did the quantitative researches. So, based on the cohort study, the article conducted a quantitative re-search and found out that TC, HDL-C and their ratio had dose-response relationship with the risk of NAFLD. TC/HDL-C had the positive does-response relationship with NAFLD which was same as TC while HDL-C had the opposite. However, this study wanted to know whether TC/HDL-C had predictive value to NAFLD, so next, the study conducted ROC analysis.
Through ROC analysis, we found TC/HDL-C had bet-ter predictive value than TC and HDL-C. Many studies have already revealed ApoB/ApoA1 was a diagnostic index of NAFLD [33], so we compared the predictive value of TC/HDL-C with it. The study found that both ApoB/ApoA1 and TC/HDL-C had the predictive value of NAFLD, but the results showed that TC/HDL-C was more significant than ApoB/ApoA1. So in Jinchang Co-hort, compared with TC, HDL-C and ApoB/ApoA1, TC/ HDL-C has the best predictive value to NAFLD, and maybe it will be a new index to predict NAFLD.
There are some limitations in our article. First, the article was based on the population survey, which might result in the problem of the individual data ac-curacy. Second, Considering the space of the paper, we did not analyze men and women separately. Last, because of various reasons, we could not test what Fig. 3The ROC of TC, HDL-C, TC/HDL-C and ApoB/ApoA1 for
we found in the vitro experiments. So, we need to ex-plore in the future.
This finding suggested that using TC/HDL-C ratio is helpful for identifying NAFLD, and maybe helpful for CVD and other diseases.
Conclusions
Higher TC/HDL-C ratio is associated with a greater risk for NAFLD. And we find that the ratio has a significant predictive value for NAFLD. However, extensive studies should be carried out for a further instruction.
Additional file
Additional file 1:Table S1.Relative Risk of some factors in normal and NAFLD groups.Table S2.Variable scoring list of Logistic(Cox) regression. (DOCX 26 kb)
Abbreviations
ApoA1:Apolipoprotein A1; ApoB: Apolipoprotein B; AUC: Area under the curve; BMI: Body Mass Index; CVD: Cardiovascular disease; EASL: European Association for the Study of the Liver; HBV: Hepatitis B Virus; HCV: Hepatitis C Virus; HDL-C: High-density lipoprotein cholesterol; hs-CRP: High-sensitivity C-reactive protein; JNMC: Jinchuan Nonferrous Metals Corporation; LDL-C: Low-density lipoprotein cholesterol; NAFLD: Nonalcoholic fatty liver Disease; NHFPC: National Health and Family Planning Committee of China; RCS: Restricted cubic spline regression; ROC: Receiver operator characteristic curve; TC: Total cholesterol; TG: Triglyceride
Acknowledgements
We thank all the study participants and staff of the Worker’s Hospital of the JNMC for their generous work, and the interviewers from the Department of Epidemiology and Health Statistics, School of Public Health, Lanzhou University.
Funding
This work is supported by the Project of Employees Health Status and Disease Burden Trend Study in Jinchuan Nonferrous Metals Corporation (Grant JKB20120013) which was a cooperation project by Lanzhou University and Jinchuan Nonferrous Metals Corporation (JNMC); National Major Special Project of Cancer Screening program in Urban area of China (CanSPUC) supported by the National Health and Family Planning Committee of China (NHFPC, No. CZB20120064).
Availability of data and materials
The datasets used and analyzed during the current study are available from the corresponding author on reasonable request.
Authors’contributions
Ren was responsible for writing articles while Shi was responsible for analyzing the data. Ding, LH and PH were responsible for physical examination and testing. CZ, Yang, He, ZJ and Ma were responsible for data collation and input. LJ, ZY, Zheng, Bai and CN built the Jinchang Cohort. All authors read and approved the final manuscript.
Ethics approval and consent to participate
Consent was obtained from each participant included in the study and the study was approved by the Ethics Committee of JNMC.
Consent for publication
Not applicable.
Competing interests
The authors declare that they have no competing interests.
Publisher’s Note
Springer Nature remains neutral with regard to jurisdictional claims in published maps and institutional affiliations.
Author details
1Key Laboratory of Preclinical Study for New Drugs of Gansu Province, Basic
Medical College, Lanzhou University, Lanzhou, Gansu 730000, People’s Republic of China.2Institute of Epidemiology and Statistics, School of Public Health, Lanzhou University, Lanzhou 730000, Gansu, People’s Republic of China.3Workers’Hospital of Jinchuan Group Co., Ltd., Jinchang, Gansu, China. 4Department of Epidemiology, School of Public Health, Brown University,
City of Providence, RI, USA.5Department of Surgery, School of Medicine, Yale Cancer Center, Yale University, City of New haven, CT, USA.
Received: 20 November 2018 Accepted: 23 January 2019
References
1. Lonardo A, Bellentani S, Argo CK, Ballestri S, Byrne CD, Caldwell SH, et al. Epidemiological modifiers of non-alcoholic fatty liver disease: focus on high-risk groups[J]. Dig Liver Dis. 2015;47(12):997–1006.
2. Byrne CD, Targher G. Ectopic fat, insulin resistance, and nonalcoholic fatty liver disease: implications for cardiovascular disease[J]. Arterioscler Thromb Vasc Biol. 2014;34(6):1155–61.
3. Sattar N, Forrest E, Preiss D. Non-alcoholic fatty liver disease[J]. BMJ. 2014; 349:g4596.
4. Lazo M, Hernaez R, Eberhardt MS, et al. Prevalence of nonalcoholic fatty liver disease in the United States: the third National Health and nutrition examination survey, 1988-1994[J]. Am J Epidemiol. 2013;178(1):38–45. 5. Browning JD, Szczepaniak LS, Dobbins R, et al. Prevalence of hepatic
steatosis in an urban population in the United States: impact of ethnicity[J]. Hepatology. 2004;40(6):1387–95.
6. Preiss D, Sattar N. Non-alcoholic fatty liver disease: an overview of prevalence, diagnosis, pathogenesis and treatment considerations[J]. Clin Sci (Lond). 2008;115(5):141–50.
7. Loomba R, Sanyal AJ. The global NAFLD epidemic[J]. Nat Rev Gastroenterol Hepatol. 2013;10(11):686–90.
8. Choe YG, Jin W, Cho YK, et al. Apolipoprotein B/AI ratio is independently associated with non-alcoholic fatty liver disease in nondiabetic subjects[J]. J Gastroenterol Hepatol. 2013;28(4):678–83.
9. Walldius G, Jungner I. The apoB/apoA-I ratio: a strong, new risk factor for cardiovascular disease and a target for lipid-lowering therapy--a review of the evidence[J]. J Intern Med. 2006;259(5):493–519.
10. Andrikoula M, McDowell IF. The contribution of ApoB and ApoA1 measurements to cardiovascular risk assessment[J]. Diabetes Obes Metab. 2008;10(4):271–8.
11. Ryoo JH, Park SK. Association of apolipoprotein B and incidence of metabolic syndrome in Korean men: a 5-years' follow-up study[J]. Atherosclerosis. 2013;226(2):496–501.
12. Agirbasli M, Tanrikulu A, Acar Sevim B, Azizy M, Bekiroglu N. Total cholesterol-to-density lipoprotein cholesterol ratio predicts high-sensitivity C-reactive protein levels in Turkish children[J]. J Clin Lipidol. 2015; 9(2):195–200.
13. Kappelle PJ, Gansevoort RT, Hillege JL, Wolffenbuttel BH, Dullaart RP. Apolipoprotein B/A-I and total cholesterol/high-density lipoprotein cholesterol ratios both predict cardiovascular events in the general population independently of nonlipid risk factors, albuminuria and C-reactive protein[J]. J Intern Med. 2011;269(2):232–42.
14. Castelli WP. Cardiovascular disease: pathogenesis, epidemiology, and risk among users of oral contraceptives who smoke[J]. Am J Obstet Gynecol. 1999;180(6 Pt 2):S349–56.
15. Davidson MH, Abate N, Ballantyne CM, et al. Ezetimibe/simvastatin compared with atorvastatin or rosuvastatin in lowering to specified levels both LDL-C and each of five other emerging risk factors for coronary heart disease: non-HDL-cholesterol, TC/HDL-C, apolipoprotein B, apo-B/apo-A-I, or C-reactive protein[J]. J Clin Lipidol. 2008;2(6):436–46.
apparently healthy men and women[J]. J Am Coll Cardiol. 2009;55(1):35–41.
17. Qu HM, Bai YN, Cheng N, et al. Trend analysis of Cancer mortality in the Jinchang cohort, China, 2001-2010[J]. Biomed Environ Sci. 2015;28(5):364–9. 18. Ma L, Bai YN, Pu HQ, et al. A retrospective cohort mortality study in
Jinchang, the largest nickel production enterprise in China[J]. Biomed Environ Sci. 2014;27(7):567–71.
19. Yang AM, Bai YN, Pu HQ, et al. Prevalence of metabolic syndrome in Chinese nickel-exposed workers[J]. Biomed Environ Sci. 2014;27(6):475–7. 20. Yang A, Liu S, Cheng N, et al. Multiple metals exposure, elevated blood
glucose and dysglycemia among Chinese occupational workers[J]. J Diabetes Complicat. 2017;31(1):101–7.
21. Bai Y, Yang A, Pu H, et al. Cohort profile: the China metal-exposed workers cohort study (Jinchang cohort)[J]. Int J Epidemiol. 2016.
22. Bai Y, Pu H, Dai M, et al. Study progress on China Jinchang Cohort[J]. Journal of Lanzhou University (Medical Sciences). 2015(06):29–33+8. 23. EASL-EASD-EASO Clinical Practice Guidelines for the management of
non-alcoholic fatty liver disease[J]. J Hepatol . 2016,64(6):1388–402.
24. Bugianesi E, Rosso C, Cortez-Pinto H. How to diagnose NAFLD in 2016[J]. J Hepatol. 2016;65(3):643–4.
25. Frezza M, di Padova C, Pozzato G, Terpin M, Baraona E, Lieber CS. High blood alcohol levels in women. The role of decreased gastric alcohol dehydrogenase activity and first-pass metabolism[J]. N Engl J Med. 1990; 322(2):95–9.
26. Souza MR, Diniz Mde F, Medeiros-Filho JE, Araujo MS. Metabolic syndrome and risk factors for non-alcoholic fatty liver disease[J]. Arq Gastroenterol. 2012;49(1):89–96.
27. Ballestri S, Nascimbeni F, Romagnoli D, Lonardo A. The independent predictors of non-alcoholic steatohepatitis and its individual histological features.: insulin resistance, serum uric acid, metabolic syndrome, alanine aminotransferase and serum total cholesterol are a clue to pathogenesis and candidate targets for treatment[J]. Hepatol Res. 2016;46(11):1074–87. 28. Ahmed MH, Barakat S, Almobarak AO. Nonalcoholic fatty liver disease and
cardiovascular disease: has the time come for cardiologists to be hepatologists?[J]. J Obes. 2012;2012:483135.
29. Lee SH, Yun SJ. Severity of nonalcoholic fatty liver disease on sonography and risk of coronary heart disease[J]; 2017.
30. Gastaldelli A, Kozakova M, Hojlund K, et al. Fatty liver is associated with insulin resistance, risk of coronary heart disease, and early atherosclerosis in a large European population[J]. Hepatology. 2009;49(5):1537–44. 31. Alkhouri N, Eng K, Lopez R, Nobili V. Non-high-density lipoprotein
cholesterol (non-HDL-C) levels in children with nonalcoholic fatty liver disease (NAFLD)[J]. Springerplus. 2014;3:407.
32. Speliotes EK, Massaro JM, Hoffmann U, et al. Fatty liver is associated with dyslipidemia and dysglycemia independent of visceral fat: the Framingham heart study[J]. Hepatology. 2010;51(6):1979–87.