Available Online at www.ijpret.com 1098
INTERNATIONAL JOURNAL OF PURE AND
APPLIED RESEARCH IN ENGINEERING AND
TECHNOLOGY
A PATH FOR HORIZING YOUR INNOVATIVE WORK
IMPLMENTATION OF ZOOM FFT IN ULTRASONIC BLOOD FLOW ANALYSIS
PROF. K. M. PIMPLE1, MISS. RADHIKA R. RAUT2, MISS. KALYANI S. GOSWAMI2, MISS. SONAL
HIRAPURE2
1.Assistant Professor, Department of EXTC, IBSS COE Amravati. 2.Final year EXTC, IBSS COE Amravati, Maharashtra, India.
Accepted Date: 05/03/2015; Published Date: 01/05/2015
\
Abstract:An adequate blood flow supply is necessary for all organs of the body. Analysis of the blood flow finds its importance in the diagnoses of diseases. There are many techniques for analyzing the blood flow. These techniques are not affordable by the poor people because it is highly expensive. So we have implemented a technique called Zoom-FFT.
Keywords: Zoom FFT, Blood Flow
.
Corresponding Author: PROF. K. M. PIMPLE
Access Online On:
www.ijpret.com
How to Cite This Article:
Available Online at www.ijpret.com 1099 INTRODUCTION
Human with his potential tries to get whichever is unexplored, explored, and till now we are managing and succeeding using some technical ways. In the same way this is one of the explorations made for scanning the intra details of some specific objects using ultrasound named SONOGRAPHY, which is used as an alternative to x-ray photography. In this paper, the method to zoom the image or the scanned data-using zoom FFT has been discussed. and its applications, with basics of ultrasound scanning are also explained.
Fast Fourier transform is used to convert frequency to time domain.
It is define as
In zoom FFT technique, blood flow analysis is done by passing a high frequency ultrasonic wave in the blood vessels through a transducer (transmitter) .The reflected signal; from the receiver transducer has a different frequency due to the Doppler principle. This signal is passed to a DSP processor to find the frequency spectrum. Because of the high frequency of the ultrasonic wave, the resolution of the frequency spectrum output will not be good. Therefore we go for advanced Zoom FFT technique, where in a very small frequency change due to the clot formation can be obtained with a good resolution. It can be used to locate the initial presence of a blood clot. All of these tasks must be achieved with a single DSP chip in order for the system to be both cost-effective and power efficient and thus widely accepted.
Zoom FFT is diagnostic tool for the detection of blood clots and other diseases. It is less costly than other techniques. Zoom FFT uses a low frequency to measure blood flow in order to find clots. A transmitter passes an ultrasonic wave through the vessels. A reflected signal is passed to a DSP processor. The process is achieved with one DSP chip in order to keep the costs lower.
Zoom FFT is a process where an input signal is mixed down to baseband and then decimated prior to passing it into a standard FFT.
DOPPLER EFFECT PHENOMENON:
Available Online at www.ijpret.com 1100 when they approach to each other decreasing when they move apart. The velocity of sound in blood 1570m/this concept is applied in ultrasound range in blood flow analysis.
REAL BLOOD FLOW ANALYSIS:
In an ultrasonic blood flow analysis, a beam of ultrasonic energy is directly through a blood vessel. More common are the ultrasonic analyzers based on the Doppler principle. Anoscillator, operating at a frequency of several mega Hertz, excites a piezoelectric. This transducer is coupled to the wall of an exposed blood vessel and sends an ultrasonic beam with a frequency f into flowing blood. A small part of the transmitted energy is scattered back and is received by a second transducer arranged opposite the first as shown in figure (1).
Figure 1: internal view of transducer, transmitter signal and receiver signal
Because the scattering occurs mainly as a result of the moving blood cells. The reflected signal has a different frequency due to a Doppler effect.
OVERVIEW:
Purpose of Zooming:
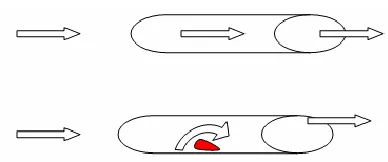
Figure2: shows the frequency variation in blood flow with clot and without clot.
Available Online at www.ijpret.com 1101 which can be easily monitored by this technique.Fig.2.shows the blood flow in a normal blood vessel and the blood vessel with clot formation.
Due to the normal blood flow the frequency F1=f+df, where f is the frequency of the transmitted signal and df is the Doppler frequency of the reflected signal. Due to the blood flow in the blood vessel with clot the frequency F2=f+df+Df, where Df is an extra frequency component, the Doppler frequency due to the clot formation.
BLOCK DIAGRAM OF ZOOM FFT:
WORKING:
Blood flow analysis is done by passing a high frequency ultrasonic wave in the blood vessels through the transducer. The reflected signal from receiver transducer has different frequency due to Doppler principal .This signal is passed to MATLAB input to find the frequency spectrum because of the high frequency of the ultrasonic wave ,resolution of frequency spectrum output will not be good .Therefore, we go for advanced Zoom fft technique, where in a very small frequency change due to the clot formation can be obtained with a good resolution. Now this signal multiply it with sine and cosine then signal is get sampled then passé to FIR filter.This signal prior passed to the FFT and we get zoom output signals.
ADVANTAGES:
The following are the advantages of Zoom FFT Technique.
1. Increased frequency domain resolution
2. Reduced hardware cost and complexity
Available Online at www.ijpret.com 1102 In places where the frequency content has to be analyzed, this zooming FFT can be utilized, mainly for the hidden glitches during signal frequency transition.
APPLICATION:
The following are the applications of Zoom FFT technique.
1.) Ultrasonic blood flow analysis.
2.) RF communications.
3.) Doppler radar.
4.) Bio-medical fields.
5.) Side band analysis, and modulation analysis.
CONCLUSION:
With the zoom fft, we can obtain a very fine frequency resolution of spectral measurement.
These techniques are affordable by the poor people because of their low expense. So we have implemented a technique called Zoom-FFT.
This technique is simple and affordable to detect the blood clots and other diseases.
Thus we get high frequency resolution output in order to analyze it any blood clots or damage in blood flow.
REFERENCES:
1. Leslie Cromwell, Erich A. Pfeiffer, Fred J.Wiebell, “Biomedical Instrumentation and
Measurements”, Prentice Hall,1980.
2. Willis J. Tompkins, “Biomedical Digital Signal processing”, Prentice Hall of India Pvt Ltd, 2001.
3. John G. Proakis and Dimitris G. Manolakis, “Digital signal Processing”, Prentice Hall of India
Pvt Ltd, 2000.
4. N. Sarkar, “Elements of Digital Signal Processing”, Khanna Publishers, 2000.
Available Online at www.ijpret.com 1103