3401
ANALYTICAL METHOD DEVELOPMENT AND VALIDATION FOR
SIMULTA-NEOUS DETERMINATION OF LEDIPASVIR AND SOFOSBUVIR IN TABLET
DOSAGE FORM BY RP-HPLC
K. Yogendrachari*, M. Madhu, E. Gireesh Kumar, M.Vasantha kumari, M. Chanti Naik
Department of Pharmaceutical Analysis & Quality Assurance,
Annamacharya College of Pharmacy, New Boyanpalli, Rajampet-516115, Kadapa(Dt), A.P.
E- mail: [email protected]
ARTICLE INFO
ABSTRACT
Key words:
Ledipasvir Sofosbuvir, RP-HPLC, Gradient elution,
Validation, ICH guidelines
A new Reverse Phase High Performance Liquid chromatographic method was developed for the quantification of Ledipasvir and Sofosbuvir. The chromatographic separation was achieved on a Waters 2695, Inertsil -ODS C18 (250 x 4.6 mm, 5 µ) column within a runtime of 10 min under gradient elution Acetonitrile and methanol at a flow rate of 1.0ml/min. A photodiode array (PDA) detector set at 254nm was used for detection. The method was validated according to the ICH guidelines with respect to spec-ificity, precision, accuracy and linearity. The proposed method was found to be reproducible and convenient for quantitative analysis of Ledipasvir and Sofosbuvir, in bulk and tablet dosage form.
INTRODUCTION
Pharmaceutical Analysis plays a vital role in quality assurance and quality control of bulk drugs and their formulations. Pharmaceu-tical analysis is a particular branch of analyPharmaceu-tical chemistry, which includes isolating, identifying and determining the relative amounts of com-pounds in a sample matter1. It is concerned with chemical characterization of matter both quantitative and qualitative. In recent years many analytical techniques have been devel-oped.2,3 Pharmaceutical analysis derives its principles from different branches of science like Chemistry, Physics, Microbiology, Nuclear Science, Electronics etc. analytical method is a particular utilization of a procedure to solve a problem. Analytical instrumentation assumes an imperative part in the production and eval-uation of new products and protection of
Consumers and the environment4. This instru-mentation provides the lower detection limits required to assure safe foods, medications, wa-ter and air5. Methods are developed for new products when no official methods are availa-ble. Alternate methods for existing (non-Pharmacopoeial) products are developed to re-duce the cost and time for better precision and ruggedness6,7. Trial runs are conducted, method is optimized and validated. When alternate method proposed is intended to replace the ex-isting procedure comparative laboratory data including merit / demerits are made available8. Validation of an analytical method is the pro-cess by which it is established, by laboratory studies, that the performance characteristics of the method meet the requirements for the in-tended analytical applications.9
Journal of Global Trends in Pharmaceutical Sciences
3402 There are two important reasons for validating
assays in the pharmaceutical industry. The first, and by for the most important, is that assay val-idation is an integral part of the quality-control system. The second is that current good manu-facturing practice regulation requires assay val-idation10.
F F N HN N O HN H3CO
O N HN N O NH OCH3 O Ledipasvir structure O P HN O O O O O HO F N NH O O Sofasbuvir structure
Materials and Methods:
All chemicals and reagents used were of high quality, purity procured from various sources, Acetonitrile, Methanol Merck (HPLC-Grade), Ledipasvir and Sofosbuvir Reputed pharmaceutical company, Ledipasvir and Sofosbuvir tablets containing 90/400mg, are Purchased from local market Waters -2690/5, HPLC series with PDA, Inertsil -C18, BDS column, Detector wavelength 254nm, Colum Température is ambiant The Optimized chro-matographic conditions are listed in Table No 1 Preparation of Ledipasvir Standard Solu-tion:
Weigh down 10mg of Ledipasvir is dis-solved in 10ml of Mobile phase taken in to 10ml of volumetric flask and sonicated for 20 minutes to get 1000ppm and 1 ml was taken
from the solution into a 10ml volumetric flask and diluted to 10 ml with mobile phase.
Preparation of Sofosbuvir Standard Solu-tion:
Weigh down 10mg’s of Sofosbuvir and dissolved in 10ml of Mobile phase taken in to 10ml of volumetric flask and sonicated for 20 minutes to get 1000ppm and 1 ml was taken from the solution into a 10ml volumetric flask and diluted to 10 ml with mobile phase.
Validation of the Method
The method was validated in terms of system precision, linearity, precision, and spec-ificity of the sample applications. The linearity of the method was investigated with correlation coefficient of Ledipasvir and Sofosbuvir was found to be 0.999 Precision was found to be lower than 1%. Ruggedness of the proposed method was determined by analysis of aliquots from homogenous slot by different analysts using similar operational and environmental
conditions, Placebo interference Sample was
prepared by taking the placebo equivalent to about the weight in portion of test preparation as per the test method and blank interference mobile phase was prepared and injected and into the HPLC system, are in Fig No: 1-3 Accuracy
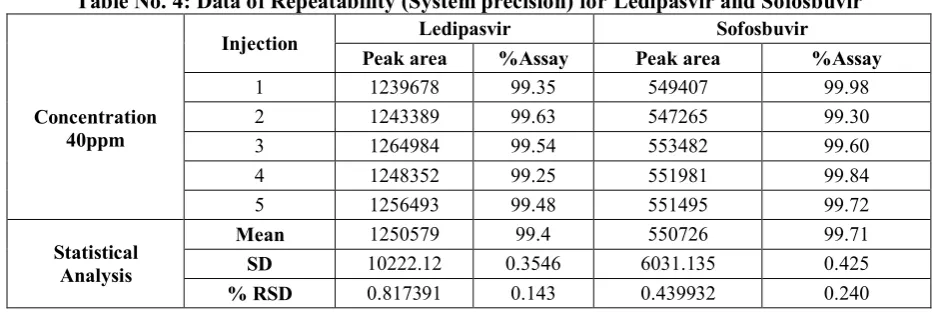
Accuracy of the method was expressed in terms of recovery of added compound at 50%, 100% and 150% level of sample. Mean % recovery and % RSD were calculated and were summarized in Table 2-3.The result shown that best recoveries (99.77±0.04) of the spiked drug were obtained at each added concentration, in-dicating that the method was accurate.
Repeatability
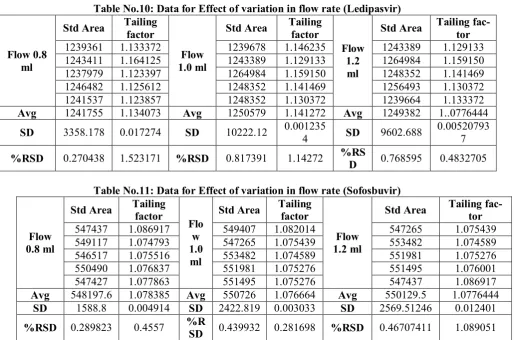
The % Relative standard deviations of Ledipasvir and Sofosbuvir for Repeatability was found to be 0.143and 0.240.Hence the %RSD values indicate a good degree of preci-sion within the specified range. The results are tabulated in Table No 4
Method precision
3403 Fig No.1: Placebo chromatogram
Fig No.2: Blank chromatogram
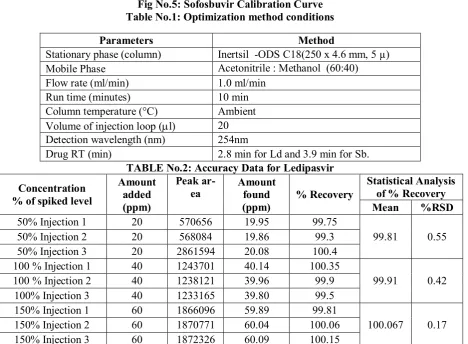
Fig No.3: chromatogram of Ledipasvir and Sofosbuvir
3404 Fig No.5: Sofosbuvir Calibration Curve
Table No.1: Optimization method conditions
Parameters Method
Stationary phase (column) Inertsil -ODS C18(250 x 4.6 mm, 5 µ)
Mobile Phase Acetonitrile : Methanol (60:40)
Flow rate (ml/min) 1.0 ml/min
Run time (minutes) 10 min
Column temperature (°C) Ambient
Volume of injection loop (l) 20
Detection wavelength (nm) 254nm
Drug RT (min) 2.8 min for Ld and 3.9 min for Sb.
TABLE No.2: Accuracy Data for Ledipasvir
Concentration % of spiked level
Amount added (ppm)
Peak
ar-ea Amount found (ppm)
% Recovery
Statistical Analysis of % Recovery
Mean %RSD
50% Injection 1 20 570656 19.95 99.75
99.81 0.55
50% Injection 2 20 568084 19.86 99.3
50% Injection 3 20 2861594 20.08 100.4
100 % Injection 1 40 1243701 40.14 100.35
99.91 0.42
100 % Injection 2 40 1238121 39.96 99.9
100% Injection 3 40 1233165 39.80 99.5
150% Injection 1 60 1866096 59.89 99.81
100.067 0.17
150% Injection 2 60 1870771 60.04 100.06
150% Injection 3 60 1872326 60.09 100.15
Table No.3: Accuracy data for Sofosbuvir
Concentration % of spiked level
Amount add-ed (ppm)
Peak area Amount found
(ppm) % Recovery
Statistical Analysis of % Recovery MEAN %RSD
50% Injection 1 20 259435 19.98 99.9
99.9 0.20
50% Injection 2 20 258914 19.94 99.7
50% Injection 3 20 259956 20.02 100.1
100 % Injection 1 40 565450 39.86 99.65
99.9 0.23
100 % Injection 2 40 568145 40.05 100.125
100% Injection 3 40 567151 39.98 99.95
150% Injection 1 60 864036 59.90 99.83
99.93 0.10
150% Injection 2 60 865044 59.97 99.95
3405 Table No. 4: Data of Repeatability (System precision) forLedipasvir and Sofosbuvir
Concentration 40ppm
Injection Ledipasvir Sofosbuvir
Peak area %Assay Peak area %Assay
1 1239678 99.35 549407 99.98
2 1243389 99.63 547265 99.30
3 1264984 99.54 553482 99.60
4 1248352 99.25 551981 99.84
5 1256493 99.48 551495 99.72
Statistical Analysis
Mean 1250579 99.4 550726 99.71
SD 10222.12 0.3546 6031.135 0.425
% RSD 0.817391 0.143 0.439932 0.240
Table No.5: Data of Repeatability (Method Precision) forLedipasvir and Sofosbuvir
Concentration 40ppm
Injection Ledipasvir Sofosbuvir
Peak area %Assay Peak area %Assay
1 1243389 98.6 547265 98.55
2 1264984 99.02 553782 98.88
3 1248352 98.12 551981 99.40
4 1256493 98.31 551495 99.30
5 1239664 98.81 547437 100.53
6 1243411 98.36 549117 98.28
Statistical Analysis
Mean 1250579 98.48 550726 99.278
SD 10222.12 0.352647 2422.819 0.827236
% RSD 0.817391 0.35 0.439932 0.83
Table No.6: Data of Intermediate precision Ledipasvir and Sofosbuvir
Concentration 40ppm
Injection Ledipasvir Sofosbuvir
Peak area %Assay Peak area %Assay
1 1239364 99.78 547437 99.99
2 1243411 99.95 549117 99.66
3 1237979 100.00 546517 101.53
4 1246482 98.55 550490 99.98
5 1241537 99.91 547427 99.97
6 1237979 99.38 549117 101.10
Statistical Analysis
Mean 1241755 99.86 548197.6 100.37
SD 3358.178 1.105 1588.8 0.75354
% RSD 0.2704 0.85 0.270438 0.75
Table No.7: Data of linearity (Ledipasvir)
Concentration (ppm) Average Area Statistical Analysis
0 0
Slope y-Intercept
Correlation Coefficient
32226 44792 0.999
20 572087
30 887800
40 1239364
50 1570861
60 1869524
70 2234112
3406
Table No.8: Data of linearity (Sofosbuvir)
Concentration (ppm) Average Area Statistical Analysis
0 0
Slope y-Intercept
Correlation Coefficient
14792 19692 0.999
20 259695
30 418090
40 567437
50 715694
60 865479
70 1022457
80 1170855
Table No.9: Data of system to system variability
Table No.10: Data for Effect of variation in flow rate (Ledipasvir)
Flow 0.8 ml
Std Area Tailing factor
Flow 1.0 ml
Std Area Tailing factor
Flow 1.2 ml
Std Area Tailing fac-tor
1239361 1.133372 1239678 1.146235 1243389 1.129133
1243411 1.164125 1243389 1.129133 1264984 1.159150
1237979 1.123397 1264984 1.159150 1248352 1.141469
1246482 1.125612 1248352 1.141469 1256493 1.130372
1241537 1.123857 1248352 1.130372 1239664 1.133372
Avg 1241755 1.134073 Avg 1250579 1.141272 Avg 1249382 1..0776444
SD 3358.178 0.017274 SD 10222.12 0.001235
4 SD 9602.688
0.00520793 7 %RSD 0.270438 1.523171 %RSD 0.817391 1.14272 %RSD 0.768595 0.4832705
Table No.11: Data for Effect of variation in flow rate (Sofosbuvir)
Flow 0.8 ml
Std Area Tailing factor
Flo w 1.0 ml
Std Area Tailing factor
Flow 1.2 ml
Std Area Tailing fac-tor
547437 1.086917 549407 1.082014 547265 1.075439
549117 1.074793 547265 1.075439 553482 1.074589
546517 1.075516 553482 1.074589 551981 1.075276
550490 1.076837 551981 1.075276 551495 1.076001
547427 1.077863 551495 1.075276 547437 1.086917
Avg 548197.6 1.078385 Avg 550726 1.076664 Avg 550129.5 1.0776444
SD 1588.8 0.004914 SD 2422.819 0.003033 SD 2569.51246 0.012401
%RSD 0.289823 0.4557 %R
SD 0.439932 0.281698 %RSD 0.46707411 1.089051
S. no. Ledipasvir Sofosbuvir
Peak area Assay % Peak area Assay %
1 1243389 99.98 547265 99.35
2 1264984 99.30 553482 99.63
3 1248352 99.60 551981 99.54
4 1256493 99.84 551495 99.25
5 1239664 99.72 547437 99.48
6 1243411 98.89 549117 99.56
Mean 1249382 99.71 550129.5 99.46
3407 Intermediate precession:
The % Relative standard deviations of Ledipasvir and Sofosbuvir for Intermediate precession was found to be 0.85 and 0.75.Hence the %RSD values indicate a good degree of precision within the specified range. The results are tabulated in Table No 6.
System Precision Ruggedness
The standard and sample solutions pre-pared by analyst-1 and analyst-2 are injected in different HPLC systems, on different day, using a different column. The system suitability pa-rameters calculated by analyst -2 can be com-pared with those of Analyst -1. The results were tabulated in Table 9. These results indi-cated that the developed method is rugged.
Linearity
The linearity range of Ledipasvir and Sofosbuvir was evaluated by varying concen-trations of standard solutions were injected into HPLC system. The linearity graph was plotted from (Fig: 4-5). A calibration curve was con-structed for each sample by plotting the peak area obtained the concentration. The correlation coefficient for the data was calculated as 0.999. The regression line were observed to be in the form of y = 32226x - 44792. The linearity data for Ledipasvir.The regression line were ob-served to be in the form of y = 14792x - 19692 and Sofosbuvir are presented in Table 7-8.
Robustness
Small changes in flow rate, composi-tion of mobile phase and temperature, per-formed the robustness of method. Robustness was studied using three replicates of concentra-tion level at 100%. The % RSD in robustness study was less than 2%, his indicates that the method is precise, accurate and robust, the re-sults are tabulated in 10-11.
CONCLUSION
The present proposed RP-HPLC meth-od for the assay of Ledipasvir and Sofosbuvir in tablet formulation was validated as per ICH Q2(R1) guideline and it meets to specific ac-ceptance criteria. It is concluded that the devel-oped method was specific, precise, linear, accu-rate, robust, cost effective and it proves all val-idation characteristics and it can be effectively
applied for routine analysis in research institu-tions, quality control department in industries.
ACKNOWLEDGEMENT
The authors thank Sri. C. Gangi Reddy, Founder, Annamacharya Educational Trust for providing all the facilities for graduate studies and dissertation work.They also thank Reputed pharmaceutical company (P) Ltd. (India), for providing the gift sample of standard Ledipas-vir and SofosbuLedipas-vir.
REFERENCES
1. Fundamentals of Analytical Chemistry, 8th Edn., Skog, West, Holler, Crouch, BBN Printers, Haryana, India. 2007
2. Quantitative Analysis, RA. Day, AL. Underwood, 6th Edn., Prentice Hall of India, New Delhi, 2005.
3. Pharmaceutical Drug Analysis, 2nd Edn., New Age International (P) Ltd, New Delhi, India, 2005.
4. Furmiss BS, Nash RA. Vogel’s Text
Book of Practical Organic Chemistry, 5th edition. London: Lonman group LTD, 1989, pp. 165-169.
5. Remington, the Science & Practice of Pharmacy Vol. I, 20th Edition. B.I. publication pvt. Ltd, pp. 587-613.
6. ICH Guideline on Impurities in New
Drug Products; Q3B (R2), 2006.
7. ICH Guideline on Validation of
Ana-lytical Procedures: Text and Methodol-ogy; Q2 (R1), 2005.
8. Collier, Development and application of a validated HPLC method for the anal-ysis of dissolution samples of
levothy-roxine sodium drug products. JPBA,
54, 2011, 433-438.
9. Thompson M, Harmonized guidelines for single-laboratory validation of methods of analysis - IUPAC tech-nical report. PAC, 74,2002, 835-855.
10. Jenke DR. Chromatographic method validation: A review of current practic-es and procedurpractic-es. Part II. Guidelinpractic-es for primary validation parameters.