AGRONOMY AND SOILS
Estimating Defoliation of Two Distinct Cotton Types Using Reflectance Data
Glen L. Ritchie*, and Craig W. Bednarz
G.L. Ritchie and C. W. Bednarz, Department of Crop and Soil Sciences, University of Georgia Coastal Plain Experiment Station, P.O. Box 748, Tifton, GA 31793-0748
*Corresponding author: [email protected] ABSTRACT
Cotton defoliation is an important part of cot-ton harvest preparation. Visual estimates of cotcot-ton defoliation allow producers to monitor harvest readiness and make further defoliation decisions as necessary, but visual estimates are subjective and may differ from one reviewer to the next. In this manuscript, a spectrometric method for quantifying cotton defoliation is proposed. In 2003 and 2004, leaf area index (LAI) was monitored in multiple environments on 0.91 m sections of row to quantify percentage defoliation. Reflectance over each plot was measured using a narrow-band spectrometer, and normalized difference vegeta-tion index (NDVI) models composed of reflectance at all wavelengths were regressed against LAI to determine which wavelengths most accurately estimated changes in LAI. Both linear and qua-dratic models were tested for their usefulness in estimating LAI. Quadratic models more accurately estimated LAI in the red spectral region than lin-ear models, but reached a maximum LAI value of about 1.5. Therefore, the quadratic models were of limited usefulness. At the red edge (about 705 nm to 720 nm), the quadratic and linear models had similar coefficients of determination, which were higher than those derived from linear models in other wavelengths. These results suggest that re-flectance indices based on red edge measurements can offer accurate, consistent defoliation estimates, and could potentially increase defoliation efficiency and decrease costs.
C
otton producers chemically defoliate their crop to terminate its growth and prepare it for machine harvest. Defoliation gives the producer some control over harvest timing and increases harvest efficiency, but cotton cultivar and growingconditions influence the effectiveness of defoliants. Some conditions require two applications for proper defoliation, especially on irrigated cotton. The timing of the second application is generally based on the effectiveness of the first application, and most defoliation estimates are based on visual observations. Although estimates allow cotton producers to determine the success of their strategy and decide on further management strategies, visual estimates are subjective and therefore can vary. Remote sensing can automate and standardize these estimates (Yang et al., 2003).
Cameras and spectrometers estimate plant health and growth by measuring reflected radiation at vis-ible and near-infrared wavelengths. Plant reflectance is well-characterized, and most of the reflectance characteristics are based on the spectral properties of chlorophylls and carotenoids (Sims and Gamon, 2002). Chlorophylls exhibit strong absorption of blue and red light, while carotenoids primarily absorb blue light (Gitelson, 2002). In green plants, chlorophyll absorbance dominates leaf reflectance. Green leaves reflect little visible radiation because of the heavy absorbance of red and blue radiation by chlorophyll, but they reflect large portions of near-infrared radia-tion (Fig. 1). The red edge forms a boundary between the visible and near-infrared and is a region of rapidly increasing reflectance with wavelength. In contrast, soil reflectance tends to slope gently upward from the visible to the near-infrared.
Wavelength (nm)
400 500 600 700 800 900
R
e
fl
e
c
ta
n
c
e
0.0 0.1 0.2 0.3 0.4 0.5
Blue Green Red
Near-Infrared Red
Edge
Soil
Cotton Leaf
Assuming atmospheric effects are minimized, three factors that affect the reflectance of a cotton crop at each location in a field are soil reflectance, the chlorophyll density in each leaf, and the leaf area. Spectral indices maximize the spectral contribution from vegetation and minimize the effects of soil re-flectance, usually through visible and near-infrared reflectance ratios (huete et al., 1985; major et al., 1990). These indices accurately estimate percentage plant ground cover (the fraction of soil covered by plants) or leaf area index (LAI; m2 leaf area / m2
ground area) in many crops, because reflectance is highly correlated with leaf area, even if plants are nitrogen- or water-stressed (Ritchie, 2003).
The normalized difference vegetation index (nDVI) is widely used to estimate LAI. The nDVI consists of a normalized ratio of reflectance at a wavelength of interest and a reference wavelength as follows:
(λreference – λinterest)/ (λreference + λinterest),
where λ is the wavelength. The reference wavelength is often (but not always) in the near-infrared portion of the spectrum, since the near-infrared reflectance is not affected by chlorophyll (Curran, 1989). One commonly used version of the nDVI uses red reflectance as the wavelength of interest, but ratios that include other wavelengths often estimate chlorophyll content more closely than red (Gitelson and merzlyak, 1997).
Although defoliation estimates should be simi-lar to general ground cover estimates, there are few reports in the literature using this technology for estimating defoliation. Yang et al. (2003) tested airborne color-infrared digital images obtained from an airplane as one method for estimating the success of several defoliation regimes. The study focused on differentiating treatments rather than estimating LAI, and leaf area data were collected only at the conclusion of their study. The research showed that differences in level of defoliation can be identified by remote sensing, but they did not quantify these differences.
The purpose of this study was two-fold. The first goal was to quantify defoliation level based on reflectance data and identify the spectral regions that most appropriately estimate LAI before and during the defoliation process. The second was to compare LAI estimates using nDVI with human defoliation estimates.
MATERIALS AND METHODS
Studies were conducted in four cotton fields at three locations (Coastal Plain Experiment Station Ponder Farm, Gibbs Farm, and a locally rented field called the Water Tower Field) in 2003. All three loca-tions are in Tift County, Georgia. The Water Tower Field was planted with Deltapine 555 BG/RR (DPL 555B/R; Delta Pine and Land, Co.; Scott, mS) cot-ton with rows running east to west. One field at the Ponder Farm was planted with DPL 555 B/R cotton with rows running north and south, and another one was planted with Stoneville 4892 BG/RR (STV 4892B/R; Stoneville Pedigreed Seed, Co.; mem-phis, Tn) cotton with rows running north to south. The Gibbs Farm field was planted with STV 4892 B/R cotton with rows running east to west. The soil series for all three fields is a Tifton loamy sand (fine-loamy, kaolinitic, thermic Plinthic Kandiudults). A comprehensive defoliation treatment of 110 g ha-1 thidiazuron (Dropp SC; Bayer Cropscience;
Research Triangle Park, nC), 1.5 L ha-1 ethephon
(Prep; Bayer Cropscience), and 0.44 L ha-1 tribufos
(Def 6; Bayer Cropscience) was applied when 75% of the cotton bolls were open. In this study, before defoliant was applied the cotton LAI ranged from 1.0 (sparse cotton) to slightly over 2.0 (rank cotton). Reflectance was measured at each field prior to de-foliant application, then at 1 to 3 d intervals until the plants were completely defoliated. The cotton was sampled on four dates in the Water Tower Field, and on three dates in the other fields.
Four plots were chosen at random on each sampling date at each site. Plots were marked us-ing bicycle flags prior to samplus-ing. Reflectance was measured at 1 m above the center of the row at each plot using a PAR/nIR spectrometer (Apogee Instru-ments; Logan, UT) with a fiber optic cable with a 30° full angle field of view. Two sample readings were recorded from 0.91 m (3 ft) of row and averaged to give an estimate of LAI. Leaves were then removed from the plants in the 0.91 m of row, and leaf area was measured with a leaf area meter (model LI-3100C, LI-COR Environmental; Lincoln, nE).
Redmond, WA). Data sets were analyzed for each field, and then pooled to determine an overall model that would be most appropriate for estimating LAI.
In 2004, four human volunteers estimated defo-liation rate at the Gibbs farm in a field of DPL555 B/R at sixteen places in the field with different levels of defoliation on three dates, and these estimates were regressed against LAI. The volunteers each had at least two years of experience estimating cot-ton defoliation and five or more years of experience estimating leaf area. Prior to the volunteers making their estimates, one of the volunteers was invited to estimate the percentage defoliation at both low and high LAI to allow all of the volunteers to base defoliation estimates from the same general scale. The nDVI was also regressed against LAI to verify the accuracy of the model determined in 2003, as well as compare nDVI with human observation for determining percentage defoliation.
RESULTS AND DISCUSSION
The correlation or goodness of fit was based on the coefficient of determination (r2) of nDVI vs.
LAI. The coefficient of determination is a measure of the fraction of variance of the dependent variable that is explained by the independent variable. LAI was chosen as the independent variable, although for linear equations with one x and one y variable, the coefficient of determination does not change based on which is the independent variable.
A comparison between nDVI and LAI for all wavelengths for the pooled data from 2003 indi-cated the best correlations existed when one of the wavelengths was between 750 and 850 nm and other wavelength was between 700 and 715 nm (Fig. 2). The correlations showed the same trend regardless of which wavelength was designated λ1 and which
was designated λ2, because reversing λ1 and λ2
merely gives positive and negative values of the same number. The best correlations also were ob-tained in relationships to visible wavelengths when part of the nDVI included a wavelength between 750 and 850 nm. Tarpley et al. (2000) and Read et al. (2002) observed similar trends in nitrogen estima-tion at both the cotton leaf and canopy levels. Leaf nitrogen content and LAI are both closely related to chlorophyll content, so it is reasonable that the same trends are observed for studies of both LAI and nitrogen content. It is useful to note that even with the potentially confounding influence of leaf
chlorophyll content in plants approaching the end of their life cycle, high correlations were observed between LAI and nDVI.
Fig. 2. Coefficient of determination (r2) for the relationships between LAI and two-band combinations in the NDVI equation (λ2 - λ1)/(λ2 + λ1) during the 2003 season. Com-binations of wavelengths at the red edge (700-715 nm) and near-infrared (750-850 nm) regions of the spectrum had highest r2 values.
L1(nm)
400 450 500 550 600 650 700 750 800 850 L2 (n m ) 400 450 500 550 600 650 700 750 800 850 < 0.500 0.500 - 0.525 0.525 - 0.550 0.500 - 0.575 0.575 - 0.600 0.600 - 0.625 0.625 - 0.650 0.650 - 0.675 0.675 - 0.700 0.700 - 0.725 0.725 - 0.750 0.750 - 0.775 0.775 - 0.800 > 0.800
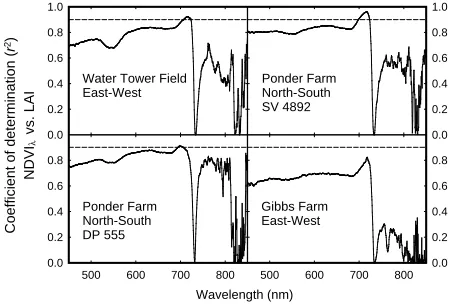
high correlation between LAI and nDVI was observed at each test site, with the highest r2 between
reflectance indices and LAI for each field ranging from 0.82 to 0.96 for individual fields and 0.83 for the pooled data (Fig. 3). All fields except the Gibbs field had maximum r2 values above 0.90.
0.0 0.2 0.4 0.6 0.8 1.0
500 600 700 800
0.0 0.2 0.4 0.6 0.8 0.0 0.2 0.4 0.6 0.8 1.0 Wavelength (nm)
500 600 700 800 0.0
0.2 0.4 0.6 0.8 Water Tower Field
East-West Ponder Farm North-South DP 555 Ponder Farm North-South SV 4892 Gibbs Farm East-West C oe ffi ci en to fd et er m in at io n ( r 2) N D V IL vs .L A I
Fig. 3. Coefficient of determination (r2) of NDVI by wave-length of interest (λ) for each field in the 2003 defoliation trial. The reference wavelength (λ1) was an average of reflectance between 800 to 850 nm, and the wavelength of interest (λ2) appears on the horizontal axis. The dashed line represents an r2 of 0.90.
As observed in Fig. 2, correlations between nDVI and LAI were wavelength dependent. In Fig. 3, LAI had a higher linear correlation with nDVI values calculated from the red edge (highest r2 =
green (highest r2 = 0.73) and red spectral regions
(highest r2 = 0.79).
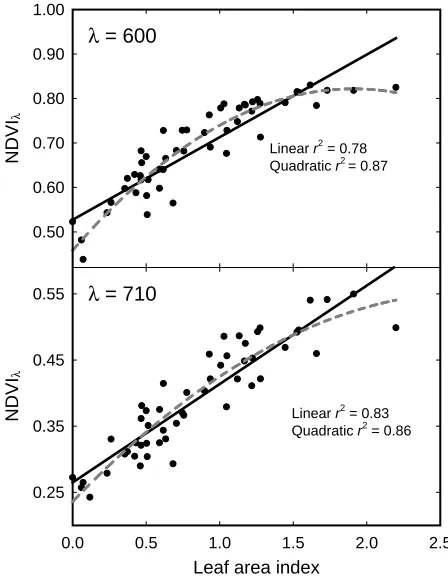
Quadratic LAI estimates had higher r2 values in
the green and red spectral regions than linear esti-mates, and were similar to the quadratic estimates at the red edge (Fig. 4). A notable difference between quadratic LAI estimates derived from the red region and those at the red edge was the range of the qua-dratic model. The high coefficients of determination (r2) for the quadratic models based on the red
wave-lengths were misleading, because the curves became asymptotic at the highest LAI (Fig. 5). The result for each of these wavelengths was a curve with a high r2, but little usefulness above a certain LAI. As
shown in Fig. 6, the quadratic model derived from red edge data gave a higher leaf area estimate at high ground cover levels and a lower leaf area estimate at low levels of ground cover than the quadratic model derived from the red region. This difference suggests that red edge model is superior to the red model over the full range of LAI encountered in this study.
tance measurements. In a single leaf, chlorophyll absorbance saturates at low leaf chlorophyll content, because the sensor views only the leaf. Conversely, cotton canopy LAI estimates are relatively unaffected
Fig. 4. Coefficient of determination (r2) vs. wavelength for linear (gray line) and quadratic (black line) relationships of cotton canopy reflectance with leaf area index from the 2003 study. Coefficients were derived at each wavelength for 51 leaf area samples.
Wavelength (nm)
400 500 600 700 800
0.0 0.2 0.4 0.6 0.8 1.0
Quadratic (y =BBxBx2
Linear (y =BBx
C
oe
ffi
ci
en
to
fd
et
er
m
in
at
io
n
(
r
2)
N
D
V
IL
vs
.L
A
I
0.50 0.60 0.70 0.80 0.90 1.00
L= 600
Leaf area index
0.0 0.5 1.0 1.5 2.0 2.5
N
D
V
IL
N
D
V
IL
0.25 0.35 0.45
0.55 L= 710
Linearr2= 0.78
Quadraticr2= 0.87
Linearr2= 0.83
Quadraticr2= 0.86
Carter and Spiering (2002) noted that vegetation indices and chlorophyll content in single intact leaves had maximum r2 values at the red edge, which are
similar to results from our field study. They observed that r2 values in green were comparable with values
at the red edge, while those in the red were very low. In contrast, we observed that r2 values based
on ratios of green reflectance were lower than those based on the red and the red edge portions. Part of this apparent contradiction can be explained by the difference in single leaf and plant canopy
reflec-Fig. 5. Comparing the fit of linear (solid line) and quadratic (dashed line) equations for NDVI vs. leaf area index at 600 nm and 710 nm. NDVI based on a wavelength in the red region reached a maximum at a LAI of about 1.5, while NDVI based on a wavelength at the red edge continued to slope upward at higher LAI levels.
Wavelength
500 550 600 650 700 750 800
M
ax
im
um
es
tim
at
ed
LA
I
0.0 0.5 1.0 1.5 2.0 2.5
M
in
im
um
es
tim
at
ed
LA
I
0.0 0.1 0.2 0.3 0.4 0.5 0.6
Minimum LAI Estimated by Polynomial Model Maximum LAI Estimated by Polynomial Model
by leaf chlorophyll content. Instead, the dominant factor is the suppression of ground reflectance and the emergence of leaf reflectance in a scene with increasing LAI. This increases the dynamic range of ratios that use red reflectance, so they can cover a moderate range of LAI. This study suggests that the ratios that include the red edge cover a wider dynamic range than those based on red reflectance, even when viewing an entire cotton canopy. It is unclear why green reflectance does not indicate LAI as well as red reflectance.
The 2004 spectral estimates of LAI were con-sistent with the 2003 findings. The highest linear r2
between nDVI and LAI was 0.90 and occurred at about 710 nm. The pooled data for 2003 and 2004 also showed the same trend, with the highest r2 value
of 0.83 occurring at about 710 nm. This high cor-relation value using data from two cropping seasons and two cotton cultivars suggests that nDVI using a reference wavelength of 710 nm can provide a stable, consistent method for estimating LAI during the process of defoliation.
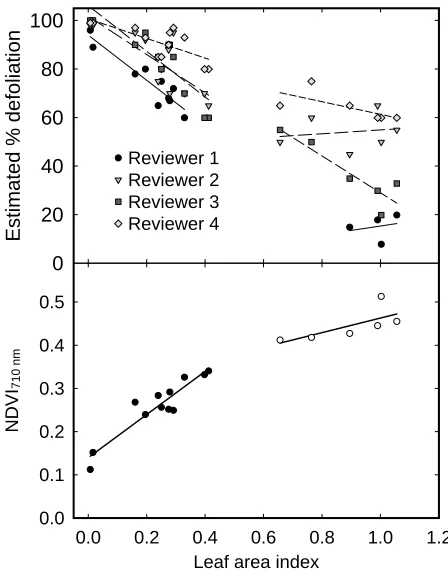
Estimates of percentage defoliation by human reviewers yielded r2 values with LAI for each
per-son, but estimates of percentage defoliation among people varied widely, especially at higher LAI (Fig. 7). General estimates of percentage defoliation showed good correlation with LAI when compared to all LAI values, with r2 values ranging from 0.73
to 0.96 (Table 1). Table 1 shows that coefficients of determination at low LAI (<0.5) also tended to be high, ranging from 0.55 to 0.87, but estimates of defoliation at LAI greater than 0.5 revealed some of the inherent weaknesses in human defoliation ratings. One of the reviewers reported defoliation values that did not show a significant correlation with LAI (reviewer 2; r2 = 0.03), and one reviewer
reported defoliation values that had an upward trend rather than downward with LAI (reviewer 1; slope = 18.2). Two of the reviewers estimated defoliation
with r2 values similar to those of the nDVI method
at both high and low LAI. Both of these reviewers reported defoliation values that had r2 values above
0.48 (reviewer 3, r2 = 0.81; reviewer 4, r2 = 0.48) and
similar slopes at both low and high LAI.
Table 1. Comparison of LAI estimates at low (LAI < 0.5) and high (LAI > 0.5) LAI levels based on coefficient of determina-tion (r2) and slope for NDVI based on a reference wavelength of 710 nm (NDVI
710 nm) and four reviewers
Reviewer (all LAI)r2 (LAI<0.5)r2 (LAI<0.5)Slope (LAI>0.5)r2 (LAI>0.5)Slope
NDVI710nm 0.90 0.87 0.50 0.50 0.17
1 0.96 0.87 -92.8 0.54 18.2
2 0.73 0.64 -78.9 0.03 7.86
3 0.94 0.76 -94.1 0.81 -75.7
4 0.90 0.55 -40.4 0.48 -26.0
Reviewer 1 Reviewer 2 Reviewer 3 Reviewer 4
Leaf area index
0.0 0.2 0.4 0.6 0.8 1.0 1.2
N
D
V
I710
nm
0.0 0.1 0.2 0.3 0.4 0.5
Es
tim
at
ed
%
de
fo
lia
tio
n
0 20 40 60 80 100
Figure 7. Comparison of NDVI with a reference wavelength of 710 nm (NDVI710 nm) and estimates of defoliation by four reviewers with LAI at low (LAI < 0.5) and high (LAI > 0.5) LAI levels.
problem can be attributed to different opinions as to what amount of leaf area constitutes a 0 level of defoliation. A leafy cotton canopy will require some level of defoliation to reach a similar LAI to that of a less leafy cotton canopy that has not been defoli-ated, so it is difficult to define what even constitutes percentage defoliation. Furthermore, it is more com-plex to rate plants with more leaf area, and there is a greater chance for error. It makes sense, therefore, to tie defoliation estimates to a standardized estimate of LAI, such as spectral measurements.
Overhead leaf area estimates can be based on several scales of view from ground-level measure-ments to satellite imagery. Each scale offers unique challenges. Ground-based measurements do not require an aerial platform, and the sensors can be mounted on tractors or other field equipment; how-ever, near-remote measurements only cover a small ground area, and are sensitive to sensor height and plant height. Other issues, such as platform cost and atmospheric interference, can also significantly af-fect management strategies with aerial and satellite imagery. Aerial and satellite platforms are often at the mercy of weather conditions, and the turnaround time from data acquisition to data release can be prohibitive for use in defoliation scheduling.
Another pertinent concern is the influence of senesced or dehisced leaves on leaf area and harvest-ability estimates. Because these leaves have lost the majority of their chlorophyll, they do not have the characteristic chlorophyll reflectance seen in healthy leaves. most of these leaves fall to the ground, but many, particularly when the producer uses a dehis-cent, remain on the plant until harvest. Significant numbers of dehisced leaves were not encountered in these studies, but this issue might need to be ad-dressed on a case-by-case basis.
Conversely, green leaves that fall from the plant could potentially cause an overestimation of LAI when using nDVI. This can often be attributed to using a “green leaf defoliant” (e.g. a mixture of cyclanilide and ethephon), or simply due to wind or other mechanical removal of leaves. In our study, green leaves on the ground were not removed prior to spectral measurements, and this may have been a source of some of the variability in nDVI mea-surements, but this effect may be minimized by at least two factors. The first is the rapid loss of water and breakdown of chlorophyll in senesced leaves (Daughtry and Biehl, 1985). The second is the de-creased influence of each leaf in the spectral scene
based on its distance from the sensor, a principle that is discussed by Klassen et al. (2003). The change in spectral influence would be greater if the sensor is closer to the cotton plant.
The use of a spectral system for estimating de-foliation would advance dede-foliation work in several areas. First, standardized estimates based on spectral changes would allow consistent estimates of defo-liation both spatially and temporally. This might help quantify the effects of different conditions on defoliation rates. Defoliation estimates could also be performed on a larger scale, and defoliation might be performed as a variable rate application based on geo-referenced LAI estimates. This could potentially improve efficiency of defoliant applications, as well as decrease application rates.
ACKNOWLEDGMENT
Supported by Georgia Cotton Commission grant.
REFERENCES
Carter, G.A., and B.A. Spiering. 2002. Optical properties of intact leaves for estimating chlorophyll concentration. J. Environ. Qual. 31:1424-1432.
Curran, P.J. 1989. Remote sensing of foliar chemistry. Remote Sens. Environ. 30:271-278.
Daughtry, C.S.T., and L.L. Biehl. 1985. Changes in spectral properties of detached birch leaves. Remote Sens. Envi-ron. 17:281-289.
Gitelson, A.A., and m.n. merzlyak. 1997. Remote estima-tion of chlorophyll content in higher plant leaves. Int. J. Remote Sens. 18:2691-2697.
Gitelson, A.A., Y. zur, O.B. Chivkunova, and m.n. merzlyak. 2002. Assessing carotenoid content in plant leaves with reflectance spectroscopy. Photochem. Photobiol. 75:272-281.
huete, A.R., R.D. Jackson, and D.F. Post. 1985. Spectral re-sponse of a plant canopy with different soil backgrounds. Remote Sens. Environ. 17:37-53.
Klassen, S.P., G. Ritchie, J. Frantz, D. Pinnock, and B. Bug-bee. 2003. Real-time imaging of ground cover: Relation-ships with radiation capture, canopy photosynthesis, and daily growth rate. p. 3-14. In: Digital Imaging and Spectral Techniques: Applications to Precision Agricul-ture and Crop Physiology. ASA Spec. Publ. 66. ASA, madison, WI.
Read, J.J., L. Tarpley, J.m. mcKinion, and K.R. Reddy. 2002. narrow-waveband reflectance ratios for remote estimation of nitrogen status in cotton. J. Environ. Qual. 31:1442-1452.
Ritchie, G.L. 2003. Use of ground-based canopy reflectance to determine radiation capture, nitrogen and water status, and final yield in wheat. m.S. thesis. Utah State Univer-sity, Logan.
Sims, D.A., and J.A. Gamon. 2002. Relationships between leaf pigment content and spectral reflectance across a wide range of species, leaf structures and developmental stages. Remote Sens. Environ. 81:337-354.
Tarpley, L., K.R. Reddy, and G.F. Sassenrath-Cole. 2000. Reflectance indices with precision and accuracy in predicting cotton leaf nitrogen concentration. Crop Sci. 40:1814-1819.