Paper received: 12.09.2007 Paper accepted: 19.12.2007
Experimental Examination of Main Cutting Force and
Surface Roughness Depending on Cutting Parameters
Ihsan Korkut1'* - Mehmet Boy
2
1
Gazi University, Turkey2
Karabiik University,TurkeyMain cutting forces acting on cutting tool depending on cutting parameters when machining AISI 1117 steel were examined experimentally. Experimental results obtained were compared with the empirical results. For the experimental studies, a Kistler 9257A three component (Fc, F f and Fp) piezoelectric dynamometer was used to measure cutting forces. This dynamometer was associated with a 5019 B130 charge amplifier connected to a PC running Kistler Dynoware force measurement software. The empirical results were obtained through Kienzle approach. Five different cutting speeds, five different fe e d rates and two different depth o f cuts were used in the experiments. It was observed that cutting forces decreased as the cutting speed increased and increased by the feed rate. Experimental results also showed similar trends with the empirical results. At the end o f experiments, it was observed that surface quality increased by with increasing cutting speed and decreased with increasing feed rate. © 2008 Journal o f Mechanical Engineering. All rights reserved.
Keywords: machining, steel, cutting forces, surface roughness, cutting parameters
0 INTRODUCTION
Cutting forces developed during
machining influence cutting performance and unit part cost directly. Although cutting edges o f tools used in machining metals and their alloys are sharp enough, they hardly bear high stresses
developed during machining. So, many
researches have been performed to determine ideal tool geometry and optimum cutting tool cross section which facilitates machining metals. Making use o f the contemporary computer
technology in machining, many problems
encountered in conventional machining have been
eliminated. Significant improvements in
mechanics o f machining have been achieved by using computers software to estimate cutting forces and stress values before machining [
1
] and[
2
].It can be seen from various studies that cutting forces have a direct influence on various cutting parameters such as; cutting speed, feed rate, depth o f cut, rake angle and cutting tool life. Therefore various force measurement methods have been developed to this relationship. It is
known that piezoelectric, thermo-electric,
photoelectric, load-cell etc. transducer type
dynamometers developed for cutting force
measurements are known to convert the mechanic energy to electric signals by measuring the strain [2] and [3].
There are also various experimental studies for direct cutting force measurements along with estimating cutting forces depending on the cutting parameters. Simple analytic models are also used to show effects o f cutting parameters such as cutting speed and feed rate [4] and [5].
In this work, the cutting parameters which effect main cutting forces acting on the cutting tool when orthogonal machining was examined.
1 MATERIALS AND METHOD
The machining tests were performed by single point continuous turning of AISI 1117 steel specimens in cylindrical form on a Johnford TC35 CNC turning centre, with a variable spindle speed o f up to 4000 rpm and a power rating o f 10 kW. The workpiece specimens were 400 mm long and 60 mm in diameter. Prior to the tests, the surfaces of the specimens were turned at
1
mm depth o f cut to remove any possible hardened layers, scale, defects or other impurities. The chemical composition o f the workpiece materials is given in Table 1. Coolant was not used during the tests. The cutting tools used were commercial grade cemented carbide inserts produced by Stellram with the geometry o f SCMW 12 M508- S2F in accordance with ISO 1832. These inserts did not have chip breaker and are recommendedfor machining steels at high cutting speeds due to their high wear resistance. The grades o f these inserts were between PIO and P20.
These inserts were clamped
mechanically on a rigid tool holder with an ISO designation o f SBCR 25 25 M12. The cutting parameters are given in Table 2. The cutting
parameters were chosen by taking into
consideration the recommendations in ISO 3685
[6],
Surface roughness measurements were carried out on the machined surfaces using a
Mitutoyo Surftest 211 instrument. Three
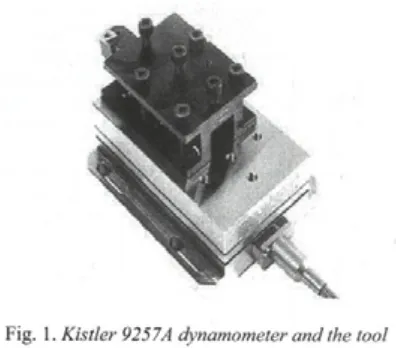
measurements were made on the each surface. Cutting force was measured w ith a Kistler 9257A three component piezoelectric dynamometer and an associated 5019 B130 charge amplifier connected to a PC employing Kistler Dynoware force measurement software. Fig1. 1 shows the dynamometer and the tool holder.
Fig. 1. Kistler 9257A dynamometer and tke tool holder
According to Kienzle, main cutting force (FC); is equal to product o f cross-section o f chip and specific cutting resistance o f workpiece material.
Fc = A0 . k s (1)
where, A0: is cross-section area o f chip (mm2) and
ks specific cutting resistance (N/mm2). To calculate the cutting force for many machining operations, Fc is determined by this approach. In this calculation, chip geometry is important. The most important factor which determines the chip cross-section is cutting edge angle (Fig. 2).
Fig. 2. Relationship between chip cross-section and cutting edge
In figure 2, (y) stands for cutting edge angle, and can be written as as A
0
= a .f or A0= b.hchip cross-sectional area. Cutting edge angle can be found as
sin
(z) =—
(2)
so, we can write following equations for chip width and chip thickness, respectively:
s in ( j)
h = fxsin(z)
(4
)Specific cutting resistance used in
calculation o f main cutting force (FC) is found by following equation:
k„ = Ky
hm (
5
)where: ku specific cutting force o f a section where h =
1
mm and b =1
mm; nr. a constant value depending on the type o f material which is the characteristic slope o f the curve showing logarithmic relation between ks value and h value.Specific cutting resistance decreases by
increasing chip thickness (h). m value is always different for each material.
As reported by many experimental
researches, there are different factors effecting m ain cutting force during machining.
Cutting speed factor (kv), rake angle factor
(k;), tool wear factor (ka) and cutting tool material factor (k) are the m ost significant factors. Similarly, use o f the following equation to calculate k, is a common application.
C - \ .5 y
Table 1. Chemical composition o f the workpiece material
c
Si S P Mn Ni Cr Mo Cu Al NbTi
w
Pb Sn.114 .004 .382 .076 1.48 .345 .098 .027 .065 .011 .002 .001 .037 .002 .034
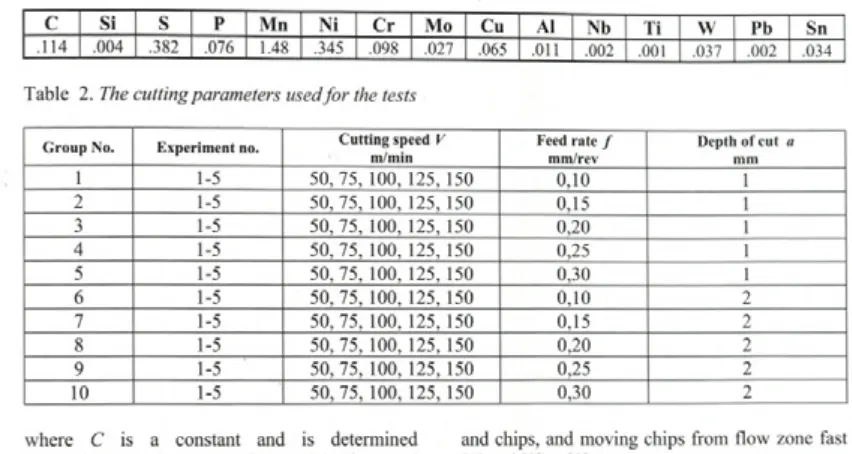
Table 2. The cutting parameters used fo r the tests
G roup No. Experim ent no. Cutting speed V m/min
Feed rate / mm/rev
Depth of cut a mm
1
1-5 50, 75, 100, 125, 1500,10
i2
1-5 50, 75, 100, 125, 150 0,15 i3 1-5 50, 75, 100, 125, 150
0,20
i4 1-5 50, 75, 100, 125, 150 0,25 i
5 1-5 50, 75, 100, 125, 150 0,30 i
6
1-5 50, 75, 100, 125, 1500,10
2
7 1-5 50, 75, 100, 125, 150 0,15
2
8
1-5 50, 75,100, 125, 1500,20
2
9 1-5 50, 75, 100, 125, 150 0,25
2
10
1-5 50, 75, 100, 125,150 0,302
where C is a constant and is determined depending on the type o f material (for steel materials C = 109, for casting materials C = 103).
W hen these factors are taken into consideration, equation giving main cutting force can be derived as ;
Fc = A0 ks k, ky ka kx (7)
Many empirical models are used in calculation o f main cutting force. Since ks value is difference for each material, empirical results are obtained by using Equation 7 in this study and compared with experimental data [1] and [7],
2 RESULTS AND DISCUSSIONS
2.1. Evaluation of the Effect of Cutting Speed, Feed Rate and Depth of Cut on Cutting Forces
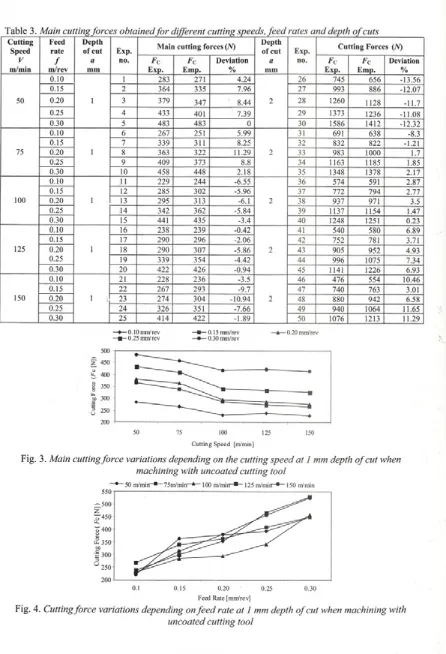
Table 3 shows average values o f cutting forces developed for the uncoated cutting tool. By taking experimental results as reference, average o f five different cutting speeds, and change of main cutting forces (Fc) depending on feed rate is shown in Fig. 3. It can be seen from Fig. 3 that for the five feed rates, cutting forces decrease by 14% to 27% as the cutting speed increases from 50 m/min to 150 m/min. This situation can be attributed to reaching enough level o f energy needed for plastic deformation o f material, a decrease in friction between cutting tool rake face
and chips, and moving chips from flow zone fast [4] and [
8
] to [9],When the cutting speed is increased from 50 to 100 m/min, cutting forces decrease by 16% to 24% (Fig. 3). It can be seen from Fig. 4 that for the five cutting speeds, cutting forces increased by 70% to 92% as the feed rate increased from 0.1 to 0.3 mm/rev.
Experimental results show that in
contrast to cutting speed, increasing feed rate improves cutting force. Equation 1 defines this relationship between cutting force and feed rate. It can be seen from Table 3 that cutting force increase by 108% to 228% as the depth of cut is increased from 1 to 2 mm. It was observed that the cutting forces peak at
2
mm depth o f cut and 50 m/min cutting speed. This situation can be attributed to excessive friction between cutting tool rake face and chip at low cutting speed.Table 3. Main cutting forces obtained fo r different cutting speeds, feed rates and depth o f cuts Cutting
Speed
Feed rate
Depth
of cut Exp. M ain cutting forces (/V)
Depth
of cut Exp. Cutting Forces (JV)
V / a no. Fc F c Deviation a no. Fc F c Deviation
m/min m/rev mm Exp. Emp. % mm Exp. Emp. %
0.10 i 283 271 4.24 26 745 656 -13.56
0.15 2 364 335 7.96 27 993 886 -12.07
50 0.20 i 3 379 347 8.44 2 28 1260 1128 -11.7
0.25 4 433 401 7.39 29 1373 1236 -11.08
0.30 5 483 483 0 30 1586 1412 -12.32
0.10 6 267 251 5.99 31 691 638 -8.3
0.15 7 339 311 8.25 32 832 822 -1.21
75 0.20 i 8 363 322 11.29 2 33 983 1000 1.7
0.25 9 409 373 8.8 34 1163 1185 1.85
0.30 10 458 448 2.18 35 1348 1378 2.17
0.10 11 229 244 -6.55 36 574 591 2.87
0.15 12 285 302 -5.96 37 772 794 2.77
100 0.20 i 13 295 313 -6.1 2 38 937 971 3.5
0.25 14 342 362 -5.84 39 1137 1154 1.47
0.30 15 441 435 -3.4 40 1248 1251 0.23
0.10 16 238 239 -0.42 41 540 580 6.89
0.15 17 290 296 -2.06 42 752 781 3.71
125 0.20 i 18 290 307 -5.86 2 43 905 952 4.93
0.25 19 339 354 -4.42 44 996 1075 7.34
0.30 20 422 426 -0.94 45 1141 1226 6.93
0.10 21 228 236 -3.5 46 476 554 10.46
0.15 22 267 293 -9.7 47 740 763 3.01
150 0.20 i 23 274 304 -10.94 2 48 880 942 6.58
0.25 24 326 351 -7.66 49 940 1064 11.65
0.30 25 414 422 -1.89 50 1076 1213 11.29
*— 0.10mm/rev 0.15 mm/rev —*— 0.20mm/rev
■■ ■ 0.25 mm/ rev —• — 0.30 mm/rev
Fig. 3. Main cutting force variations depending on the cutting speed at 1 mm depth o f cut when machining with uncoated cutting tool
* 50 m/min ■ TSm/min- ■*"“ 100 m/mirr- * - 125 m/min- * - 150 nVmin
0 .1 m m /re v
0 .2 5 m m /re v - J - 0 .1 5 m m /re v • • 0 .3 0 m m /rev - è - 0 .2 0 m m /re v
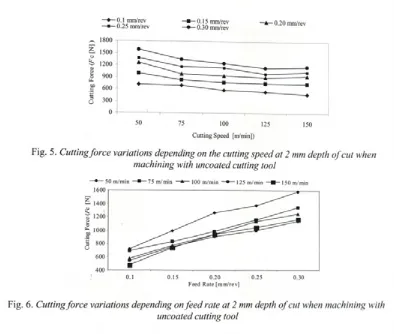
Fig. 5. Cutting force variations depending on the cutting speed at 2 mm depth o f cut when machining with uncoated cutting tool
50 m/min —■— 75 m/min -^*— 100 m/min — 125 m/min - » - 1 5 0 m/min
Feed Rate [mm/rev]
Fig.
6
. Cutting force variations depending on feed rate at 2 mm depth o f cut when machining with uncoated cutting toolA t 2 mm depth o f cut, it can be seen from Fig.
6
that for the five cutting speeds, cutting forces increased by 95% to 126% as the feed rate increased from 0.1 to 0.3 m m /rev.There is not enough and certain
inform ation in the literature for ks value o f A ISI 1117. For determ ination o f k s value, various experim ental studies were performed and m ain cutting force obtained through these experim ents w as used. Using Equation 7, k s
values w ere found from the results obtained from the experim ents and arithm etical average o f them w as taken. Em pirical results were taken by using ks valups obtained from this.
C utting speed factor ( k v) in the equation
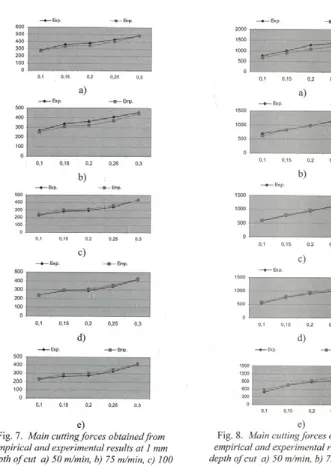
w as taken as 1.11 for 50 m/m in, 1.03 for 75m /m in, 1 for 100 m/m in, 0.98 for 125 m /m in and 0.97 for 150 m/min. M ain cutting forces obtained by experim ental and empirical results at
1
mm depth o f cut show sim ilar trends at all the cutting speeds (Fig 7). It was observed that there w ere some deviations betw een experim ental and em pirical results.Chip cross-sectional area increases w ith increasing feed rate, so it causes increase in the amount o f deviation. M aximum deviation was observed at cutting speeds o f 50 and 75 m/min. Main cutting forces obtained from experimental results are higher than em pirical ones. This can be due to low feed rate in ductile m aterials at
1
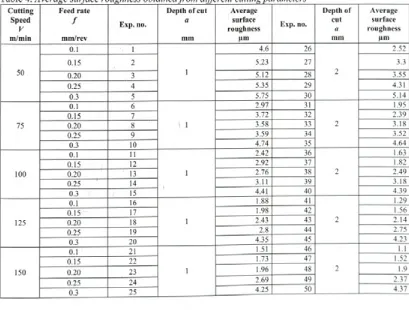
mm depth o f cut and the built-up edge (BUE) problem created by cutting speed. This situation showed that experimental work is more reliable.M ain cutting forces obtained by experim ental and em pirical resu lts at
2
mm depth o f cut show sim ilar trends at all the cutting speeds (Fig.8
). M axim um d eviation occurred at cutting speed o f 50 m /m in. These deviations originate from p aram eters in Equation 7. Flere, the m ost effectiv e factors are depth o f cut (a) and feed rate (/). O ther causes are k sand cutting speed factor.Values used in em pirical m odel are data obtained at the end. T here are d ifferen t values related to these p aram eters o f A ISI
e)
Fig. 7. Main cutting forces obtained from empirical and experimental results at 1 mm depth o f cut a) 50 m/min, b) 75 m/min, c) 100
m/min, d) 125 m/min and e) 150 m/min.
e)
Fig.
8
. Main cutting forces obtainedfrom empirical and experimental results at 2 mm depth o f cut a) 50 m/min, b) 75 m/min, c) 100m/min, d) 125 m/min and e) 150m/min
2.2. Evaluation of the Effect of Cutting Speed, Feed Rate and Depth of Cut on Surface Roughness
Average surface roughness values (Ra)
obtained for five different cutting speeds and feed rate and two different depth o f cuts are listed in Table 4.
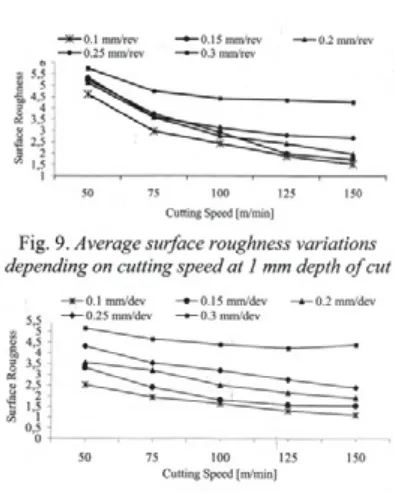
Fig. 9 shows the variation o f surface roughness by cutting speed for
1
mm depth o f cut and five different feed rates.It is known that surface roughness has a decreasing trend w ith increasing cutting speed. The findings obtained also support the same trend. Especially, when speed increases from 50 m /m in to 75 m/m in, a serious im provem ent in
surface roughness and an increased
For all cutting speeds, surface quality decreases and Ra values increase by increasing feed rate. In theoretical approach, it is known that surface roughness increases in direct proportion o f square feed rate.
According to results obtained from the experiments performed at
2
mm dept o f cut, variation o f surface roughness depending on cutting speed and feed rate are given in Figs. 11 and12
.The most important result o f increasing depth o f cut to
2
mm is better surface quality than surface quality obtained from 1 mm depth. In normal conditions, the worsening in surface quality is expected by increase in cut depth, however a reverse trend was observed in experiment. This situation can be evaluated as negative reaction o f0.8
nlm tool nose radius chosen for intermediate machining conditions. Normally, while 2.5 mm depth o f cut is given as reference in ISO 3685 for 0.8 mm tool nose radius,2
mm depth o f cut also exist between boundaries given for tool nose radius o f0.8
mm (Figs. 11-12). By taking depth o f cut as 1 mm, the boundaries given for tool nose radius o f0.8
mm are exceeded. Furthermore, 1 mm is a low depthof cut, so it can be said that there is a worsening in surface quality as negative effect o f machine tool and tool vibrations.
3 CONCLUSIONS
The most suitable cutting speeds for 1 mm and
2
mm depth o f cuts were found as100
m/min 75 m/min respectively in term s o f cutting forces. It was observed that the highest cutting forces were obtained at lower cutting speeds. Cutting forces decreased when cutting speed was increased. It was also observed that cutting forces increased with increasing feed rate.Considering Ra and cutting param eters it was observed that increasing cutting speed im proves the surface quality but increasing feed rate w orsens it. These findings are in agreem ent w ith the literature. By increasing depth o f cut from
1
to2
mm, a trend o fimprovem ent in surface quality was
observed. This situation shows that 1mm depth o f cut is not suitable for
0.8
mm tip radius w hich is suitable for interm ediate cutting conditions.Table 4. Average surface roughness obtained from different cutting parameters Cutting Speed V m/min Feed rate / mm/rev Exp. no.
Depth of cut a mm Average surface roughness pm
Exp. no.
Depth of cut a mm Average surface roughness pm 50 0.1 1 i 4.6 26 2 2.52
0.15 2 5.23 27 3.3
0.20 3 5.12 28 3.55
0.25 4 5.35 29 4.31
0.3 5 5.75 30 5.14
75 0.1 6 11 2.97 31 2 1.95
0.15 7 3.72 32 2.39
0.20 8 3.58 33 3.18
0.25 9 3.59 34 3.52
0.3 10 4.74 35 4.64
100 0.1 11 i 2.42 36 2 1.63
0.15 12 2.92 37 1.82
0.20 13 2.76 38 2.49
0.25 14 3.11 39 3.18
0.3 15 4.41 40 4.39
125 0.1 16 i 1.88 41 2 1.29
0.15 17 1.98 42 1.56
0.20 18 2.43 43 2.14
0.25 19 2.8 44 2.75
0.3 20 4.35 45 4.23
0.1 21 1.51 46 1.1
0.15 22 1.73 47 1.52
150 0.20 23 i 1.96 48 2 1.9
0.25 24 2.69 49 2.37
X - 0.1 mm/rev 0.15 mm/rev 0.2 mm/rev - X - 50 m/min —• — 75 m/min * 1100m/min
Fig. 9. Average surface roughness variations Fig. 10. Average surface roughness variations
depending on cutting speed at 1 mm depth o f cut depending on fe e d rate at 1 mm depth o f cut
0.1 mm/dev —• —0.15 mm/dev — 0.2 mm/dev
Cutting Speed [m/min]
0,1 0,15 0,2 0,25 0,3 Feed Rate [mm/rev]
Fig. 11. Average surface roughness variations depending on cutting speed at 2 mm depth o f cut
3 ACKNOW LEDGEMENT
The authors would like to acknowledge Gazi University Scientific Research Projects (07/2004-29) for the financial support throughout this study.
4 REFERENCES
Fig. 12. Average surface roughness variations depending on fe e d rates at 2 mm depth o f cut
[4] Strafford, K.N., Audy, J. Indirect
monitoring o f machinability in carbon steels by measurement o f cutting forces, J. Mater. Process. Technol, 1997, no.67, p.
1-3, p. 150-156.
[5] ISO 3685, Tool Life Testing, International Standard Organisation, 1992.
[
6
] Gunay, M., Korkut, I, Aslan, E., Seker,U. Investigation o f the effect o f rake angle onmain cutting force, International
Journal o f Machine Tools & Manufacture, 2004, no.43, p.953-959.
[7] Benardos, P.G., ve Vosniakos, G.C.,
Predicting surface roughness in
machining: a review International
Journal o f M achine Tools and
Manufacture, 2002, 43, p.833-844. [1] Seker, U. Lecture Notes, Tool Design in
Machining Production, Gazi University Institute o f Science and Technology, Ankara, 2000.
[2] Shaw, M.C. Metal Cutting Principles,
Oxford University Press, London, 1984. Sikdar, S. K., Chen, M., Relationship
between tool flank wear area and
component forces in single point
turning, Journal o f Material Processing Technology, 2002, no.128, p.210-215. [3] W ang J., The effect o f the multi-layer
surface coating o f carbide insers on the cutting forces in turning operations,
Journal o f Material Processing Technology, 2000, no.97, p .l 14-119.