Ames Laboratory Publications
Ames Laboratory
2014
Anomalous magneto-structural behavior of MnBi
explained: A path towards an improved permanent
magnet
Nikolai A. Zarkevich
Iowa State University, [email protected]
Linlin Wang
Iowa State University, [email protected]
Duane D. Johnson
Iowa State University, [email protected]
Follow this and additional works at:
http://lib.dr.iastate.edu/ameslab_pubs
Part of the
Engineering Physics Commons
, and the
Materials Science and Engineering
Commons
The complete bibliographic information for this item can be found at
http://lib.dr.iastate.edu/
ameslab_pubs/241
. For information on how to cite this item, please visit
http://lib.dr.iastate.edu/
howtocite.html
.
Anomalous magneto-structural behavior of MnBi explained: A path
towards an improved permanent magnet
Abstract
Low-temperature MnBi (hexagonal NiAs phase) exhibits anomalies in the lattice constants (a, c) and bulk
elastic modulus (B) below 100 K, spin reorientation and magnetic susceptibilitymaximum near 90 K, and,
importantly for high-temperature magnetic applications, an increasingcoercivity (unique to MnBi) above 180
K. We calculate the total energy and magneto-anisotropyenergy (MAE) versus (a, c) using DFT+U methods.
We reproduce and explain all the above anomalies. We predict that coercivity and MAE increase due to
increasing a, suggesting means to improve MnBi permanent magnets.
Keywords
Materials Science and Engineering, Thermal expansion, Coercive force, Lattice constants, Doping, Density
functional theory
Disciplines
Engineering Physics | Materials Science and Engineering
Comments
This article is from
APL Materials
2 (2013): 032103, doi:
10.1063/1.4867223
.
Rights
Copyright 2014 Authors. All article content, except where otherwise noted, is licensed under a Creative
Commons Attribution 3.0 Unported License.
APL MATERIALS2, 032103 (2014)
Anomalous magneto-structural behavior of MnBi
explained: A path towards an improved permanent magnet
N. A. Zarkevich,1,aL.-L. Wang,1and D. D. Johnson1,2
1The Ames Laboratory, U.S. Department of Energy, Ames, Iowa 50011, USA 2Materials Science and Engineering, Iowa State University, Ames, Iowa 50011, USA
(Received 9 December 2013; accepted 19 February 2014; published online 4 March 2014)
Low-temperature MnBi (hexagonal NiAs phase) exhibits anomalies in the lattice constants (a,c) and bulk elastic modulus (B) below 100 K, spin reorientation and magnetic susceptibility maximum near 90 K, and, importantly for high-temperature magnetic applications, an increasing coercivity (unique to MnBi) above 180 K. We calculate the total energy and magneto-anisotropy energy (MAE) versus (a,c) using DFT+U methods. We reproduce and explain all the above anomalies. We predict that coercivity and MAE increase due to increasinga, suggesting means to improve MnBi permanent magnets.© 2014 Author(s). All article content, except where otherwise noted, is licensed under a Creative Commons Attribution 3.0 Unported License.
[http://dx.doi.org/10.1063/1.4867223]
MnBi in its low-temperature phase (LTP) has one of the most extraordinary magnetic properties among ferromagnetic materials.1–22Uniquely, its coercivity increases with temperature (T), and its
value is larger than that of Nd2Fe14B above 423 K, making it potentially an excellent permanent
magnet for higher-temperature applications. MnBi does not contain critical rare-earth elements and, thus, it has a potential for technological impact. If magnetic anisotropy energy (MAE) is better controlled and tuned, use of MnBi magnets could be broadened. Below we provide theoretical explanation for the long-standing experimental puzzles in the measured coercivity, spin orientation, lattice constants, and bulk modulus of MnBi. We also suggest a means to further increase the MAE. Despite its simple NiAs hexagonal structure (Fig. 1), stable below 628 K,5,14 MnBi exhibits several puzzling and unexplained behaviors versus T.11–15First, the lattice constantaexhibits minimal
thermal expansion below 70 K and then expands rapidly during the spin reorientation, whilecshows a chaotic zigzag behavior below 150 K.9,13,15Second, there is a measured kink in the bulk modulus
(B) near 39 GPa at 100 K.8 Third, a spin reorientation is observed atT
SR≈90 K,8,11,12when the
magnetization M(T) easy axis changes from in-plane toc-axis aboveTSR. Next, coercivity is near
zero at T<180 K, and increases with T above 180 K. Finally, above 628 K MnBi transforms to a high-ToP10phase (stable between 613 K and 719 K) with loss of magnetization.7
We explain all these observations by examining dependence of the calculated total energy (E) and MAE on the lattice geometry (Figs.2–4). The total energy is anisotropic versus (a,c), like a “flat-bottom canoe,” and its asymmetry causes abnormal thermal expansion. Due to the nature of the potential energy surface, the second derivative of the total energy with respect to volume is not monotonic, producing a kink in B=V d2E/d V2 near 39 GPa, whose origin can be traced to features in electronic density of states (DOS). Spin reorientation arises from a change of sign in MAE, which depends on increasinga, This suggests simple means to control MAE: by thermal expansion (observed), or by strain or alloying, e.g., coherent interfacing or doping. While temperature and strain affect mostly (a,c), doping can induce competing effects on MAE, some of which can be beneficial. Preliminary results suggest that doping with selected metals (Ni, Rh, Pd, Ir) increases MAE and coercivity and stabilize the spin orientation alongcat all temperatures.
aElectronic mail:[email protected].
032103-2 Zarkevich, Wang, and Johnson APL Mater.2, 032103 (2014)
FIG. 1. MnBi hexagonal structure (hP4, P63/mmc, No. 194), with 0.0323e/Å3charge density isosurfaces. (0001) projection
(left), and primitive unit cell (right) with two Mn (red) and two Bi (green) atoms.
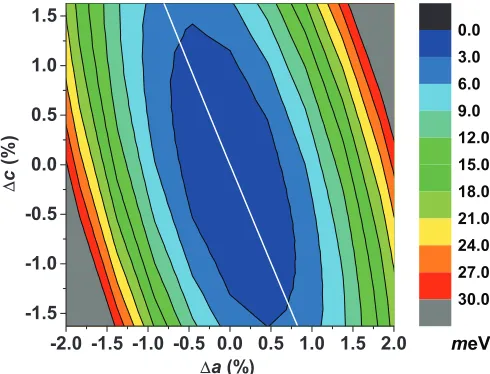
FIG. 2. Change in the total energy E at 0 K vs. (a,c), with 3 meV/cell (or 34.8 K) between contours. Constant volume (ca2√3/2) is the line through (0,0).
Computational method:We use a DFT+U method implemented in the Viennaab initio simu-lation package (VASP).23,24We use 16×16×10 Monkhorst-Packk-point grid with the-point, a
337.4 eV plane-wave energy cutoff and 500.7 eV augmentation charge cutoff, for both energy and magnetic anisotropy energy. A modified Broyden’s method25is used for electronic self-consistency. Bulk moduli are found from dependence of the total energy E(a,c) on volume V =ca2√3/2. MAE is the energy difference with moments along1¯210and then0001, i.e., E[1¯210]−E[0001]. Generally, the MAE can be the order ofμeV to meV; in MnBi for changes ina, pertinent to thermal lattice expansion effects, changes are order of meV.
We improve description of the electronic structure (and, hence, magnetization and lattice pa-rameters) by combining the spin-polarized, generalized gradient approximation (GGA)26 with the
rotationally invariant DFT+U formalism.27 GGA includes local value and gradient of the
elec-tron density n =n↑ +n↓ and spin density nσ (σ=↑,↓) in the exchange-correlation functional
EGG A
xc [n↑,∇n↑,n↓,∇n↓].28DFT+U corrects the total energy27for presence of localized states, i.e., ED F T+U=ED F T +12(U−J)
σ(nm,σ −nm2,σ), wherenm,σ is the occupation number of statem
(m=2 ford-orbital on Mn). See textbook29for more details. After testing, we set (U−J)=2 eV for
[image:4.612.182.427.279.466.2]032103-3 Zarkevich, Wang, and Johnson APL Mater.2, 032103 (2014)
-6 -4 -2 0 2 4 6
0 50 100 150 200 250 300 350
Energy (meV)
DFT
Cubic fit
Quadratic
ΔE
-6 -4 -2 0 2 4 6
Δa (%)
-60 -40 -20 0 20 40 60
Δ
E (meV)
-1 0 1 Δa (%) 0
6 12 18 24 30
E (meV)
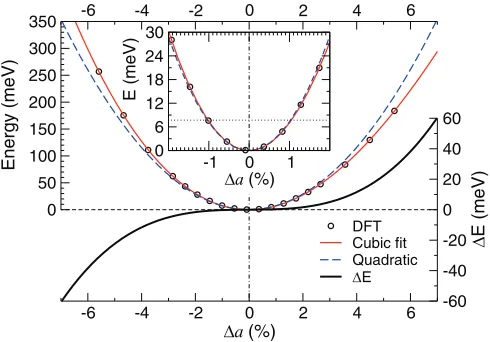
[image:5.612.183.428.90.261.2]FIG. 3. E(a,c=0). GGA+U results (circles) with cubic (line) and quadratic (dashed line) fits, and their differenceE (black line, right scale).ω=7.7 meV (90 K) is the horizontal dotted line in the inset.
FIG. 4. MAE vs. (a,c) with 0.1 meV/cell steps in contours from zero (gray line). Assessed data15(circles) is shifted by
0.83% (filled circles), see text.
1.86% and 0.21%, respectively. The calculated M(0) is 3.96μB/MnBi (with site-projected moments
of 4.231 and−0.273μB on Mn and Bi, respectively); it agrees with the extrapolated to 0 K values
of 4.030 and 3.95μB;31 or the measured values of 3.84±0.03μB at 4.2 K;32 4.18μB at 10 K, or
3.60μBat room T.11
While the GGA+U better describes strongly correlated systems, like MnBi, there still remains a small systematic DFT error in the lattice constants, arising from the approximation in the exchange-correlation functional (which introduces a small shift in pressure, but not in the curvature of the total energy). Notably, the measured lattice constants differ by 1%, e.g., at T=50 K,c=6.05 Å,13
and 6.11 Å.15The MAE (Fig.4) is small and very sensitive toa. For proper comparison, we plot in
Fig.4both the measured (a,c) and those shifted by 0.8% to account for a DFT bias in the GGA+U lattice constants for a given alloy.
Comparison to previous DFT calculations:Without the Hubbard U correction, GGA gives M(0) of 3.455μB and distorts the cell, underestimating its volume (TableI). For comparison, previous
DFT results are 3.50,33 3.49,11and 3.52 μ
B.34 Fixingato 4.170 Å andcto 5.755 Å gives a total
[image:5.612.186.425.311.497.2]032103-4 Zarkevich, Wang, and Johnson APL Mater.2, 032103 (2014)
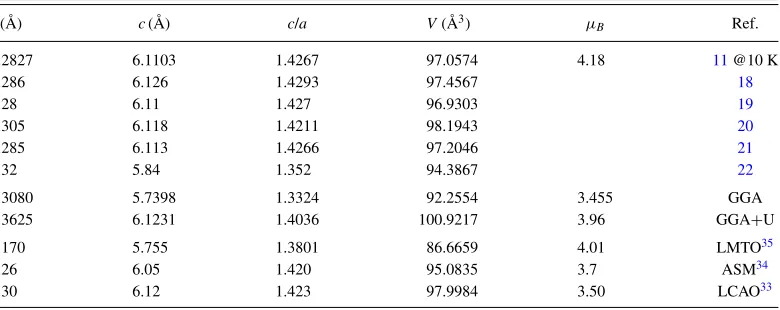
TABLE I. aandc,c/a, cellV, and M (μB/MnBi) of LTP-MnBi from experiment and our (or formera) DFT results.
a(Å) c(Å) c/a V(Å3) μ
B Ref.
4.2827 6.1103 1.4267 97.0574 4.18 11@10 K
4.286 6.126 1.4293 97.4567 18
4.28 6.11 1.427 96.9303 19
4.305 6.118 1.4211 98.1943 20
4.285 6.113 1.4266 97.2046 21
4.32 5.84 1.352 94.3867 22
4.3080 5.7398 1.3324 92.2554 3.455 GGA
4.3625 6.1231 1.4036 100.9217 3.96 GGA+U
4.170 5.755 1.3801 86.6659 4.01 LMTO35
4.26 6.05 1.420 95.0835 3.7 ASM34
4.30 6.12 1.423 97.9984 3.50 LCAO33
aNote:aandcwere fixed in Refs.35,34, and33.
3.7μBin the augmented spherical method (ASM).34Magnetization of MnBi increases with volume.
The calculated lattice constants, volume, and magnetization increase with the value of (U−J).
Results and discussion:Around equilibrium, E(a,c) looks like a flat-bottom canoe, canted from a constant volume direction towardsc(Fig.2). Because the energy penalty for changingcby 0.5% is close to zero, even low-energy defects can alterc, and any value ofcwithin that range is accessible in experiment below 100 K. Indeed, this predicted behavior ofcwith chaotic amplitude within∼0.5% is observed.13,15
Below 6 meV (70 K), E(a,0) in Fig. 3 is symmetric with E(+a, 0) =E(−a, 0), and can be well described by a parabola E(a)= 12mω¯ 2(a−a
0)2, where the unit cell mass is ¯m =2(mMn+mBi)=527.836 amu, and ω=1.2×10¹³ s−1 is harmonic frequency for vibrations
along a. Quantization of this potential results in a descrete spectrum with the equidistant levels
En =ω(n+12), with ω = 7.7 meV (90 K). Due to the symmetric potential and absence of
vibrational excitations, there is no thermal expansion alongaat T<70 K.
Above 9 meV (100 K), E(a,0) is asymmetric with E(+a, 0) <E(−a, 0). It can be ap-proximated by a cubic polynomial E(a) =E0 +2a2 + 3a3, with 2 =3.8 eV/Å2 and3 = −2.1 eV/Å3. This fit hasχ2=6×10⁻⁷, RMS relative error of 7.9×10⁻⁶, and Theil U coefficient of 7.8×10⁻⁶. ForN=4 ions per unit cell, our theoretical estimate of the linear thermal
expan-sion coefficient (αa =a1d Tda ≈ −a1N k32 2
) is 1.153×10⁻⁵ K−1, in agreement with experiment,15i.e.,
1.168×10⁻⁵ K−1.
Hence, the potential energy surface in Figs.2and3predicts no thermal expansion alongaat low T<70 K, and a positive expansion at higher T above 100 K, as observed.15
The spin reorientation in MnBi near 90 K was not fully understood in experiments.8,11,12 Moreover, previous DFT calculations of MAE found the easy axis to be always in-plane (Table III in Ref.35). We calculate dependence of the MAE on (a,c), and find that it is strongly affected byaand very weakly byc, see Fig.4. Thus, thermal expansion ofacauses the MAE to change from negative (in-plane oriented moments) to positive (moments oriented along the c-axis). This sign change causes a spin reorientation, experimentally observed around 90 K.8,11,12Magnetic susceptibility has
maximum at MAE=0,8,10,11when spins easily reorient along the external applied magnetic field.
Coercivity is zero if|MAE|<kT, but increases with MAE at T>180 K.12 Thus, dependence of
MAE on (a,c) causes spin reorientation and explains the thermal behavior of magnetic susceptibility and coercivity.
Another consequence of the anomalous potential energy surface E(a,c) is the observed kink in B near 39 GPa at 100 K, a long-standing puzzle.8We calculate B=V d2E/d V2 from dependence
of E(a,c) onV =ca2√3/2 at isotropic expansion (a =cin Fig.2). We find that B versusa
(Fig.5) is not monotonic near B=39 GPa, as observed.8This kink originates from a change in DOS
032103-5 Zarkevich, Wang, and Johnson APL Mater.2, 032103 (2014)
-1
0
1
E
−
E
F(eV)
-3
-2
-1
0
1
DOS
1
1.03
1.06
1
1.03
1.06
a/a
020
30
40
50
60
70
[image:7.612.183.429.93.334.2]B (GPa)
FIG. 5. B vs.aat isotropic expansion (a/a0=c/c0) relative toa0 =4.2827 Å andc0=6.1103 Å.11(Inset) Spin DOS
(states/[cell·eV]) for 3 values ofa/a0.
the minimum in the minority-spin DOS passes through EF with thermal expansion ofa; the DOS
minimum occurs at EFat the value ofacorresponding to B=39 GPa (inset, Fig.5).
Summary:We calculated dependence of the total energy and magneto-anisotropy energy on the lattice geometry for MnBi low-T phase. Our results explain the unusual structural and magnetic properties, heretofore unexplained. From the potential energy surface, we reproduced and explained the observed anomalous behavior of (i) the lattice constants and (ii) bulk modulus. The calculated MAE changes sign with a small increase ina, which causes spin reorientation during thermal expansion. (iii) The magnetic susceptibility has a maximum at MAE=0 (at spin reorientation). (iv) Further increase of MAE with thermally expandingaincreases coercivity at T>180 K, where
|MAE|>kT.
Due to its sensitivity on a, the MAE can be altered by temperature, pressure, doping, or interfacial strain.36–39 To test whether doping can achieve a positive MAE at all temperatures, we
performed preliminary, small-cell calculations that find that doping with selected (Ni, Rh, Pd, Ir) metals increases coercivity and stabilizes the spin orientation alongc. More extensive calculations for<3% cationic or anionic doped (substitutions and interstitials) cases are planned to establish the effects on lattice, magnetism, and stability. Our understanding of the anomalous magneto-structural behavior offers an opportunity to develop improved MnBi-based permanent magnets.
This work is supported by the U.S. Department of Energy (DOE) ARPA-E (REACT 0472-1526). Some methods were developed under support by the Office of Basic Energy Science, Division of Materials Science and Engineering. Ames Laboratory is operated for the U.S. DOE by Iowa State University under Contract No. DE-AC02-07CH11358. We thank our REACT team and F. J. Pinski for useful discussions.
1V. Fr. Heusler,Z. Angew. Chem.17(9), 260–264 (1904).
2G. Arrivaut, “Contribution a l’etude des alliages de manganese,” Thesis no.18, Bordeaux (1907); Bordeaux Mem. Soc. Sci.
Phys. Nat. (Ser. 6)4, 67–160 (1908).
032103-6 Zarkevich, Wang, and Johnson APL Mater.2, 032103 (2014)
5S. A. Shchukarev, M. P. Morozova, and T. A. Stolyarova, Zh. Obshch. Khim. (Russian Journal of General Chemistry) 31(6), 1773–1777 (1961).http://www.maik.rssi.ru/cgi-perl/journal.pl?lang=rus&name=genchem
6K. Adachi,J. Phys. Soc. Jpn.16(11), 2187 (1961).
7A. F. Andresen, W. H¨alg, P. Fischer, and E. Stoll,Acta Chem. Scand.21, 1543–1554 (1967).
8N. P. Grazhdankina and M. A. Novikov, Pis’ma v ZhETF (JETP Letters)30(6), 333–335 (1979).http://www.jetpletters.
ac.ru/ps/437/article_6897.pdf
9H. Yoshida, T. Shima, T. Takahashi, H. Fujimori, S. Abe, T. Kaneko, T. Kanomata, and T. Suzuki,J. Alloys Compd. 317–318, 297–301 (2001).
10J. B. Yanget al.,Appl. Phys. Lett.79(12), 1846 (2001).
11J. B. Yanget al.,J. Phys.: Condens. Matter14, 6509–6519 (2002). 12J. B. Yanget al.,J. Appl. Phys.91(10), 7866–7868 (2002). 13J. B. Yanget al.,Appl. Phys. Lett.99, 082505 (2011). 14Y. Mitsuiet al.,J. Jpn. Inst. Metals73(1), 40–45 (2009).
15K. Koyama, Y. Mitsui, and K. Watanabe,Sci. Technol. Adv. Mater.9, 024204 (2008). 16K. Koyamaet al.,J. Alloys Compd.509, L78–L80 (2011).
17D. T. Zhanget al.,J. Magn. Magn. Mater.324, 1887–1890 (2012). 18D. D. Shenget al.,J. Magn. Magn. Mater.115, 66–76 (1992).
19H. G¨obel, E. Wolfgang, and H. Harms,Phys. Stat. Sol. A34, 553 (1976). 20K. Ahlborn, K. B¨arner, and W. Schr¨oter,Phys. Stat. Sol. A30, 251 (1975). 21T. Chen,J. Appl. Phys.45, 2358 (1974).
22J. M. Noothoven van Goor and H. Zijlstra,J. Appl. Phys.39, 5471 (1968). 23G. Kresse and J. Hafner,Phys. Rev. B47, 558 (1993);49,14251(1994).
24G. Kresse, and J. Furthm¨uller,Comput. Mater. Sci.6, 15 (1996);Phys. Rev. B54, 11169 (1996). 25D. D. Johnson,Phys. Rev. B38(18), 12807 (1988).
26J. P. Perdew, J. A. Chevary, S. H. Vosko, K. A. Jackson, M. R. Pederson, D. J. Singh, and C. Fiolhais,Phys. Rev. B46,
6671 (1992);48,4978(1993).
27S. L. Dudarev, G. A. Botton, S. Y. Savrasov, C. J. Humphreys, and A. P. Sutton,Phys. Rev. B57, 1505 (1998).
28R. G. Parr and W. Yang,Density-Functional Theory of Atoms and Molecules(Oxford University Press, New York, 1989). 29V. I. Anisimov and A. I. Lichtenstein, “LDA+U method: Screened coulomb interaction in the mean-field approximation,” Strong Coulomb Correlations in Electronic Structure Calculations: Beyond the Local Density Approximation, edited by V. I. Anisimov (Gordon and Breach Science Publishers, 2000), Chap. 2.
30B. W. Roberts,Phys. Rev.104, 607 (1956). 31R. R. Heikes,Phys. Rev.99, 446 (1955).
32W. E. Stutius, T. Chen, and T. R. Sandin,AIP Conf. Proc.18, 1222 (1974). 33M.-F. Liet al.,Jpn. J. Appl. Phys.46(6A), 3455–3462 (2007).
34R. Coehoornf and R. A. de Groot,J. Phys. F: Met. Phys.15, 2135–2144 (1985). 35P. Ravindranet al.,Phys. Rev. B59(24), 15680 (1999).
![FIG. 5. B vs. a at isotropic expansion (a/a0 = c/c0) relative to a0 = 4.2827 Å and c0 = 6.1103 Å.11 (Inset) Spin DOS(states/[cell · eV]) for 3 values of a/a0.](https://thumb-us.123doks.com/thumbv2/123dok_us/8126242.241008/7.612.183.429.93.334/fig-isotropic-expansion-relative-inset-spin-states-values.webp)
