ISSN 0975-928X
241
Research Note
Correlation and path analysis for yield and growth attributes in adzukibean
Rajnish Kumar, R. K. Mittal*,D.P. Pandeyand ShaylaBindra
Department of Crop Improvement, CSK Himachal Pradesh KrishiVishvavidyalaya, Palampur 176062 Email: [email protected]
(Received: 12 Aug 2014; Accepted:31 Dec 2014)
Abstract
Twenty-six genotypes of adzuki bean were evaluated at the experimental farm of the Department of Crop Improvement, CSK HPKV, Palampur, in RBD with three replications during kharif, 2007. Data were recorded on the nine yield traits and ten growth parameters .Significant positive correlation and high genotypic correlation of aerial biomass at maturity, yield/day, yield/day with respect to reproductive phase, biomass/day to plant growth,pods/plant, AGR and LAD with seed yield/plant were observed. It was found through path analysis that yield/day and AGR had high direct effect on seed yield at genotypic and phenotypic levels. Plant height, pod length, pods/plant, seeds/pod, harvest index, aerial biomass at maturity, yield/day, yield/day with respect to reproductive phase, biomass/day to plant growth, leaf area and 100-seed weight had also contributed indirectly and positively through yield/day towards seed yield/plant. AGR besides having direct effect also showed indirect effect through pods/plant whereas LAD showed only indirect effect in combination through AGR. Therefore, selection, if practiced for AGR, would prove to be more effective for bringing about improvement in seed yield in adzuki bean. Based on the present studies, two adzuki bean genotypes viz., HPAB -27 and HPAB-30 were found highest yielding and having better combination of the yield and its component traits among all the genotypes.
Keywords
Adzuki bean, correlation, path analysis, directs effects and indirect effects
Vignaangularis (Willd.) Ohwi and Ohashi commonly
known as adzuki bean, it is a small bean that has an inherently sweet, nutty taste and it is one of the 12 most important grain legume crops in the world. In India, though it is not commonly cultivated crop but has its potentiality in mid-hills of Himachal Pradesh as a pulse crop. Its suitability has not only been visualised for higher productivity but also with respect to resistance to various diseases like Anthracnose blight, Cercospora leaf spot etc., which otherwise are lacking in other commonly grown pulses of Vignaspecies in the state (Gupta et al., 1980). It is recognized that this crop is most tolerant to dampness than other pulses, like French bean, mungbean, mash, cowpea etc and at the same time it performs well under rain fed condition.
The success of any breeding programme depends on the nature and magnitude of genetic variability present in the genotypes. The presence of sufficient variability, the knowledge of nature of association among different characters and relative contribution of different characters to yield is a prerequisite to any breeding programme. For improvement in yield, it would be desirable to understand the nature and magnitude of associations among yield and its component traits. Better understanding of the contribution of component traits in building the
genetic make-up of the crop can be obtained through correlation. Based upon genotypic and phenotypic correlation, the breeder would be able to decide the breeding methods to be used to exploit desirable and break the undesirable associations.
The experiment was conducted at the experimental farm of the Department of Crop Improvement, CSK Himachal Pradesh KrishiVishvavidyalaya, Palampur during kharif2007. The farm is situated at an elevation of 1300 m.a.m.s.l with 3606'N latitude and 7603'E longitude, which represents the mid-hill zone of Himachal Pradesh.Twenty-six genotypes viz., SMLAB-1, SMLAB-4, SMLAB-6, SMLAB-8, SMLAB-9, SMLAB-10, EC-000254,
ISSN 0975-928X
242
practices was followed for raising a good crop.Data were recorded on several traits grouped in to traits associated with growth analysis, yield traits. The phenotypic and genotypic coefficients of correlation were computed as per method suggested by Al-Jibouriet al. (1958). The Path coefficients were calculated by the method suggested by Dewey and Lu (1959).
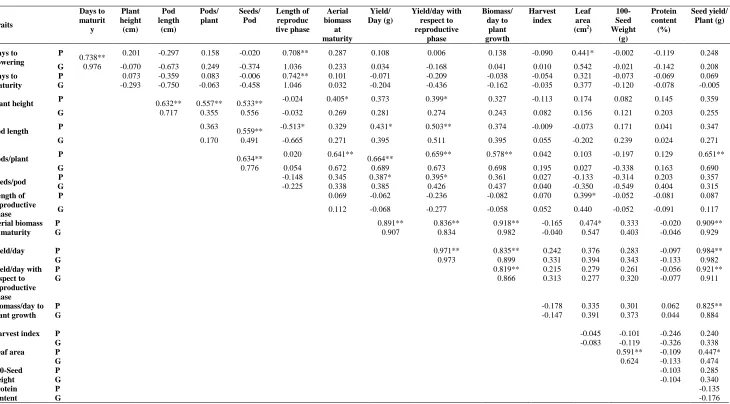
The results of the association studies showed that magnitude of genotypic correlations was higher than the phenotypic correlations for most of the characters studied (Tables I &II). Similar results have been also reported by Thawareet al. (2000) and Das et al. (2004) in ricebean. Association between yield and other traits studied i.e., seed yield with pods/plant, aerial biomass at maturity, yield/day, yield/day with respect to reproductive phase, biomass/day to plant growth and leaf area; days to flowering with days to maturity, length of reproductive phase and leaf area; plant height with pod length, pods/plant, seeds/pod, aerial biomass at maturity and yield/day with respect to reproductive phase; pod length with seeds/pod, yield/day and yield/day with respect to reproductive phase; pods/plant with seeds/pod, aerial biomass at maturity, yield/day, yield/day with respect to reproductive phase and biomass/day to plant growth; seeds/pod with yield/day and yield/day with respect to reproductive phase; length of reproductive phase with leaf area; aerial biomass at maturity with yield/day, yield/day with respect to reproductive phase, biomass/day to plant growth and leaf area; yield/day with yield/day with respect to reproductive phase and biomass/day to plant growth; yield/day with respect to reproductive phase with biomass/day to plant growth; leaf area with 100-seed weight showed significant phenotypic correlation and high genotypic correlation (Das, 2000). Significant negative phenotypic and high genotypic correlation of pod length with length of reproductive phase was observed.
Significant high positive correlation between seed yield and pods/plant have been reported by Baisakh (1992); Singh and Singh (1992); Das et al. (2004) in ricebean, which are in line with the present study. Positive correlation between seed yield and pods/plant was also reported by Pundiret al. (1992) and Mittal et al. (2007) in mungbean.Based on the association studies in the present study it could be observed that all the yield traits proposed by Wallace et al. (1993) have been speculated to be important traits for selection in
plants and are suitable characters for indirect selection in adzuki bean. The perusal of Table IIshowed significant phenotypic correlations and positive genotypic correlations of AGR and LAD with seed yield/plant. Das et al. (2004) in ricebean also reported the same. Chatterjee et al. (1987) also reported significant positive correlation of LAD with yield in ricebean.
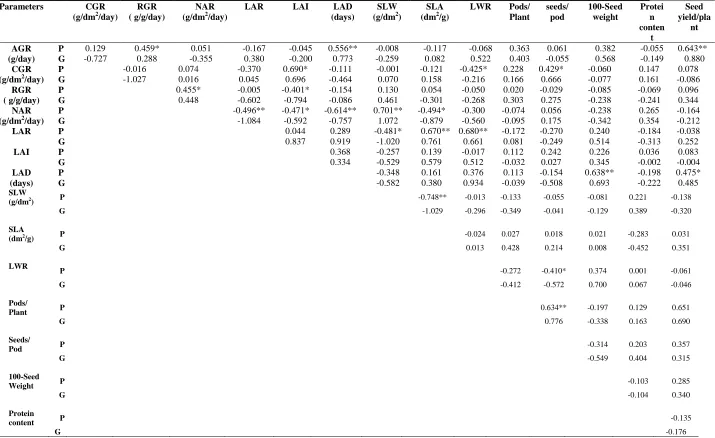
AGR has shown significant positive phenotypic correlation with RGR and LAD. CGR has shown significant positive phenotypic correlation with LAI, LWR and seeds/pod. NAR has shown significant negative phenotypic correlation with LAR, LAI, LAD and SLA while significant positive correlation with SLW and RGR. LAR has also shown significant negative correlation with SLW, while significant positive phenotypic correlation with SLA and LWR. SLW has shown significant negative phenotypic correlation with SLA. Das et al. (2004) in ricebean have reported positive correlation between CGR and LAI; LAI and LAD; LWR and LAD and negative correlation between NAR and LAR; SLA and SLW.Growth parameters CGR, RGR, LAR, LAI, SLA and LWR showed no correlation with seed yield/plant but CGR showed significant positive phenotypic correlation with seeds/pod. LAD has shown significant positive phenotypic correlation and high genotypic correlation with 100-seed weight while LWR has shown significant negative phenotypic correlation with seeds/pod. Das et al. (2004) has also reported no correlation between LAR and SLA with grain yield in ricebean.Thus, it can be concluded that AGR and LAD, are the most important growth parameters to facilitate identification of high yielding genotypes of adzuki bean.
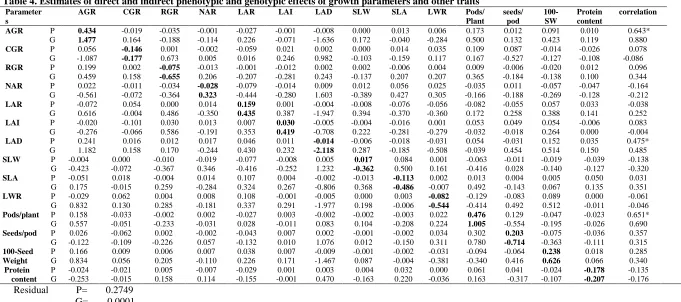
The path coefficient analysis of yield and other traits is presented in Table III&IV. Considering the path coefficient analysis of yield and other traits the role of days to flowering and days to maturity has not been revealed by path coefficients, since no direct and indirect effect has been observed through these traits. Aerial biomass at maturity, yield/day with respect to reproductive phase and biomass/day to plant growth showed significant phenotypic and high genotypic correlations with yield/plant, have high positive indirect effect through yield/day at both genotypic and phenotypic levels.
ISSN 0975-928X
243
this trait except days to maturity and proteincontent indicating the importance of this trait for indirect selection. Almost all the yield traits have contributed negatively through yield/day with respect to reproductive phase so care should be taken while making the selection. Sarmaet al. (1991) has reported high direct effect of days to maturity and pods/plant on seed yield in ricebean. All of these are contrary to the present results, where no high direct and indirect effects of these traits were observed.
Path coefficient analysis has thus revealed the significance of these four yield traits showing either very high direct effect or indirect effects through one of these four traits, indicating their significance for indirect selection as also has been exhibited by their correlations at phenotypic and genotypic levels.AGR has shown direct and indirect positive effect through pods/plant. LAD has shown high negative direct effect but positive indirect effect through AGR and 100-seed weight. Pods/plant and 100-seed weight showed direct and indirect positive effect through AGR (Table IV). High direct effect or indirect effects, as revealed by path coefficient analysis through these traits showed the importance of AGR and LAD for making selection,this has also been revealed by their high positive genotypic and significant phenotypic correlation with seed yield/plant. Chauhan et al. (2007) in urdbean and Sarkar and Das (2007) in cowpea reported high direct positive effect of pods/plant on seed yield. Das et al. (2004) in ricebean have reported high negative direct effect of LAD on yield/plant in ricebean.
Therefore, on the basis of study on correlations and path analysis, it can be concluded that aerial biomass at maturity, yield/day, yield/day with respect to reproductive phase, biomass/day to plant growth among the yield traits and AGR & LAD among the growth parameters and basic yield sub-component i.e.., pods/plant are the most important traits for making selection for yield improvement. Most of the yield traits as defined by Wallace et al. (1993) have come out to be the most effective traits for indirect selection for yield, of which capacity to synthesize total biomass, rate of yield and biomass accumulation are particularly significant.
References
Al-Jibouri, H.A., Miller, P.A. andRobinson,H.P. 1958. Genotypic and environmental variance and covariance in upland cotton cross of inter-specific origin. Agron. J.,50:633-36.
Baisakh, B. 1992. Interrelationship between yield and yield attributes in ricebean (Vignaumbellata). Indian J.Agri.Sci.,62:620-622.
Chatterjee, B. N.; Bhattacharya, K. K.; Miah, A. A.; Wallis, E. S. and Mlyth, D. F. 1987. Growth analysis of ricebean.In: Food Legume Improvement for Asian Farming System, Australian Centre for International Agriculture Research (Queensland), Australia 18:249
Chauhan, M.P., Mishra, A.C. and Singh, A.K. 2007.Correlation and path analysis in urd bean.Legume Res.,30 :205-208.
Das, Y. 2000. Genetic studies on growth and yield attributes in ricebean (Vignaumbellata Thumb, Ohwi and Ohashi). M .Sc. Thesis, CSKHPKV, Palampur
Das, Y., Thakur, S.R., Singh, K.P. and Sharma, S.K. 2004. Association among growth and yield parameters in rice bean (Vignaumbellata) genotypes. Indian J.Pl.Physio., 9: 94-97.
Deway,D.R. and Lu, K.H. 1959. A correlation and path coefficient analysis of components of crested Wheatgrassseed production. Agron. J.,51 :515-18.
Gupta, V.P., Pathik, S.R. and Kalia, N.R. 1980. An appraisal of research achievement for the genetic amelioration of mash, kulthi, rajmash, pigeonpea and adzuki bean in Himachal Pradesh during the last five years. All India kharif Workshop Conference held at Kanpur from 7th to 10th April. Mittal, V,P., Paramjit, S. and Brar, K.S. 2007. Component
characters influencing seed yield in moong bean (Vignaradiata L. Wilczek). Inter.J. Agri. Sci.,3: 80-81.
Pundir, S.R., Gupta, K.R. and Singh, V.P. 1992. Studies on correlation coefficient analysis in mungbean(Vignaradiata (L.)Wilczek).Haryana Agric. J.,22: 256-258.
Sarkar, A. and Das, B. 2007. Character association and path coefficient analysis in ricebean (VignaumbellataThumbOhwi and Ohashi) grown under terai region of West Bengal. J. Inter.Academica.,11: 258-264.
Sarma, B.K., Singh, M. and Pattanayak, A. 1991.Evaluation of ricebean (Vignaumbellata) germplasm in upland terraces of Meghalaya.Indian J. Agri.Sci,.61: 182-184. Singh, G. and Singh, M. 1992. Correlation and path
analysis in ricebean under mid altitude conditions. Crop Improv.,19: 152-154.
Thaware, B.L., Birari, S.P., Dhonukshe, B.L. and Jamadagni, B.M. 2000. Correlation between yield attributesin different environments in ricebean. Indian J. Agri. Res., 34 : 47-50.
ISSN 0975-928X
http://ejplantbreeding.com 244
Table 1. Phenotypic and genotypic correlation coefficient between yield and other traits
Traits
Days to maturit
y
Plant height (cm)
Pod length
(cm)
Pods/ plant
Seeds/ Pod
Length of reproduc tive phase
Aerial biomass
at maturity
Yield/ Day (g)
Yield/day with respect to reproductive
phase
Biomass/ day to
plant growth
Harvest index
Leaf area (cm2)
100- Seed Weight
(g)
Protein content (%)
Seed yield/ Plant (g)
Days to flowering
P
0.738** 0.201 -0.297 0.158 -0.020 0.708** 0.287 0.108 0.006 0.138 -0.090 0.441* -0.002 -0.119 0.248
G 0.976 -0.070 -0.673 0.249 -0.374 1.036 0.233 0.034 -0.168 0.041 0.010 0.542 -0.021 -0.142 0.208
Days to maturity
P 0.073 -0.359 0.083 -0.006 0.742** 0.101 -0.071 -0.209 -0.038 -0.054 0.321 -0.073 -0.069 0.069
G -0.293 -0.750 -0.063 -0.458 1.046 0.032 -0.204 -0.436 -0.162 -0.035 0.377 -0.120 -0.078 -0.005
Plant height P
0.632**
0.557**
0.533** -0.024 0.405* 0.373 0.399* 0.327 -0.113 0.174 0.082 0.145 0.359
G 0.717 0.355 0.556 -0.032 0.269 0.281 0.274 0.243 0.082 0.156 0.121 0.203 0.255
Pod length P 0.363
0.559** -0.513* 0.329 0.431* 0.503** 0.374 -0.009 -0.073 0.171 0.041 0.347
G 0.170 0.491 -0.665 0.271 0.395 0.511 0.395 0.055 -0.202 0.239 0.024 0.271
Pods/plant P
0.634** 0.020 0.641**
0.664** 0.659** 0.578** 0.042 0.103 -0.197 0.129 0.651**
G 0.776 0.054 0.672 0.689 0.673 0.698 0.195 0.027 -0.338 0.163 0.690
Seeds/pod P -0.148 0.345 0.387* 0.395* 0.361 0.027 -0.133 -0.314 0.203 0.357
G -0.225 0.338 0.385 0.426 0.437 0.040 -0.350 -0.549 0.404 0.315
Length of reproductive phase
P 0.069 -0.062 -0.236 -0.082 0.070 0.399* -0.052 -0.081 0.087
G 0.112 -0.068 -0.277 -0.058 0.052 0.440 -0.052 -0.091 0.117
Aerial biomass at maturity
P 0.891** 0.836** 0.918** -0.165 0.474* 0.333 -0.020 0.909**
G 0.907 0.834 0.982 -0.040 0.547 0.403 -0.046 0.929
Yield/day P 0.971** 0.835** 0.242 0.376 0.283 -0.097 0.984**
G 0.973 0.899 0.331 0.394 0.343 -0.133 0.982
Yield/day with respect to reproductive phase
P 0.819** 0.215 0.279 0.261 -0.056 0.921**
G 0.866 0.313 0.277 0.320 -0.077 0.911
Biomass/day to plant growth
P -0.178 0.335 0.301 0.062 0.825**
G -0.147 0.391 0.373 0.044 0.884
Harvest index P -0.045 -0.101 -0.246 0.240
G -0.083 -0.119 -0.326 0.338
Leaf area P 0.591** -0.109 0.447*
G 0.624 -0.133 0.474
100-Seed weight
P -0.103 0.285
G -0.104 0.340
Protein content
P -0.135
G -0.176
* Significant at 5% level; **Significant at 1% level
ISSN 0975-928X
http://ejplantbreeding.com 245
Parameters CGR
(g/dm2/day)
RGR ( g/g/day)
NAR (g/dm2/day)
LAR LAI LAD
(days)
SLW (g/dm2)
SLA (dm2/g)
LWR Pods/ Plant
seeds/ pod
100-Seed weight
Protei n conten
t
Seed yield/pla
nt AGR
(g/day)
P 0.129 0.459* 0.051 -0.167 -0.045 0.556** -0.008 -0.117 -0.068 0.363 0.061 0.382 -0.055 0.643** G -0.727 0.288 -0.355 0.380 -0.200 0.773 -0.259 0.082 0.522 0.403 -0.055 0.568 -0.149 0.880 CGR
(g/dm2/day)
P -0.016 0.074 -0.370 0.690* -0.111 -0.001 -0.121 -0.425* 0.228 0.429* -0.060 0.147 0.078
G -1.027 0.016 0.045 0.696 -0.464 0.070 0.158 -0.216 0.166 0.666 -0.077 0.161 -0.086
RGR ( g/g/day)
P 0.455* -0.005 -0.401* -0.154 0.130 0.054 -0.050 0.020 -0.029 -0.085 -0.069 0.096
G 0.448 -0.602 -0.794 -0.086 0.461 -0.301 -0.268 0.303 0.275 -0.238 -0.241 0.344
NAR (g/dm2/day)
P -0.496** -0.471* -0.614** 0.701** -0.494* -0.300 -0.074 0.056 -0.238 0.265 -0.164
G -1.084 -0.592 -0.757 1.072 -0.879 -0.560 -0.095 0.175 -0.342 0.354 -0.212
LAR P 0.044 0.289 -0.481* 0.670** 0.680** -0.172 -0.270 0.240 -0.184 -0.038
G 0.837 0.919 -1.020 0.761 0.661 0.081 -0.249 0.514 -0.313 0.252
LAI P 0.368 -0.257 0.139 -0.017 0.112 0.242 0.226 0.036 0.083
G 0.334 -0.529 0.579 0.512 -0.032 0.027 0.345 -0.002 -0.004
LAD (days)
P -0.348 0.161 0.376 0.113 -0.154 0.638** -0.198 0.475*
G -0.582 0.380 0.934 -0.039 -0.508 0.693 -0.222 0.485
SLW
(g/dm2) P -0.748** -0.013 -0.133 -0.055 -0.081 0.221 -0.138
G -1.029 -0.296 -0.349 -0.041 -0.129 0.389 -0.320
SLA
(dm2/g) P -0.024 0.027 0.018 0.021 -0.283 0.031
G 0.013 0.428 0.214 0.008 -0.452 0.351
LWR
P -0.272 -0.410* 0.374 0.001 -0.061
G -0.412 -0.572 0.700 0.067 -0.046
Pods/
Plant P 0.634** -0.197 0.129 0.651
G 0.776 -0.338 0.163 0.690
Seeds/
Pod P -0.314 0.203 0.357
G -0.549 0.404 0.315
100-Seed
Weight P -0.103 0.285
G -0.104 0.340
Protein
content P -0.135
G -0.176
* Significant at 5% level; **Significant at 1% level
ISSN 0975-928X
http://ejplantbreeding.com 246
Traits Days to
flowering
Days to maturity
Plant height
Pod length
Pods/ plant
Seeds /pod
Length of reproductive
phase
Aerial biomass
at maturity
Yield/ day
Yield/day with respect to reproductive
phase
Biomass/d ay to plant growth
Harvest index
Leaf area
100-Seed weight
Protein content
Correlation
Days to Flowering
P 0.084 0.010 -0.001 -0.002 0.000 0.000 0.005 0.032 0.127 -0.002 0.002 -0.004 -0.002 0.000 0.001 0.248
G 0.054 0.038 -0.001 0.013 -0.002 0.009 -0.055 0.035 0.047 0.086 -0.001 0.000 -0.014 0.000 0.000 0.208
Days to Maturity
P 0.062 0.013 -0.001 -0.002 0.000 0.000 0.005 0.011 -0.084 0.069 -0.001 -0.003 -0.001 0.000 0.001 0.069
G 0.052 0.039 -0.005 0.014 0.000 0.010 -0.055 0.005 -0.284 0.223 0.005 -0.001 -0.010 0.001 0.000 -0.005
Plant Height
P 0.017 0.001 -0.007 0.004 0.000 -0.004 0.000 0.045 0.439 -0.131 0.005 -0.006 -0.001 0.000 -0.002 0.359
G -0.004 -0.012 0.016 -0.014 -0.003 -0.013 0.002 0.040 0.391 -0.140 -0.007 0.004 -0.004 -0.001 0.000 0.255
Pod Length
P -0.025 -0.005 -0.005 0.006 0.000 -0.004 -0.003 0.036 0.507 -0.166 0.005 0.000 0.000 0.000 0.000 0.347
G -0.036 -0.030 0.011 -0.019 -0.001 -0.011 0.035 0.040 0.550 -0.262 -0.012 0.002 0.005 -0.002 0.000 0.271
Pods/ Plant
P 0.013 0.001 -0.004 0.002 -0.001 -0.005 0.000 0.071 0.782 -0.217 0.008 0.002 0.000 0.000 -0.001 0.651**
G 0.013 -0.002 0.006 -0.003 -0.008 -0.018 -0.003 0.100 0.959 -0.344 -0.021 0.008 -0.001 0.003 0.000 0.690
Seeds/ Pod
P -0.002 0.000 -0.004 0.003 0.000 -0.007 -0.001 0.038 0.456 -0.130 0.005 0.001 0.001 -0.001 -0.002 0.357
G -0.020 -0.018 0.009 -0.009 -0.006 -0.023 0.012 0.050 0.535 -0.218 -0.013 0.002 0.009 0.005 0.001 0.315
Length of reproductive Phase
P 0.059 0.010 0.000 -0.003 0.000 0.001 0.006 0.008 -0.073 0.078 -0.001 0.003 -0.002 0.000 0.001 0.087
G 0.055 0.041 -0.001 0.013 0.000 0.005 -0.053 0.017 -0.095 0.142 0.002 0.002 -0.011 0.001 0.000 0.117
Aerial biomass at maturity
P 0.024 0.001 -0.003 0.002 0.000 -0.003 0.000 0.110 1.049 -0.275 0.013 -0.008 -0.002 0.001 0.000 0.909**
G 0.012 0.001 0.004 -0.005 -0.005 -0.008 -0.006 0.149 1.262 -0.427 -0.029 -0.002 -0.014 -0.004 0.000 0.929
Yield/day P 0.009 -0.001 -0.003 0.003 0.000 -0.003 0.000 0.098 1.178 -0.320 0.012 0.012 -0.002 0.001 0.001 0.984**
G 0.002 -0.008 0.004 -0.008 -0.005 -0.009 0.004 0.135 1.391 -0.498 -0.027 0.014 -0.010 -0.003 0.000 0.982
Yield/day with respect to reproductive phase
P 0.000 -0.003 -0.003 0.003 0.000 -0.003 -0.002 0.092 1.143 -0.329 0.011 0.011 -0.001 0.001 0.001 0.921**
G -0.009 -0.017 0.004 -0.010 -0.005 -0.010 0.015 0.124 1.353 -0.512 -0.026 0.014 -0.007 -0.003 0.000 0.911
Biomass/day to plant growth
P 0.012 -0.001 -0.002 0.002 0.000 -0.003 -0.001 0.101 0.983 -0.270 0.014 -0.009 -0.002 0.001 -0.001 0.825**
G 0.002 -0.006 0.004 -0.007 -0.005 -0.010 0.003 0.146 1.250 -0.443 -0.030 -0.006 -0.010 -0.004 0.000 0.884
Harvest index P -0.007 -0.001 0.001 0.000 0.000 0.000 0.000 -0.018 0.285 -0.071 -0.002 0.050 0.000 0.000 0.003 0.240
G 0.001 -0.001 0.001 -0.001 -0.002 -0.001 -0.003 -0.006 0.460 -0.160 0.004 0.043 0.002 0.001 0.000 0.338
Leaf area P 0.037 0.004 -0.001 0.000 0.000 0.001 0.003 0.052 0.443 -0.092 0.005 -0.002 -0.005 0.001 0.001 0.447*
G 0.029 0.015 0.002 0.004 0.000 0.008 -0.023 0.082 0.547 -0.142 -0.012 -0.004 -0.026 -0.006 0.000 0.474
100-Seed weight
P 0.000 -0.001 -0.001 0.001 0.000 0.002 0.000 0.037 0.333 -0.086 0.004 -0.005 -0.003 0.002 0.001 0.285
G 0.000 -0.001 -0.001 0.001 0.000 0.002 0.000 0.037 0.333 -0.086 0.004 -0.005 -0.003 0.002 0.001 0.340
Protein content
P -0.010 -0.001 -0.001 0.000 0.000 -0.001 -0.001 -0.002 -0.115 0.018 0.001 -0.012 0.000 0.000 -0.011 -0.135
G -0.010 -0.001 -0.001 0.000 0.000 -0.001 -0.001 -0.002 -0.115 0.018 0.001 -0.012 0.000 0.000 -0.011 -0.176
Residual P
= 0.0019
G
= -0.0005
ISSN 0975-928X
http://ejplantbreeding.com 247
Table 4. Estimates of direct and indirect phenotypic and genotypic effects of growth parameters and other traits Parameter
s
AGR CGR RGR NAR LAR LAI LAD SLW SLA LWR Pods/
Plant
seeds/ pod
100- SW
Protein content
correlation
AGR P 0.434 -0.019 -0.035 -0.001 -0.027 -0.001 -0.008 0.000 0.013 0.006 0.173 0.012 0.091 0.010 0.643*
G 1.477 0.164 -0.188 -0.114 0.226 -0.071 -1.636 0.172 -0.040 -0.284 0.500 0.132 0.423 0.119 0.880
CGR P 0.056 -0.146 0.001 -0.002 -0.059 0.021 0.002 0.000 0.014 0.035 0.109 0.087 -0.014 -0.026 0.078
G -1.087 -0.177 0.673 0.005 0.016 0.246 0.982 -0.103 -0.159 0.117 0.167 -0.527 -0.127 -0.108 -0.086
RGR P 0.199 0.002 -0.075 -0.013 -0.001 -0.012 0.002 0.002 -0.006 0.004 0.009 -0.006 -0.020 0.012 0.096
G 0.459 0.158 -0.655 0.206 -0.207 -0.281 0.243 -0.137 0.207 0.207 0.365 -0.184 -0.138 0.100 0.344
NAR P 0.022 -0.011 -0.034 -0.028 -0.079 -0.014 0.009 0.012 0.056 0.025 -0.035 0.011 -0.057 -0.047 -0.164
G -0.561 -0.072 -0.364 0.323 -0.444 -0.280 1.603 -0.389 0.427 0.305 -0.166 -0.188 -0.269 -0.128 -0.212
LAR P -0.072 0.054 0.000 0.014 0.159 0.001 -0.004 -0.008 -0.076 -0.056 -0.082 -0.055 0.057 0.033 -0.038
G 0.616 -0.004 0.486 -0.350 0.435 0.387 -1.947 0.394 -0.370 -0.360 0.172 0.258 0.388 0.141 0.252
LAI P -0.020 -0.101 0.030 0.013 0.007 0.030 -0.005 -0.004 -0.016 0.001 0.053 0.049 0.054 -0.006 0.083
G -0.276 -0.066 0.586 -0.191 0.353 0.419 -0.708 0.222 -0.281 -0.279 -0.032 -0.018 0.264 0.000 -0.004
LAD P 0.241 0.016 0.012 0.017 0.046 0.011 -0.014 -0.006 -0.018 -0.031 0.054 -0.031 0.152 0.035 0.475*
G 1.182 0.158 0.170 -0.244 0.430 0.232 -2.118 0.287 -0.185 -0.508 -0.039 0.454 0.514 0.150 0.485
SLW P -0.004 0.000 -0.010 -0.019 -0.077 -0.008 0.005 0.017 0.084 0.001 -0.063 -0.011 -0.019 -0.039 -0.138
G -0.423 -0.072 -0.367 0.346 -0.416 -0.252 1.232 -0.362 0.500 0.161 -0.416 0.028 -0.140 -0.127 -0.320
SLA P -0.051 0.018 -0.004 0.014 0.107 0.004 -0.002 -0.013 -0.113 0.002 0.013 0.004 0.005 0.050 0.031
G 0.175 -0.015 0.259 -0.284 0.324 0.267 -0.806 0.368 -0.486 -0.007 0.492 -0.143 0.067 0.135 0.351
LWR P -0.029 0.062 0.004 0.008 0.108 -0.001 -0.005 0.000 0.003 -0.082 -0.129 -0.083 0.089 0.000 -0.061
G 0.832 0.130 0.285 -0.181 0.337 0.291 -1.977 0.198 -0.006 -0.544 -0.414 0.492 0.512 -0.011 -0.046
Pods/plant P 0.158 -0.033 -0.002 0.002 -0.027 0.003 -0.002 -0.002 -0.003 0.022 0.476 0.129 -0.047 -0.023 0.651*
G 0.557 -0.051 -0.233 -0.031 0.028 -0.011 0.083 0.104 -0.208 0.224 1.005 -0.554 -0.195 -0.026 0.690
Seeds/pod P 0.026 -0.062 0.002 -0.002 -0.043 0.007 0.002 -0.001 -0.002 0.034 0.302 0.203 -0.075 -0.036 0.357
G -0.122 -0.109 -0.226 0.057 -0.132 0.010 1.076 0.012 -0.150 0.311 0.780 -0.714 -0.363 -0.111 0.315
100-Seed Weight
P 0.166 0.009 0.006 0.007 0.038 0.007 -0.009 -0.001 -0.002 -0.031 -0.094 -0.064 0.238 0.018 0.285
G 0.834 0.056 0.205 -0.110 0.226 0.171 -1.467 0.087 -0.004 -0.381 -0.340 0.416 0.626 0.066 0.340
Protein content
P -0.024 -0.021 0.005 -0.007 -0.029 0.001 0.003 0.004 0.032 0.000 0.061 0.041 -0.024 -0.178 -0.135
G -0.253 -0.015 0.158 0.114 -0.155 -0.001 0.470 -0.163 0.220 -0.036 0.163 -0.317 -0.107 -0.207 -0.176
Residual P= 0.2749 G= -0.0001