R E V I E W
Open Access
Scale development: ten main limitations
and recommendations to improve future
research practices
Fabiane F. R. Morgado
1*, Juliana F. F. Meireles
2, Clara M. Neves
2, Ana C. S. Amaral
3and Maria E. C. Ferreira
2Abstract
The scale development process is critical to building knowledge in human and social sciences. The present paper aimed (a) to provide a systematic review of the published literature regarding current practices of the scale development process, (b) to assess the main limitations reported by the authors in these processes, and (c) to provide a set of recommendations for best practices in future scale development research. Papers were selected in September 2015, with the search terms“scale development”and“limitations”from three databases: Scopus, PsycINFO, and Web of Science, with no time restriction. We evaluated 105 studies published between 1976 and 2015. The analysis considered the three basic steps in scale development: item generation, theoretical analysis, and psychometric analysis. The study identified ten main types of limitation in these practices reported in the literature: sample characteristic limitations, methodological limitations, psychometric limitations, qualitative research
limitations, missing data, social desirability bias, item limitations, brevity of the scale, difficulty controlling all variables, and lack of manual instructions. Considering these results, various studies analyzed in this review clearly identified methodological weaknesses in the scale development process (e.g., smaller sample sizes in psychometric analysis), but only a few researchers recognized and recorded these limitations. We hope that a systematic
knowledge of the difficulties usually reported in scale development will help future researchers to recognize their own limitations and especially to make the most appropriate choices among different conceptions and
methodological strategies.
Keywords:Assessment, Measurement, Psychometrics, Reliability, Validity
Introduction
In recent years, numerous measurement scales have been developed to assess attitudes, techniques, and interventions in a variety of scientific applications (Meneses et al. 2014). Measurement is a fundamental activity of science, since it enables researchers to ac-quire knowledge about people, objects, events, and processes. Measurement scales are useful tools to attribute scores in some numerical dimension to phe-nomena that cannot be measured directly. They con-sist of sets of items revealing levels of theoretical variables otherwise unobservable by direct means (DeVellis 2003).
A variety of authors (Clark and Watson 1995; DeVellis 2003; Nunnally 1967; Pasquali 2010) have agreed that the scale development process involves complex and sys-tematic procedures that require theoretical and meth-odological rigor. According to these authors, the scale development process can be carried out in three basic steps.
In the first step, commonly referred as “item gener-ation,”the researcher provides theoretical support for the initial item pool (Hutz et al. 2015). Methods for the initial item generation can be classified as deductive, inductive, or a combination of the two. Deductive methods involve item generation based on an extensive literature review and pre-existing scales (Hinkin 1995). On the other hand,
inductive methods base item development on qualitative
information regarding a construct obtained from opinions gathered from the target population—e.g., focus groups,
* Correspondence:[email protected]
1Institute of Education, Universidade Federal Rural do Rio de Janeiro, BR-465, km 7, Seropédica, Rio de Janeiro 23890-000, Brazil
Full list of author information is available at the end of the article
interviews, expert panels, and qualitative exploratory re-search methodologies (Kapuscinski and Masters 2010). The researcher is also concerned with a variety of parame-ters that regulate the setting of each item and of the scale as a whole. For example, suitable scale instructions, an appropriate number of items, adequate display format, ap-propriate item redaction (all items should be simple, clear, specific, ensure the variability of response, remain unbiased, etc.), among other parameters (DeVellis 2003; Pasquali 2010).
In the second step, usually referred to as the“theoretical analysis,” the researcher assesses the content validity of the new scale, ensuring that the initial item pool reflects the desired construct (Arias et al. 2014). A content validity assessment is required, since inferences are made based on the final scale items. The item content must be deemed valid to instill confidence in all consequent inferences. In order to ensure the content validity, the researcher seeks other opinions about the operationalized items. The opin-ions can be those of expert judges (experts in the develop-ment scales or experts in the target construct) or target population judges (potential users of the scale), enabling the researcher to ensure that the hypothesis elaborated in the research appropriately represents the construct of interest (Nunnally 1967).
In the last step, psychometric analysis, the researcher should assess whether the new scale has construct valid-ity and reliabilvalid-ity. Construct validvalid-ity is most directly re-lated to the question of what the instrument is in fact measuring—what construct, trait, or concept underlies an individual’s performance or score on a measure (Churchill 1979). This refers to the degree to which inferences can be legitimately made from the observed scores to the theoretical constructs about which these observations are supposed to contain information (Podsakoff et al. 2013). Construct validity can be assessed with the use of exploratory factor analysis (EFA), confirmatory factor analysis (CFA), or with convergent, discriminant, predictive/nomological, criterion, internal, and external validity. In turn, reliability is a measure of score consistency, usually measured by use of internal consistency, test-retest reliability, split-half, item-total cor-relation/inter-item reliability, and inter-observer reliability (DeVellis 2003). To ensure construct validity and reliabil-ity, the data should be collected in a large and appropri-ately representative sample of the target population. It is a common rule of thumb that there should be at least 10 participants for each item of the scale, making an ideal of 15:1 or 20:1 (Clark and Watson 1995; DeVellis 2003; Hair Junior et al. 2009).
Although the literature on theoretical and methodo-logical care in scale development is extensive, many limi-tations have been identified in the process. These include failure to adequately define the construct domain,
failure to correctly specify the measurement model, underutilization of some techniques that are helpful in establishing construct validity (MacKenzie et al. 2011), relatively weak psychometric properties, applicability to only a single form of treatment or manual, extensive time required to fill out the questionnaire (Hilsenroth et al. 2005), inappropriate item redaction, too few items and participants in the construction and analysis, an im-balance between items that assess positive beliefs and those that assess negative beliefs (Prados 2007), social de-sirability bias (King and Bruner 2000), among others.
These limitations in the scale development process weaken the obtained psychometric results, limiting the future applicability of the new scale and hindering its generalizability. In this sense, knowledge of the most often reported limitations is fundamental in providing essential information to help develop best practices for future research in this area. The purpose of this article is threefold: (a) to provide a systematic review of the pub-lished literature regarding some current practices of the scale development process, (b) to assess the main limita-tions reported by the authors in this process, and (c) to provide a set of recommendations for best practices in future scale development research.
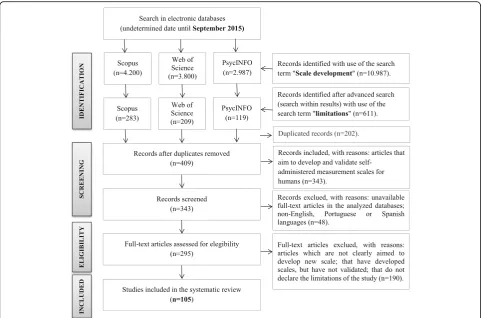
Review Method
This systematic review identified and selected papers from three databases: Scopus, PsycINFO, and Web of Science. There was no time restriction in the literature search, which was completed in September 1, 2015. The following search term was used: “scale develop-ment.” In the set of databases analyzed, the search was done inclusively in “Any Field” (PsycINFO), in “Article Title, Abstract, Keywords” (Scopus), or in any “Topic” (Web of Science). In addition, we used an advanced search to filter the articles in (search within results), with the search term “limitations” identified in “Any Field”in all databases. Both terms were used in English only. Four reviewers evaluated the papers in an independ-ent and blinded way. Any disagreemindepend-ents on eligibility of a particular study were resolved through consensus among reviewers.
the validation of instruments for other languages), (d) papers with unvalidated scales, and (e) articles that did not declare the limitations of the study.
Results
In all, this systematic review evaluated 105 studies lished between 1976 and 2015. Most (88.5%) was pub-lished between 2005 and 2015, and only two studies date from the last century. We analyzed two major issues: (a) current practices of the scale development process —consi-dering the three steps usually reported in the literature (step 1—item generation, step 2—theoretical analysis, step 3—psychometric analysis), the number of participants in step 3, the number of items in the beginning scale, and the number of items in the final scale; (b) main limitations reported by the authors in the scale development
pro-cess—considering the limitations observed and recorded
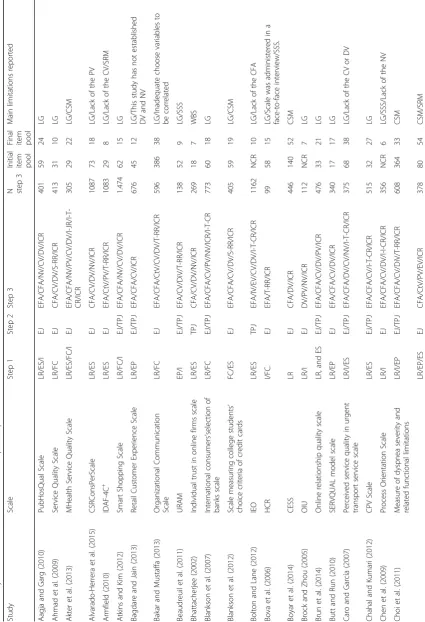
by the authors during the scale development process. The description of these results can be found in Table 1.
Current practices of the scale development process
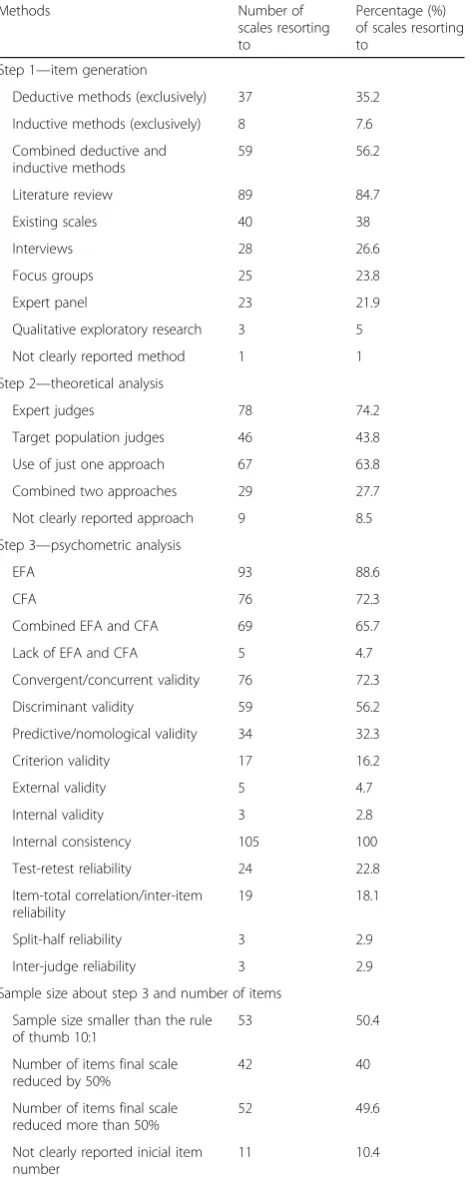
Step 1—item generation In the first step, 35.2% (n= 37) of the studies reported using exclusively deductive methods
to write items, 7.6% (n= 8) used only inductive methods, and 56.2% (n= 59) combined deductive and inductive strat-egies. The majority of the studies used a literature review (84.7%,n= 89) as the deductive method in item generation. In inductive methods, 26.6% of studies (n= 28) chose to conduct an interview.
Step 2—theoretical analysis In order to theoretically refine the items, several studies used opinions of experts (74.2%, n= 78), whereas others used target population opinions (43.8%, n= 46). In addition, 63.8% (n= 67) of the studies used only one of these approaches (expert or population judges).
Step 3—psychometric analysisThe most common ana-lyses that have been used to assess construct validity are EFA (88.6%, n= 93), CFA (72.3%, n= 76), conver-gent validity (72.3%, n= 76), and discriminant validity (56.2%, n= 59). Most studies opted to combine EFA and CFA (65.7%, n= 69). Only 4.7% (n= 5) failed to use factor analysis in their research. In relation to study reliability, internal consistency checks were used by all studies and test-retest reliability was the second most commonly used technique (22.8%, n= 24).
Table 1 Systematic review of the scale development process recorded in 105 included studies Study Scal e Step 1 St ep 2 Step 3 N step 3
Initial item pool Final item pool
Sample size in step 3 and number of items Interest-ingly, 50.4% (n= 53) of the studies used sample sizes smaller than the rule of thumb, which is a minimum of 10 participants for each item in the scale. Regarding number of items, the majority of the studies (49.6%, n= 52) lost more than 50% of the initial item pool during the valid-ation process.
Table 2 summarizes and provides more details on our findings regarding the current practices in the scale development.
Main limitations reported in the scale development process
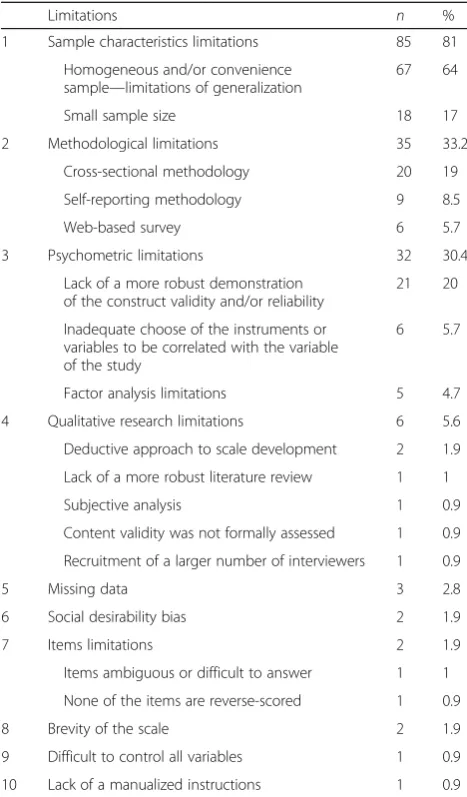
As result of this systematic review, we found ten main limitations commonly referenced in the scale develop-ment process: (1) sample characteristic limitations—-cited by 81% of the studies, (2) methodological limitations—33.2%, (3) psychometric limitations—30.4%, (4) qualitative research limitations—5.6%, (5) missing data—2.8%, (6) social desirability bias—1.9%, (7) item limitations—1.9%, (8) brevity of the scale—1.9%, (9) diffi-culty controlling all variables—0.9%, and (10) lack of manual instructions—0.9%. Table 3 summarizes these findings.
Discussion
This systematic review was primarily directed at identi-fying the published literature regarding current practices of the scale development. The results show a variety of practices that have been used to generate and assess items, both theoretically and psychometrically. We eval-uated these current practices, considering three distinct steps (item generation, theoretical analysis, and psycho-metric analysis). We also considered the relationship between sample size and number of items, since this is considered an important methodological aspect to be evaluated during the scale development process. The results are discussed together with recommendations for best practices in future scale development research.
Current practices of the scale development process—findings and research implications
Regarding step 1, item generation, our results show that, although several studies used exclusively deductive methods (e.g., Henderson-King and Henderson-King 2005; Kim et al. 2011), the majority (e.g., Bakar and Mustaffa 2013; Uzunboylu and Ozdamli 2011) combined deductive and inductive methods, a combination consist-ent with the recommended strategy for the creation of new measures (DeVellis 2003). These findings, however, differ from previous critical reviews of scale develop-ment practices, which found that most of the reported studies used exclusively deductive methods (Hinkin 1995; Kapuscinski and Masters 2010; Ladhari 2010). This is particularly important since the quality of
Table 2Summary of current practices of the scale
development process
Methods Number of
scales resorting to
Percentage (%) of scales resorting to
Step 1—item generation
Deductive methods (exclusively) 37 35.2
Inductive methods (exclusively) 8 7.6
Combined deductive and inductive methods
59 56.2
Literature review 89 84.7
Existing scales 40 38
Interviews 28 26.6
Focus groups 25 23.8
Expert panel 23 21.9
Qualitative exploratory research 3 5
Not clearly reported method 1 1
Step 2—theoretical analysis
Expert judges 78 74.2
Target population judges 46 43.8
Use of just one approach 67 63.8
Combined two approaches 29 27.7
Not clearly reported approach 9 8.5
Step 3—psychometric analysis
EFA 93 88.6
CFA 76 72.3
Combined EFA and CFA 69 65.7
Lack of EFA and CFA 5 4.7
Convergent/concurrent validity 76 72.3
Discriminant validity 59 56.2
Predictive/nomological validity 34 32.3
Criterion validity 17 16.2
External validity 5 4.7
Internal validity 3 2.8
Internal consistency 105 100
Test-retest reliability 24 22.8
Item-total correlation/inter-item reliability
19 18.1
Split-half reliability 3 2.9
Inter-judge reliability 3 2.9
Sample size about step 3 and number of items
Sample size smaller than the rule of thumb 10:1
53 50.4
Number of items final scale reduced by 50%
42 40
Number of items final scale reduced more than 50%
52 49.6
Not clearly reported inicial item number
11 10.4
generated items depends on the way that the construct is defined. Failing to adequately define the conceptual domain of a construct causes several problems related to poor construct definition, leading to, for example, (a) confusion about what the construct does and does not refer to, including the similarities and differences between it and other constructs that already exist in the field, (b) indicators that may either be deficient or con-taminated, and (c) invalid conclusions about relation-ships with other constructs (MacKenzie et al. 2011). Considering that item generation may be the most important part of the scale development process, future measures should be developed using the appropriate def-inition of the conceptual domain based on the combin-ation of both deductive and inductive approaches.
Our results suggest that literature review was the most widely used deductive method (e.g., Bolton and Lane
2012; Henderson-King and Henderson-King 2005). This is consistent with the views of several other researchers who have systematically reviewed scales (Bastos et al. 2010; Ladhari 2010; Sveinbjornsdottir and Thorsteinsson 2008). Nevertheless, this finding differs from another study (Kapuscinski and Masters 2010) that found that the most common deductive strategies were reading works by spiritual leaders, theory written by psycholo-gists, and discussion among authors. Literature review should be considered central for the enumeration of the constructs. It also serves to clarify the nature and variety of the target construct content. In addition, literature re-views help to identify existing measures that can be used as references to create new scales (Clark and Watson 1995; DeVellis 2003). In this sense, future research should consider the literature review as the initial and necessary deductive step foundational to building a new scale.
This review also highlights the fact that interviews and focus groups were the most widely used inductive methods (e.g., Lin and Hsieh 2011; Sharma 2010). Similar results were found in the systematic review by Kapuscinski and Masters (2010), Sveinbjornsdottir and Thorsteinsson (2008), and Ladhari (2010). These findings have particular relevance to future researchers, since they emphasize the importance of using methodological strategies that consider the opinions of the target population. Despite the fact that a panel of experts contributes widely to increasing the re-searchers’ confidence in the content validity of the new scale, it is important to also consider the most original and genuine information about the construct of interest, which can be best obtained through reports obtained from inter-views and focus groups with the target population.
Related to step 2, theoretical analysis, the results of this review indicate that expert judges have been the most widely utilized tool for analyzing content validity (e.g., Uzunboylu and Ozdamli 2011; Zheng et al. 2010). Previous studies have also found expert opinion to be the most common qualitative method for the elimin-ation of unsuitable items (Kapuscinski and Masters 2010; Ladhari 2010). In the literature review conducted by Hardesty and Bearden (2004), the authors highlighted the importance of these experts to carefully analyze the initial item pool. They suggested that any research using new, changed, or previously unexamined scale items, should at a minimum be judged by a panel of experts. However, the authors also point out the apparent lack of consistency in the literature in terms of how researchers use the opinions of expert judges in aiding the decision of whether or not to retain items for a scale. Given this inconsistency, the authors developed guidelines regard-ing the application of different decision rules to use for item retention. For example, the “sumscore decision rule,” defined as the total score for an item across all —
Limitations n %
1 Sample characteristics limitations 85 81
Homogeneous and/or convenience sample—limitations of generalization
67 64
Small sample size 18 17
2 Methodological limitations 35 33.2
Cross-sectional methodology 20 19
Self-reporting methodology 9 8.5
Web-based survey 6 5.7
3 Psychometric limitations 32 30.4
Lack of a more robust demonstration of the construct validity and/or reliability
21 20
Inadequate choose of the instruments or variables to be correlated with the variable of the study
6 5.7
Factor analysis limitations 5 4.7
4 Qualitative research limitations 6 5.6
Deductive approach to scale development 2 1.9
Lack of a more robust literature review 1 1
Subjective analysis 1 0.9
Content validity was not formally assessed 1 0.9
Recruitment of a larger number of interviewers 1 0.9
5 Missing data 3 2.8
6 Social desirability bias 2 1.9
7 Items limitations 2 1.9
Items ambiguous or difficult to answer 1 1
None of the items are reverse-scored 1 0.9
8 Brevity of the scale 2 1.9
9 Difficult to control all variables 1 0.9
judges, is considered by the authors to be the most ef-fective in predicting whether an item should be included in a scale and appears, therefore, to be a reasonable rule for researchers to employ.
Future research in developing scales should be con-cerned, not only with opinions from experts but also with the opinions of the target population. The results of this review show that only a minority of studies con-sidered the review of the scales’ items by members of the target population (e.g., Uzunboylu and Ozdamli 2011; Zheng et al. 2010). In addition, a smaller minority combined the two approaches in the assessment of item content (e.g., Mahudin et al. 2012; Morgado et al. 2014). The limited use of target population opinions is a prob-lem. A previous study of systematic scale development reviews found that the opinion of these people is the basis for content validity (Bastos et al. 2010). As highlighted by Clark and Watson (1995) and Malhotra (2004), it is essential for the new scale to undergo prior review by members of the target population. Pre-test or pilot study procedures make it possible to determine respondents’ opinions of, and reactions to, each item on the scale, enabling researchers to identify and eliminate potential problems in the scale before it is applied at large.
Another problem noted in this systematic review was that some studies failed to clearly report how they per-formed the theoretical analysis of the items (e.g., Glynn et al. 2015; Gottlieb et al. 2014). We hypothesized that the authors either did not perform this analysis or found it unimportant to record. Future research should con-sider this analysis, as well as all subsequent analyses, necessary and relevant for reporting.
Almost all studies (95.3%) reported using at least one type of factor analysis—EFA or CFA—in step 3, psychometric analysis (e.g., Sewitch et al. 2003; Tanimura et al. 2011). Clark and Watson (1995) consider that “unfortunately, many test developers are hesitant to use factor analysis, ei-ther because it requires a relatively large number of respon-dents or because it involves several perplexing decisions” (p. 17). They emphasized the importance of the researcher’s need to understand and apply this analysis,“it is important that test developers either learn about the technique or consult with a psychometrician during the scale develop-ment process”(Clark and Watson 1995, p. 17). This ques-tion seems to have been almost overcome in recent studies, since the vast majority of the analyzed studies used the factor analysis method.
Among the studies than used factor analysis, the ma-jority chose to use EFA (e.g., Bakar and Mustaffa 2013; Turker 2009). Similar to our findings, Bastos et al. (2010) and Ladhari (2010) found EFA to be the more commonly utilized construct validity method when com-pared to CFA. EFA has extensive value because it is
considered to be effective in identifying the underlying latent variables or factors of a measure by exploring rela-tionships among observed variables. However, it allows for more subjectivity in the decision-making process than many other statistical procedures, which can be considered a problem (Roberson et al. 2014).
For more consistent results on the psychometric indi-ces of the new scale, DeVellis (2003) indicates the com-bined use of EFA and CFA, as was performed with most studies evaluated in this review. In CFA, the specific hy-pothesized factor structure proposed in EFA (including the correlations among the factors) is statistically evalu-ated. If the estimated model fits the data, then a re-searcher concludes that the factor structure replicates. If not, the modification indices are used to identify where constraints placed on the factor pattern are causing a misfit (Reise et al. 2000). Future studies should consider the combined use of EFA and CFA during the evaluation of construct validity of the new measure, and should also apply a combination of multiple fit indices (e.g., modifi-cation indices) in order to provide more consistent psychometric results.
With regard to reliability, all studies reported internal consistency statistics (Cronbach’s alpha) for all subscales and/or the final version of the full scale (e.g., Schlosser and McNaughton 2009; Sewitch et al. 2003). These find-ings are consistent with those of previous review studies (Bastos et al. 2010; Kapuscinski and Masters 2010). DeVellis (2003) explains that internal consistency is the most widely used measure of reliability. It is concerned with the homogeneity of the items within a scale. Given its importance, future studies should to consider alpha evaluation as a central point of measurement reliability, and yet, as much as possible, involve the assessment of internal consistency with other measures of reliability. In the sequence of internal consistency, the following methods were identified by this review: test-retest reli-ability (analysis of the temporal streli-ability; items are applied on two separate occasions, and the scores could be correlated) (e.g., Forbush et al. 2013), item-total/in-ter-item correlation reliability (analysis of the correlation of each item with the total score of the scale or sub-scales/analysis of the correlation of each item with an-other item) (e.g., Rodrigues and Bastos 2012), split-half reliability (the scale is split in half and the first half of the items are compared to the second half ) (e.g., Uzun-boylu and Ozdamli 2011), and inter-judge reliability (analysis of the consistency between two different observers when they assess the same measure in the same individual) (e.g., Akter et al. 2013; DeVellis 2003; Nunnally 1967).
Regarding sample size in step 3 and number of items, a particularly noteworthy finding was that most studies utilized sample sizes smaller than the rule of thumb that the minimum required ratio should be 10:1 (e.g., Turker 2009; Zheng et al. 2010). DeVellis (2003) and Hair Junior et al. (2009) comment that the sample size should be as large as possible to ensure factor stability. The ‘ observa-tions to variables’ ratio is ideal at 15:1, or even 20:1. However, most of the studies included in this review failed to adopt this rule. Some studies looked for justification on evidence related to the effectiveness of much smaller ob-servations to variables ratios. For example, Nagy et al. (2014) justified the small sample size used in their investi-gation based on the findings of Barrett and Kline (1981), concluding that the difference in ratios 1.25:1 and 31:1 was not a significant contributor to results obtained in the factor stability. Additionally, Arrindell and van der Ende (1985) concluded that ratios of 1.3:1 and 19.8:1 did not impact the factor stability. Although the rules of thumb vary enormously, ten participants to each item has widely been considered safe recommended (Sveinbjornsdottir and Thorsteinsson 2008).
Finally, several studies had their number final of items reduced by more than 50%. For example, Flight et al. (2011) developed an initial item pool composed of 122
items and finished the scale with only 43. Pommer et al. (2013) developed 391 initial items and finished with only 18. Our findings clearly indicate that a significant amount of items can get lost during the development of a new scale. These results are consistent with previous literature which states both that the initial number of items must be twice the desired number in the final scale, since, during the process of analysis of the items, many may be excluded for inadequacy (Nunnally 1967), and that the initial set of items should be three or four times more numerous than the number of items desired, as a good way to ensure internal consistency of the scale (DeVellis 2003). Future research should consider these issues and expect significant loss of items during the scale development process.
Ten main limitations reported in the scale development process—findings and research implications
In addition to identifying the current practices of the scale development process, this review also aims to assess the main limitations reported by the authors. Ten limitations were found, which will be discussed together with recommendations for best practices in future scale development research (Table 3).
Sample characteristic limitationsThe above-mentioned limitations were recorded in the majority of the studies, in two main ways. The first and the most representative way was related to the sample type. Several studies used homogeneous sampling (e.g., Forbush et al. 2013; Morean et al. 2012), whereas others used convenience sampling (e.g., Coker et al. 2011; Flight et al. 2011). Both homogeneous and convenience samples were re-lated to limitations of generalization. For example, Atkins and Kim (2012) pointed out that “the partici-pants for all stages of the study were US consumers; therefore, this study cannot be generalized to other cultural contexts.”Or indeed,“convenience samples are weaknesses of this study, as they pose generalizability questions,” as highlighted by Blankson et al. (2012). Nunnally (1967) sug-gested that, to extend the generalizability of the new scale, sample diversification should be considered in terms of data collection, particularly in the psychometric evaluation step. Future studies should consider this suggestion, recruiting heterogeneous and truly random samples for the evaluation of construct validity and the reliability of the new measure.
“the current study was limited by the relatively small nonprobability sample of university students,” and Ho and Lin (2010) recognized that “the respondent sample size was small.” Based in these results, we emphasize that future research should seek a larger sample size (minimum ratio of 10:1) to increase the credibility of the results and thus obtain a more exact outcome in the psychometric analysis.
Methodological limitations Cross-sectional methods were the main methodological limitations reported by other studies (e.g., Schlosser and McNaughton 2009; Tombaugh et al. 2011). Data collected under a cross-sectional study design contains the typical limitation associated with this type of research methodology, namely inability to determine the causal relationship. If cross-sectional methods are used to estimate models whose parameters do in fact vary over time, the resulting estimation may fail to yield statistically valid results, fail to identify the true model parameters, and produce inef-ficient estimates (Bowen and Wiersema 1999). In this way, different authors (e.g., Akter et al. 2013; Boyar et al. 2014) recognized that employing instruments at one point in time limits the ability to assess causal relation-ships. With the goal of remediating these issues and gaining a deeper understanding of the construct of inter-est, different studies (e.g., Morean et al. 2012; Schlosser and McNaughton 2009) suggest conducting a longitu-dinal study during the scale development. Using the lon-gitudinal studies in this process may also allow the assessment of the scale’s predictive validity, since longi-tudinal designs evaluate whether the proposed interpret-ation of test scores can predict outcomes of interest over time. Therefore, future studies should consider the lon-gitudinal approach in the scale development, both to facilitate greater understanding of the analyzed variables and to assess the predictive validity.
Self-reporting methodologies were also cited as limita-tions in some studies (e.g., Fisher et al. 2014; Pan et al. 2013). Mahudin et al. (2012) clarified that the self-reporting nature of quantitative studies raises the possibil-ity of participant bias, social desirabilpossibil-ity, demand charac-teristics, and response sets. Such possibilities may, in turn, affect the validity of the findings. We agree with the authors’suggestion that future research may also incorp-orate other objective or independent measures to supple-ment the subjective evaluation of the variables studied in the development of the new scale and to improve the interpretation of findings.
In addition, web-based surveys were another methodo-logical limitation reported in some studies (e.g., Kim et al. 2011; Reed et al. 2011). Although this particular method has time- and cost-saving elements for data col-lection, its limitations are also highlighted. Researchers
have observed that important concerns include coverage bias (bias due to sampled individuals not having—or choosing not to access—the Internet) and nonresponse bias (bias due to participants of a survey differing from those who did not respond in terms of demographic or attitudinal variables) (Kim et al. 2011). Alternatives to minimize the problem in future research would be in-person surveys or survey interviews. Although more costly and more time consuming, these methods reduce problems related to concerns about confidentiality and the potential for coverage and nonresponse bias (Reed et al. 2011). Therefore, whenever possible, in-person surveys or survey interviews should be given priority in future research rather than web surveys.
Psychometric limitations Consistent with previous reports (MacKenzie et al. 2011; Prados 2007), this sys-tematic review found distinct psychometric limitations reported in the scale development process. The lack of a more robust demonstration of construct validity and/or reliability was the most often mentioned limitation in the majority of the analyzed studies. For example, Alvarado-Herrera et al. (2015) reported the lack of a more robust demonstration of the predictive validity whereas Kim et al. (2011) of the nomological validity. Caro and Garcia (2007) noted that the relationships of the scale with other constructs were not analyzed. Saxena et al. (2015) and Pan et al. (2013) described the lack of demonstrable temporal stability (e.g., test-retest reliability). Imprecise or incomplete psychometric proce-dures that are employed during scale development are likely to obscure the outcome. Therefore, it is necessary for future research to consider adverse consequences for the reliability and validity of any construct, caused by poor test-theoretical practices. Only through detailed information and explanation of the rationale for statis-tical choices can the new measures be shown to have sufficient psychometric adjustments (Sveinbjornsdottir and Thorsteinsson 2008).
constructs of interest. Future researchers should seek support from the literature on the constructs that would be theoretically associated with the construct of interest, searching for alternatives in information collected on, for example, sociodemographic questionnaires, to assess the convergent validity of the new scale.
Another psychometric limitation reported in some studies was related to factor analysis. These limitations were identified in five main forms: (1) EFA and CFA were conducted using the data from the same sample (Zheng et al. 2010)—when this occurs, good model fit in the CFA is expected, as a consequence, the added strength of the CFA in testing a hypothesized structure for a new data set based on theory or previous findings is lost (Khine 2008); (2) lack of CFA (Bolton and Lane 2012)—if this happens, the researcher loses the possibil-ity of assigning items to factors, testing the hypothesized structure of the data, and statistically comparing alterna-tive models (Khine 2008); (3) a certain amount of sub-jectivity was necessary in identifying and labeling factors in EFA (Lombaerts et al. 2009)—since a factor is qualita-tive, it is common practice to label each factor based on an interpretation of the variables loading most heavily on it; the problem is that these labels are subjective in nature, represent the authors’ interpretation, and can vary typically from 0.30 to 0.50 (Gottlieb et al. 2014; Khine 2008); (4) the initial unsatisfactory factor analysis output (Lombaerts et al. 2009); and (5) lack of a more robust CFA level (Jong et al. 2014) taken together— -when the study result distances itself from statistical results expected for EFA (e.g., KMO, Bartlett test of sphericity) and/or CFA (e.g., CFI, GFI, RMSEA), it results in an important limitation, since the tested ex-ploratory and theoretical models are not considered valid (Khine 2008). Taking these results, future studies should consider the use of separate samples for EFA and CFA, the combination of EFA and CFA, the definition of objective parameters to label factors, and about the con-sideration for unsatisfactory results of EFA and CFA, seeking alternatives to better fit the model.
Qualitative research limitationsThis review also found reported limitations on the qualitative approach of the analyzed studies. The first limitation was related to the exclusive use of the deductive method to generate items. It is noteworthy that, although most of the studies in-cluded in this review used exclusively deductive methods to generate items, only two studies recognized this as a limitation (Coleman et al. 2011; Song et al. 2011). Both studies used only the literature review to generate and operationalize the initial item pool. The authors recog-nized the importance of this deductive method to theor-etically operationalize the target construct, but they noted that, “for further research, more diverse views
should be considered to reflect more comprehensive perspectives of human knowledge-creating behaviors to strengthen the validity of the developed scales” (Song et al. 2011, p. 256) and, “a qualitative stage could have been used to generate additional items […]. This could also have reduced measurement error by using specific language the population used to communicate” (Coleman et al. 2011; p. 1069). Thus, the combination of deductive and inductive ap-proaches (e.g., focus groups or interviews) in item generation is again suggested in future research.
In addition, it is also necessary that the researcher consider the quality of the reviewed literature. Napoli et al. (2014, p. 1096) reported limitations related to the loss of a more robust literature review, suggesting that the scale developed in the study may have been incor-rectly operationalized:“Yet some question remains as to whether cultural symbolism should form part of this scale. Perhaps the way in which the construct was ini-tially conceptualized and operationalized was incorrect.” The incorrect operation of the construct compromises the psychometric results of scale and its applicability in future studies.
Another limitation involves the subjective analysis of the qualitative research. Fisher et al. (2014, p. 488) pointed out that the qualitative methods (literature re-views and interre-views) used to develop and conceptualize the construct were the main weaknesses of the study, “this research is limited by […] the nature of qualitative research in which the interpretations of one researcher may not reflect those of another.”The authors explained that, due to the potential for researcher bias when inter-preting data, it has been recognized that credible results are difficult to achieve. Nevertheless, subjective analysis is the essence and nature of qualitative studies. Some precautions in future studies can be taken to rule out potential researcher bias, such as attempts at neutral-ity. This is not always possible, however, and this limitation will remain a common problem in any qualitative study.
In turn, Sewitch et al. (2003, p. 260) reported that fail-ure to formally assess content validity was a limitation. The reason given was budgetary constraints. It is worth-while to remember that the content validity is an important step to ensure confidence in any inferences made using the final scale form. Therefore, it is neces-sarily required in any scale development process.
planning the use of multiple interviewers should consider potential resulting bias.
Missing data In connection, missing data was another issue reported by some studies included in this system-atic review (e.g., Glynn et al. 2015; Ngorsuraches et al. 2007). Such limitations typically occur across different fields of scientific research. Missing data includes num-bers that have been grouped, aggregated, rounded, censored, or truncated, resulting in partial loss of infor-mation (Schafer and Graham 2002). Collins et al. (2001) clarified that when researchers are confronted with miss-ing data, they run an increased risk of reachmiss-ing incorrect conclusions. This is because missing data may bias par-ameter estimates, inflate type I and type II error rates, and degrade the performance of confidence intervals. The authors also explained that, “because a loss of data is nearly always accompanied by a loss of information, missing values may dramatically reduce statistical power” (p. 330). Therefore, future researchers who wish to mitigate these risks during the scale development must pay close attention to the missing data aspect of the analysis and choose their strategy carefully.
Statistical methods to solve the problem of missing data have improved significantly, as demonstrated by Schafer and Graham (2002), although misconceptions still remain abundant. Several methods to deal with missing data were reviewed, issues raised, and advice offered for those that remain unresolved. Considering the fact that a more detailed discussion of the statistics dealing with missing data is beyond of the scope of this article, more details about missing data analysis can be found in Schafer and Graham (2002).
Social desirability bias Another limitation reported in some studies (Bova et al. 2006; Ngorsuraches et al. 2007) and identified in this systematic review is social desir-ability bias. This type of bias is considered to be a systematic error in self-reporting measures resulting from the desire of respondents to avoid embarrassment and project a favorable image to others (Fisher 1993). According to King and Bruner (2000), social desirability bias is an important threat to the validity of research employing multi-item scales. Provision of socially desir-able responses in self-reported data may lead to spurious correlations between variables, as well as the suppression or moderation of relationships between the constructs of interest. Thus, one aspect of scale validity, which should be of particular concern to researchers, is the potential threat of contamination due to social-desirability re-sponse bias. To remedy this problem, we agree with the authors that it is incumbent upon researchers to identify situations in which data may be systematically biased to-ward the respondents’ perceptions of what is socially
acceptable, to determine the extent to which this repre-sents contamination of the data, and to implement the most appropriate methods of control. Details on methods for identifying, testing for, and/or preventing social desir-ability bias are beyond the scope of this article, but can be found at King and Bruner (2000).
Item limitations In comparison with at least one previ-ous study (Prados 2007), our findings reflect some potential item limitations. Firstly, items that were am-biguous or difficult to answer were the main weaknesses reported by Gottlieb et al. (2014). On this issue, the lit-erature dealing with the necessary caution in wording the items is extensive. For example, items must clearly define the problem being addressed, must be as simple as possible, express a single idea, and use common words that reflect the vocabulary level of the target population. Items should not be inductors or have alter-native or underlying assumptions. They must be free of generalizations and estimates, and be written to ensure the variability of responses. In writing the items, the re-searcher should avoid using fashionable expressions and colloquialisms or other words or phrases that impair un-derstanding for groups of varying ages, ethnicities, reli-gions, or genders. Furthermore, the items should be organized properly. For example, the opening questions should be simple and interesting to win the trust of the subjects. The most delicate, complex, or dull questions should be asked at the end of the sequence (Clark and Watson 1995; Malhotra 2004; Pasquali 2010).
Furthermore, Cicero et al. (2010) reported that the main limitation of their study was the fact that none of the items were reverse-scored. Although some method-ologists claim that reverse scoring is necessary to avoid acquiescence among participants, this advice should be taken with caution. There are reports that the reverse-scored items may be confusing to participants, that the opposite of a construct reverse-scored may be funda-mentally different than the construct, that reverse-scored items tend to be the worst fitting items in factor analyses, or that the factor structure of scales includes a factor with straightforward wording compared to a reverse-scored factor (Cicero et al. 2010). Awareness of these issues is necessary for future researchers to choose between avoiding acquiescence among participants or preventing a number of other problems related to the use of reverse scores.
they require less time from respondents. However, very short scales can in fact seriously compromise the reli-ability of the instrument (Raykov 2008). To the extent that the researcher removes items of the scale, the Cron-bach’s alpha tends to decrease. It is valuable to remem-ber that the minimum acceptable alpha should be at least 0.7, while an alpha value between 0.8 and 0.9 is considered ideal. Scales with many items tend to be more reliable, with higher alpha values (DeVellis 2003). In this context, future researchers should prioritize scales with enough items to keep the alpha within the acceptable range. Although many items may be lost dur-ing theoretical and psychometric analysis, an alternative already mentioned in this study would be to begin the initial item pool with at least twice the desired items of the final scale.
Difficulty controlling all variables In addition to all limitations reported, Gottlieb et al. (2014) mentioned a common limitation in different research fields—the diffi-culty of controlling all the variables that could influence the central construct of the study. The authors reported that “it may be that there are other variables that influ-ence visitors’perception of trade show effectiveness that were not uncovered in the research”and suggest“future research might yield insights that are not provided here” (p. 104). The reported limitation calls attention to the importance of the first step—item generation—in the scale development process. A possible remedy to this issue would be to know the target construct in detail during the item generation, allowing for all possible and important variables to be investigated and controlled. However, this is not always possible. Even using induct-ive and deductinduct-ive approaches to generate items (litera-ture review and interview), the authors still reported that limitation. In this light, future researchers must use care in hypothesizing and testing potential variables that could be controlled during construction of the scale development process.
Lack of manual instructions Finally, this review found a weakness reported on the loss of manualized instruc-tions that regulate the data analysis. Saxena et al. (2015, p. 492) pointed out that the initial version of the new scale“did not contain manualized instructions for raters, so it lacked objective anchor points for choosing specific ratings on many of its questions”. Therefore, an import-ant detail that should have the attention of future re-searchers are instructions that determine the application methods of the new scale. Pasquali (2010) suggests that when drafting the instructions, the researcher should de-fine the development of operational strategies that will enable the application of the instrument and the format in which it will be presented and decide both how the
subject’s response will be given for each item and the way that the respondent should answer each item. The researcher should also define how the scale scores would be analyzed. In addition, the instructions need to be as short as possible without confusion to the subjects of the target population, should contain one or more exam-ples of how the items should be answered, and should ensure that the subject is free of any related tension or anxiety.
Study limitations and strengths
This review itself is subject to some limitations that should be taken into consideration. First, during the selection of the articles included in the analysis, we may have missed some studies that could have been identified by using other terms related to “scale development.” This may have impacted our findings. However, applica-tion of this term alone was recommended by its wide-spread use by researchers in the area (Clark and Watson 1995; DeVellis 2003; Hinkin 1995; Nunnally 1967) and by the large number of publications identified with this descriptor in the period evaluated, as compared with those screened with correlates (e.g., “development of questionnaire” and “development of measure”). In the same way, we may also have missed numerous studies that, despite recording their weaknesses, did not have the search term “limitations” indexed in the analyzed databases. We could have reduced this limitation by also using the search term ‘weakness’ or a similar word for selection and inclusion of several other articles. How-ever, a larger number of included studies would hinder the operationalization of our findings.
Second, particularly regarding analysis of items and re-liability, we lost information about the basic theories that support the scale development process: classical test theory (CTT)—known as classical psychometry—and item response theory (IRT)—known as modern psych-ometry (PASQUALI 2010). Although it was beyond the scope of this article to examine these theories, informa-tion on the employability of one or the other could con-tribute to a deeper understanding of their main limitations. Future studies could focus on CTT and IRT, compare the applicability of both, and identify their main limitations in the scale development process.
Still, our review is current with studies published until September 2015. As new evidence emerges on current practices and limitations reported in the scale develop-ment process, revisions to this systematic review and practice guideline would be required in future studies.
carried out in most systematic review studies, but across various fields. With this variety of conceptions, we hope to assist future researchers in different areas of human and social sciences in making the most appropriate choice between strategies.
Second, this study differs from most studies of scale de-velopment revision, since it primarily considers the con-ceptions of the authors themselves about the main difficulties and mistakes made during the scale develop-ment process in their own studies. We hope to contribute to the efforts of future researchers, based on the know-ledge of previous mistakes. While several weaknesses in scale development research were identified, specific rec-ommendations for future research relevant to particular previously dimensions discussed were embedded within the appropriate sections throughout the article.
We observe that, although some weaknesses have been clearly identified in the scale development practices of many studies, only a few researchers recognized and recorded these limitations. This was evidenced in the large number of studies using exclusively deductive ap-proaches to generate the initial item pool and the limited number of studies that recognized this as a limitation, or there were a large number of studies using smaller sample sizes than recommended in the literature for psychometric analysis and the limited number of studies that reported this issue as a limitation. Considering the observed dis-tance between the limitation and its recognition, it is important that future researchers are comfortable with the detailed process of developing a new measure, espe-cially as it pertains to avoiding theoretical and/or meth-odological mistakes, or at least, if they occur, to mention them as limitations.
Conclusions
In conclusion, the present research reviews numerous stud-ies that both proposed current practices of the scale devel-opment process and also reported its main limitations. A variety of conceptions and methodological strategies and ten mains limitations were identified and discussed along with suggestions for future research. In this way, we believe that this paper makes important contributions to the litera-ture, especially because it provides a comprehensive set of recommendations to increase the quality of future practices in the scale development process.
Authors’contributions
FFRM is responsible for all parts of this manuscript, from its conception to the final writing. JFFM, CMN, ACSA and MECF participated in the data collection, analysis and interpretation of data and critical review of the manuscript. All authors read and approved the final manuscript.
Competing interests
The authors declare that they have no competing interest.
Author details
1Institute of Education, Universidade Federal Rural do Rio de Janeiro, BR-465, km 7, Seropédica, Rio de Janeiro 23890-000, Brazil.2Faculty of Psychology, Universidade Federal de Juiz de Fora, Rua José Lourenço Kelmer, s/ n—Campus Universitário Bairro São Pedro, Juiz de Fora, Minas Gerais 36036-900, Brazil.3Faculty of Physical Education of the Instituto Federal de Educação, Ciência e Tecnologia do Sudeste de Minas Gerais, Av. Luz Interior, n 360, Estrela Sul, Juiz de Fora, Minas Gerais 36030-776, Brazil.
Received: 3 August 2016 Accepted: 22 December 2016
References
Aagja, J. P., & Garg, R. (2010). Measuring perceived service quality for public
hospitals (PubHosQual) in the Indian context.International Journal of
Pharmaceutical and Healthcare Marketing, 4(10), 60–83. http://dx.doi.org/ 10.1108/17506121011036033.
Ahmad, N., Awan, M. U., Raouf, A., & Sparks, L. (2009). Development of a service
quality scale for pharmaceutical supply chains.International Journal of
Pharmaceutical and Healthcare Marketing, 3(1), 26–45. http://dx.doi.org/10. 1108/17506120910948494.
Akter, S., D’Ambra, J., & Ray, P. (2013). Development and validation of an
instrument to measure user perceived service quality of mHealth.Information
and Management, 50, 181–195. http://dx.doi.org/10.1016/j.im.2013.03.001. Alvarado-Herrera, A, Bigne, E, Aldas-Manzano, J, & Curras-Perez, R. (2015). A scale
for measuring consumer perceptions of corporate social responsibility
following the sustainable development paradigm.Journal of Business Ethics,
1-20. doi: http://dx.doi.org/10.1007/s10551-015-2654-9
Arias, M. R. M., Lloreda, M. J. H., & Lloreda, M. V. H. (2014).Psicometría. S.A.: Alianza Editorial
Armfield, J. M. (2010). Development and psychometric evaluation of the
Index of Dental Anxiety and Fear (IDAF-4C+).Psychological Assessment,
22(2), 279–287. http://dx.doi.org/10.1037/a0018678.
Arrindell, W. A., & van der Ende, J. (1985). An empirical-test of the utility of the
observations-to-variables ratio in factor and components analysis.Applied
Psychological Measurement, 9(2), 165–178. http://dx.doi.org/10.1177/ 014662168500900205.
Atkins, K. G., & Kim, Y. (2012). Smart shopping: conceptualization and
measurement.International Journal of Retail and Distribution Management,
40(5), 360–375. http://dx.doi.org/10.1108/09590551211222349.
Bagdare, S., & Jain, R. (2013). Measuring retail customer experience.International
Journal of Retail and Distribution Management, 41(10), 790–804. http://dx.doi. org/10.1108/IJRDM-08-2012-0084.
Bakar, H. A., & Mustaffa, C. S. (2013). Organizational communication in Malaysia
organizations.Corporate Communications: An International Journal, 18(1), 87–
109. http://dx.doi.org/10.1108/13563281311294146.
Barrett, P. T., & Kline, P. (1981). The observation to variable ratio in factor analysis. Personality Study and Group Behavior, 1, 23–33.
Bastos, J. L., Celeste, R. K., Faerstein, E., & Barros, A. J. D. (2010). Racial
discrimination and health: a systematic review of scales with a focus on their
psychometric properties.Social Science and Medicine, 70, 1091–1099. http://
dx.doi.org/10.1016/j.socscimed.2009.12.20.
Beaudreuil, J, Allard, A, Zerkak, D, Gerber, RA, Cappelleri, JC, Quintero, N, Lasbleiz,
S,…Bardin, T. (2011). Unite’Rhumatologique des Affections de la Main
(URAM) Scale: development and validation of a tool to assess Dupuytren’s
disease–specific disability.Arthritis Care & Research, 63(10), 1448-1455. doi:
http://dx.doi.org/10.1002/acr.20564
Bhattacherjee, A. (2002). Individual trust in online firms: scale development and
initial test.Journal of Management Information Systems, 19(1), 211–241. http://
dx.doi.org/10.1080/07421222.2002.11045715.
Blankson, C., Cheng, J. M., & Spears, N. (2007). Determinants of banks selection in
USA, Taiwan and Ghana.International Journal of Bank Marketing, 25(7), 469–
489. http://dx.doi.org/10.1108/02652320710832621.
Blankson, C., Paswan, A., & Boakye, K. G. (2012). College students’consumption of
credit cards.International Journal of Bank Marketing, 30(7), 567–585. http://dx.
doi.org/10.1108/02652321211274327.
Bolton, D. L., & Lane, M. D. (2012). Individual entrepreneurial orientation:
development of a measurement instrument.Education + Training, 54(2/3),
219–233. http://dx.doi.org/10.1108/00400911211210314.
strategy research: limitations of cross-sectional analysis and some
methodological alternatives.Strategic Management Journal, 20, 625–636.
Boyar, S. L., Campbell, N. S., Mosley, D. C., Jr., & Carson, C. M. (2014). Development
of a work/family social support measure.Journal of Managerial Psychology,
29(7), 901–920. http://dx.doi.org/10.1108/JMP-06-2012-0189.
Brock, J. K., & Zhou, Y. (2005). Organizational use of the internet.Internet Research,
15(1), 67–87. http://dx.doi.org/10.1108/10662240510577077.
Brun, I., Rajaobelina, L., & Ricard, L. (2014). Online relationship quality: scale
development and initial testing.International Journal of Bank Marketing, 32(1),
5–27. http://dx.doi.org/10.1108/IJBM-02-2013-0022.
Butt, M. M., & Run, E. C. (2010). Private healthcare quality: applying a SERVQUAL
model.International Journal of Health Care Quality Assurance, 23(7), 658–673.
http://dx.doi.org/10.1108/09526861011071580.
Caro, L. M., & García, J. A. M. (2007). Measuring perceived service quality in urgent
transport service.Journal of Retailing and Consumer Services, 14, 60–72. http://
dx.doi.org/10.1016/j.jretconser.2006.04.001.
Chahal, H., & Kumari, N. (2012). Consumer perceived value.International
Journal of Pharmaceutical and Healthcare Marketing, 6(2), 167–190. http://dx.doi.org/10.1108/17506121211243086.
Chen, H., Tian, Y., & Daugherty, P. J. (2009). Measuring process orientation.The
International Journal of Logistics Management, 20(2), 213–227. http://dx.doi. org/10.1108/09574090910981305.
Choi, S. W., Victorson, D. E., Yount, S., Anton, S., & Cella, D. (2011). Development of a conceptual framework and calibrated item banks to measure
patient-reported dyspnea severity and related functional limitations.Value in Health,
14, 291–306. http://dx.doi.org/10.1016/j.jval.2010.06.001.
Christophersen, T., & Konradt, U. (2012). Development and validation of a formative and a reflective measure for the assessment of online store
usability.Behaviour and Information Technology, 31(9), 839–857. http://dx.doi.
org/10.1080/0144929X.2010.529165.
Churchill, G. (1979). A paradigm for developing better measures of marketing
constructs.Journal of Marketing Research, 16(1), 64–73. http://dx.doi.org/10.
2307/3150876.
Cicero, D. C., Kerns, J. G., & McCarthy, D. M. (2010). The Aberrant Salience
Inventory: a new measure of psychosis proneness.Psychological Assessment,
22(3), 688–701. http://dx.doi.org/10.1037/a0019913.
Clark, L. A., & Watson, D. (1995). Constructing validity: basic issues in objective
scale development.Psychological Assessment, 7(3), 309–319. http://dx.doi.org/
10.1037/1040-3590.7.3.309.
Coker, B. L. S., Ashill, N. J., & Hope, B. (2011). Measuring internet product purchase
risk.European Journal of Marketing, 45(7/8), 1130–1151. http://dx.doi.org/10.
1108/03090561111137642.
Coleman, D., Chernatony, L., & Christodoulides, G. (2011). B2B service brand
identity: scale development and validation.Industrial Marketing Management,
40, 1063–1071. http://dx.doi.org/10.1016/j.indmarman.2011.09.010.
Collins, L. M., Schafer, J. L., & Kam, C.-M. (2001). A comparison of inclusive and
restrictive strategies in modern missing data procedures.Psychological
Methods, 6(4), 330–351. http://dx.doi.org/10.1037/1082-989X.6.4.330. Colwell, S. R., Aung, M., Kanetkar, V., & Holden, A. L. (2008). Toward a measure of
service convenience: multiple-item scale development and empirical test. Journal of Services Marketing, 22(2), 160–169. http://dx.doi.org/10.1108/ 08876040810862895.
Cossette, S., Cara, C., Ricard, N., & Pepin, J. (2005). Assessing nurse–patient
interactions from a caring perspective: report of the development and
preliminary psychometric testing of the Caring Nurse–Patient Interactions
Scale.International Journal of Nursing Studies, 42, 673–686. http://dx.doi.
org/10.1016/j.ijnurstu.2004.10.004.
Dennis, R. S., & Bocarnea, M. (2005). Development of the servant leadership
assessment instrument.Leadership and Organization Development Journal,
26(8), 600–615. http://dx.doi.org/10.1108/01437730510633692.
DeVellis, R. F. (2003).Scale development: theory and applications(2nd ed.).
Newbury Park: Sage Publications.
Devlin, J. F., Roy, S. K., & Sekhon, H. (2014). Perceptions of fair treatment in
financial services.European Journal of Marketing, 48(7/8), 1315–1332.
http://dx.doi.org/10.1108/EJM-08-2012-0469.
Dunham, A., & Burt, C. (2014). Understanding employee knowledge: the
development of an organizational memory scale.The Learning Organization,
21(2), 126–145. http://dx.doi.org/10.1108/TLO-04-2011-0026.
Edwards, J. R., Knight, D. K., Broome, K. M., & Flynn, P. M. (2010). The development and validation of a transformational leadership survey for substance use
– org/10.3109/10826081003682834.
Feuerstein, M., Nicholas, R. A., Huang, G. D., Haufler, A. J., Pransky, G., & Robertson, M. (2005). Workstyle: development of a measure of response to work in
those with upper extremity pain.Journal of Occupational Rehabilitation, 15(2),
87–104. http://dx.doi.org/10.1007/s10926-005-3420-0.
Fisher, R. J. (1993). Social desirability bias and the validity of indirect
questioning.Journal of Consumer Research, 20(2), 303–315. http://dx.doi.
org/10.1086/209351.
Fisher, R., Maritz, A., & Lobo, A. (2014). Evaluating entrepreneurs’perception of
success.International Journal of Entrepreneurial Behavior and Research, 20(5),
478–492. http://dx.doi.org/10.1108/IJEBR-10-2013-0157.
Flight, R. L., D’Souza, G., & Allaway, A. W. (2011). Characteristics-based innovation
adoption: scale and model validation.Journal of Product and Brand
Management, 20(5), 343–355. http://dx.doi.org/10.1108/10610421111157874. Forbush, KT, Wildes, JE, Pollack, LO, Dunbar, D, Luo, J, Patterson, P, Petruzzi,
L,…Watson, D. (2013). Development and validation of the Eating
Pathology Symptoms Inventory (EPSI).Psychological Assessment, 25(3),
859-878. doi: http://dx.doi.org/10.1037/a0032639.
Foster, J. D., McCain, J. L., Hibberts, M. F., Brunell, A. B., & Johnson, B. (2015). The grandiose narcissism scale: a global and facet-level measure of
grandiose narcissism.Personality and Individual Differences, 73, 12–16.
http://dx.doi.org/10.1016/j.paid.2014.08.042.
Franche, R., Corbière, M., Lee, H., Breslin, F. C., & Hepburn, G. (2007). The readiness for return-to-work (RRTW) scale: development and validation of a self-report staging
scale in lost-time claimants with musculoskeletal disorders.Journal of Occupational
Rehabilitation, 17, 450–472. http://dx.doi.org/10.1007/s10926-007-9097-9. Gesten, E. L. (1976). A health resources inventory: the development of a measure
of the personal and social competence of primary-grade children.Journal of
Consulting and Clinical Psychology, 44(5), 775–786. http://dx.doi.org/10.1037/ 0022-006X.44.5.775.
Gibbons, C. J., Kenning, C., Coventry, P. A., Bee, P., Bundy, C., Fisher, L., & Bower, P. (2013). Development of a Multimorbidity Illness Perceptions Scale (MULTIPleS). PloS One, 8(12), e81852. http://dx.doi.org/10.1371/journal.pone.0081852. Gligor, D. M., & Holcomb, M. (2014). The road to supply chain agility: an RBV
perspective on the role of logistics capabilities.The International Journal of Logistics
Management, 25(1), 160–179. http://dx.doi.org/10.1108/IJLM-07-2012-0062. Glynn, N. W., Santanasto, A. J., Simonsick, E. M., Boudreau, R. M., Beach, S. R.,
Schulz, R., & Newman, A. B. (2015). The Pittsburgh fatigability scale for older
adults: development and validation.Journal of American Geriatrics Society, 63,
130–135. http://dx.doi.org/10.1111/jgs.13191.
Gottlieb, U., Brown, M., & Ferrier, L. (2014). Consumer perceptions of trade show
effectiveness.European Journal of Marketing, 48(1/2), 89–107. http://dx.doi.
org/10.1108/EJM-06-2011-0310.
Hair Junior, J. F., Black, W. C., Babin, N. J., Anderson, R. E., & Tatham, R. L. (2009). Análise multivariada de dados(6ath ed.). São Paulo: Bookman.
Hall, M. A., Camacho, F., Dugan, E., & Balkrishnan, R. (2002). Trust in the medical
profession: conceptual and measurement issues.Health Services Research,
37(5), 1419–1439. http://dx.doi.org/10.1111/1475-6773.01070.
Han, H., Back, K., & Kim, Y. (2011). A multidimensional scale of switching barriers
in the full-service restaurant industry.Cornell Hospitality Quarterly, 52(1), 54–-63.
http://dx.doi.org/10.1177/1938965510389261.
Hardesty, D. M., & Bearden, W. O. (2004). The use of expert judges in scale development Implications for improving face validity of measures of
unobservable constructs.Journal of Business Research, 57, 98–107. http://dx.
doi.org/10.1016/S0148-2963(01)00295-8.
Henderson-King, D., & Henderson-King, E. (2005). Acceptance of cosmetic surgery:
scale development and validation.Body Image, 2, 137–149. http://dx.doi.org/
10.1016/j.bodyim.2005.03.003.
Hernandez, J. M. C., & Santos, C. C. (2010). Development-based trust: proposing and validating a new trust measurement model for buyer-seller relationships. Brazilian Administration Review, 7(2), 172–197. http://dx.doi.org/10.1590/ S1807-76922010000200005.
Hildebrandt, T., Langenbucher, J., & Schlundt, D. G. (2004). Muscularity concerns
among men: development of attitudinal and perceptual measures.Body
Image, 1, 169–181. http://dx.doi.org/10.1016/j.bodyim.2004.01.001. Hilsenroth, M. J., Blagys, M. D., Ackerman, S. J., Bonge, D. R., & Blais, M. A.
(2005). Measuring psychodynamic-interpersonal and cognitive-behavioral techniques: development of the comparative psychotherapy process
scale.Psychotherapy: Theory, Research, Practice, Training, 42(3), 340–356.