RESEARCH LETTER
A digital elevation model for simulating
the 1945 Makran tsunami in Karachi Harbour
Haider Hasan
1*, Brian F. Atwater
2and Shoaib Ahmed
1Abstract
The digital elevation model documented here provides a tool for calibrating tsunami models to effects of the 1945 Makran tsunami that were observed in Karachi Harbour. The DEM bathymetry is derived from soundings made mainly during the first 8 years post-tsunami. While deficient in its portrayal of interior tidelands and upland topography, the DEM accurately represents the setting of a tide gauge that recorded the 1945 tsunami.
Keywords: Tsunami, Makran, Karachi, Bathymetry
© The Author(s) 2018. This article is distributed under the terms of the Creative Commons Attribution 4.0 International License (http://creat iveco mmons .org/licen ses/by/4.0/), which permits unrestricted use, distribution, and reproduction in any medium, provided you give appropriate credit to the original author(s) and the source, provide a link to the Creative Commons license, and indicate if changes were made.
Background
Simulations of historical tsunamis can be improved by using archival bathymetry, shorelines, and topography. Examples include the use of historical nautical charts in making a digital elevation model (DEM) for computer modeling of the 1960 Chilean tsunami in Hawaii (Tang et al. 2006). DEMs are commonly developed to support tsunami modeling (Eakins and Taylor 2010).
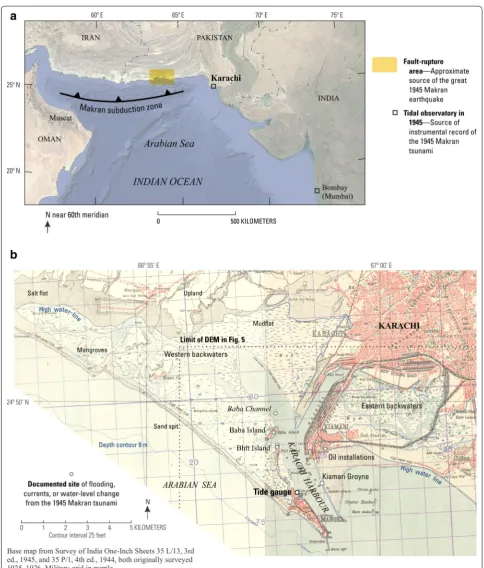
This paper derives a preliminary DEM for simulating the 1945 Makran tsunami in Karachi Harbour (Fig. 1). Nautical charts and topographic maps from the middle of the twentieth century allow the DEM to approximate physiography that the 1945 tsunami encountered. The intended application is computer simulation of the tsuna-mi’s effects, which have been compiled elsewhere from a tide-gauge record, newspaper accounts, and testimony of elderly residents. We call the DEM preliminary because of several limitations, particularly in representing inte-rior tidal flats, mangroves, and uplands. A data file of the gridded DEM is presented in Hasan et al. (2018).
The paper is illustrated by maps of the soundings used and considered (Fig. 2), a graph of vertical datums (Fig. 3), a map showing where data were interpolated separately (Fig. 4), a simplified color version of the DEM (Fig. 5), and details in the vicinity of the Karachi tide
gauge (Fig. 6). Electronic supplements provide scans of the main nautical chart and topographic map used (Additional file 1: Figures S1 and S2), tabulate digitized soundings that were used in the DEM (Additional file 2: Table S1), and list additional soundings considered (Addi-tional file 2: Table S2). Control points used in georefer-encing the historical maps can be found in the Appendix (Table 1) and on a supplementary map (Additional file 1: Figure S3). The supplements also include a map compari-son between the preliminary DEM and archival bathym-etric contours (Additional file 1: Figure S4).
Tsunami observations in Karachi Harbour
At the time of the 1945 tsunami, Karachi was a com-mercial center, a provincial capital, and a port city. The urban population, in a 1941 census, had recently passed 400,000 (Lambrick 1942, p. 16, 22). The port, from war-time expansion, had been handling record tonnage (Brow 1947).
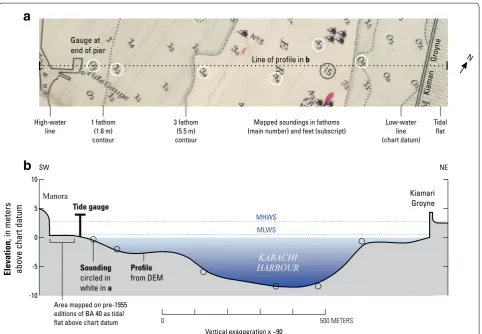
The tsunami’s effects in Karachi Harbour are evidenced by a tide-gauge record, newspaper accounts, and eyewit-ness testimony. The Karachi tidal observatory is one of the two—the other being in Bombay (Mumbai)—where the 1945 tsunami was recorded instrumentally (Neetu et al. 2011). Period maps locate the Karachi observa-tory inside the lower harbour at Manora, on a pier at 24.804°N, 66.970°E (Figs. 1b, 5, and 6). The full Karachi marigram is presented and detided in companion paper (Adams et al. 2018).
Open Access
*Correspondence: [email protected]
1 Department of Civil Engineering, NED University of Engineering and Technology, Karachi, Pakistan
The tsunami made the front pages of two Karachi newspapers, the Daily Gazette and the Sind Observer. Both papers told of a “tidal wave” that had flooded oil
installations and damaged Kiamari Groyne, a rock wall along the harbour’s east side (locations, Fig. 1b). A wire-service story in the Times of India, published in Bombay,
gave times of four waves, the highest of which report-edly followed the predicted high tide by “about 100 min.” A description in Pendse (1946, 1948) resembles the
Times account. None of these 1940s reports identify the observers.
Tsunami effects at Karachi were later summarized by Ambraseys and Melville (1982) and Hoffmann et al. (2013). In addition, elderly residents of port villages recently tes-tified to flooding at Baba Island and Bhit Island, and to currents in nearby Baba Channel. Some of this testimony appears in Kakar et al. (2015).
Karachi bathymetry in published tsunami models Except in a recent conference paper (Hasan et al. 2017), simulations of the 1945 Makran tsunami have not been extended into Karachi Harbour. Modeled wave trains have instead been evaluated at synthetic
tide gauges outside the harbour, in the Arabian Sea. One of these synthetic gauges was positioned 40 km southwest of the harbour, at 24.46°N, 66.80°E (Rajen-dran et al. 2008, p. 1742). Two others are closer (Fig. 5), at 24.767°N, 66.985°E (Heidarzadeh and Satake 2015, p. 626) and 24.78°N, 66.98°E (Rastgoftar and Soltanpour 2016).
Tsunami modelers have obtained bathymetry outside the harbour from ETOPO (Neetu et al. 2011) and from the General Bathymetric Chart of the Oceans (GEBCO) (Rajendran et al. 2008; Heidarzadeh and Satake 2015; Rastgoftar and Soltanpour 2016). For the conference paper (Hasan et al. 2017), bathymetry inside the har-bour was extracted from the 1939 edition of the nauti-cal chart discussed below.
Fig. 2 Soundings grouped by survey date, as inferred from official nautical charts of Karachi Harbour. a 1955 chart used in preliminary DEM and
Materials and sources Nautical chart dated 1955
Most of the bathymetry in the DEM is derived from the 1955 edition of British Admiralty chart 40 (BA 40). We obtained scans of editions printed between 1884 and 1955, from the Geography and Maps Division of the Library of Congress, Washington, D.C. The 1884 edi-tion uses harbour soundings made in 1883. Later ediedi-tions credit surveys that were made in or before 1889, 1905, 1916, 1919, 1933, and 1953, primarily inside the harbour (Fig. 2). Minor revisions were made in intervening years.
At first, we thought to make a tsunami-era DEM from soundings on the 1939 edition of BA 40. We found, how-ever, that the 1939 chart contains a mosaic of soundings from various times back to 1883 (Fig. 2b; Additional file 2: Table S2)—in contrast to the 1955 edition, which uses soundings that are more nearly synoptic.
Most of the DEM bathymetry is, therefore, derived from this 1955 edition of BA 40, which is reproduced in Additional file 1: Figure S1. Its headnote cites “sur-veys by the Pakistan Government and Karáchi Har-bour authorities to 1953.” Also included in this edition are water depths in a distinct font that are credited to soundings from the nineteenth century. The publication scale is 1:12,000.
Nearly all the soundings on the 1955 chart were made in the first 8 years after the 1945 tsunami, probably between 1950 and 1953. Few of the soundings on the 1955 chart appear in a BA 40 version updated to 1950, and a head-note on the 1955 chart credits no source later than 1953. Surveys by the Pakistan Government should postdate August 1947, when Pakistan became independent.
The only pre-tsunami soundings in the 1955 edition are in shallow-water areas south of Kiamari (Fig. 2b). These earlier soundings were made in 1883, as judged from the notes on the 1884 edition of BA 40. The 1955 edition also presents, in this area, a low-water line that is inherited from the 1884 edition.
The low-water line on BA 40 represents the chart datum—the level to which the soundings were refer-enced. The high-water line on BA 40 probably approxi-mates a high-tide datum, mean high-water springs, as elaborated below under the heading “Vertical datums.”
Topographic maps dated 1944 and 1951
Additional lines of high water and low water, similar overall to those on BA 40, serve as tidal shorelines on 1944 and 1951 editions of a topographic sheet called the “Karāchi Guide Map.” This topographic map was published at 1:21,120 scale by the Survey of India (in 1944) and the Survey of Pakistan (in 1951). The Survey of India also published 1:63,360-scale topographic maps of the Karachi area on so-called “One-inch sheets” (one
inch = one mile), which are excerpted as the base map for Fig. 1b.
Notes on the Guide Map give dates of surveys and updates. The 1944 edition was surveyed 1926–1927 with corrections 1933–1934 and 1936–1939. It is designated as the “2nd edition (revised), 1940, reprinted August 1944 with minor corrections.” The 1951 edition contains corrections “up to 1949.”
Both editions of the Karachi Guide Map provide top-ographic contours at 20-foot intervals, with a supple-mentary 10-foot contour in shoreline areas that were undeveloped in the middle of the twentieth century. The vertical datum was probably mean sea level, as discussed below.
The DEM incorporates shorelines from the 1951 Guide Map. We used a scan that was provided by the National Library of Australia, and which is reproduced as Addi-tional file 1: Figure S2. The 1951 edition covers nearly twice the area of the 1944 edition, by extending westward from Karachi Harbour into mudflats and mangroves. These intertidal features are built into the DEM, as par-tial coverage of the “western backwaters” in Fig. 1b. The DEM also uses, from the 1951 edition, high-water and low-water lines outside the harbour near Manora and Kiamari, particularly to supersede the nineteenth century low-water line on BA 40 south of Kiamari.
Shuttle radar topography from 2000
To flesh out the DEM with upland topography, we used gridded data of the Shuttle Radar Topography Mission. The SRTM points, from the year 2000, have a horizon-tal spacing of 1 arc-second, or about 30 m. The elevations are referenced to a globally modeled mean sea level.
Georeferencing
We identified reference points on BA 40 and the Guide Map that can still be seen in modern imagery on Google Earth (Table 1; Additional file 1: Figure S3). These persis-tent points were then assigned latitudes and longitudes ref-erenced to the World Geodetic System of 1984 (WGS84).
Vertical datums Chart datum
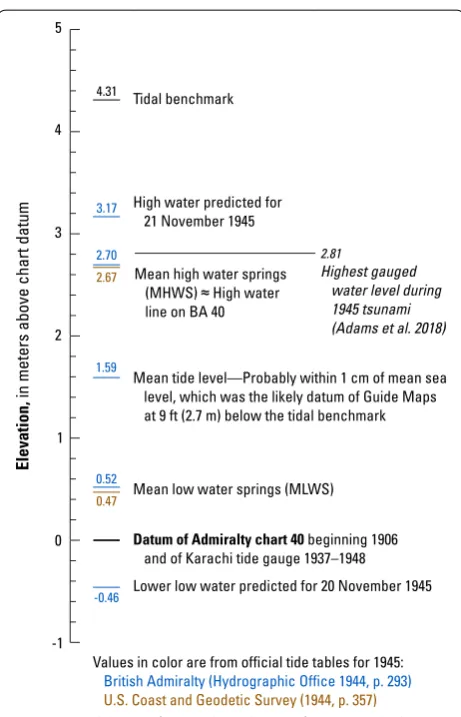
The DEM refers water depths and land heights to the chart datum of BA 40. According to editions of BA 40 printed between 1906 and 1948, and the 1955 edition as well, the chart datum was 14.14 ft (4.31 m) below a benchmark near the Karachi tidal observatory. This tidal benchmark is plotted on BA 40 and on the Guide Map. Chart datum served as the zero for the Karachi tide gauge in 1937–1948 (Permanent Service for Mean Sea Level 2016), and as the zero for Karachi predictions in the Admiralty tide tables for 1945 (Hydrographic
Department 1944). The tide tables for 1945 are refer-enced to “the datum of the largest scale Admiralty chart of the place.” BA 40 was then the largest scale Admiralty chart for Karachi Harbour.
Karachi tidal datums are related to this chart datum in notes that accompany tide tables by the British Admiralty (Hydrographic Department 1944, p. 293) and the U.S. Coast and Geodetic Survey (1944, p. 357). The values are nearly identical, differing by a few centimeters (Fig. 3). In the Admiralty entries, the zero of the tide predictions (elsewhere equated with the BA 40 chart datum) was 1.70 ft (0.52 m) below mean low-water springs, 5.21 ft (1.59 m) below mean tide level, and 8.85 ft (2.70 m) below mean high water springs (MHWS). Mean low water springs (MLWS) denotes the average of the lowest low water attained once monthly, during the new or full moon (Pugh and Woodworth 2014). MHWS is the high-water counterpart.
Other datums
The high-water line on BA 40 approximates MHWS, at a level 2.7 m above chart datum. Tidal flat soundings below the high-water line on BA 40, 1939 edition, are no greater than 9 ft (2.74 m) above chart datum. MHWS is listed as 8¾ ft (2.67 m) on BA 40 editions printed between 1935 and 1950. Admiralty tide tables for 1945 give the similar figure of 8.85 ft (2.70 m). A higher average of spring high waters attained only near solstice, according to the 1955 edition BA 40, was 9.5 ft (2.9 m) above chart datum.
BA 40 and the Guide Map depict a boundary between mangroves and bare tidal flats that was probably close to 2 m above chart datum. This estimate accords with two details on the 1939 edition of BA 40, in the Chinna Creek area (location, Fig. 2b): soundings outside mangroves, on bare tidal flat, are as much as 7 ft (2.1 m) above chart datum; and the mangroves themselves as labeled as “cov-ered at high water.”
The vertical datum for the Karachi Guide Map was probably mean sea level. This choice, though not spelled out on the map, is evidenced by the elevation given for the benchmark near the Karachi tidal observatory. In the 1951 edition (Additional file 1: Figure S2), and also in the 1944 edition, the Guide Map assigns this tidal benchmark an elevation of 9 ft (2.7 m), in contrast with the 14.14 ft (4.3 m) height of this bench mark above chart datum of BA 40. The difference of 1.6 m is indistinguishable from mean tide level, reported as 1.59 m above chart datum (Fig. 3). At Karachi, mean tide level is within 1 cm of mean sea level (Woodworth 2017, p. 74).
The vertical datum for SRTM—the Earth Gravitational Model 1996, or EGM96—approximates mean sea level at any given place (Durland 2009). We do not know, for Karachi Harbour, how closely EGM96 approximates mean
Fig. 3 Vertical datums for Karachi Harbour. References and other
sea level, either today or in 1945. Mean sea level has prob-ably risen about 20 cm at Karachi since the 1940s (Hoga-rth 2014, p. 7651). We did not attempt to include this rise when adjusting SRTM data to the datum for the DEM.
Digital elevation model Gridding
We imported geographic data into QGIS compatible vec-tor formats and referenced each sounding or shoreline point to WGS84 (horizontal datum) and BA 40 chart datum (vertical). The sources used:
1. 1955 BA 40—Soundings, low-water line, part of the
high-water line, and most of the seaward edge man-groves.
2. 1951 Guide Map—High-water and low-water lines
outside the harbour, particularly south of Kiamari; and tidal creeks and mangroves of backwaters north-west and northeast of the harbour.
3. Tidal-creek depths—Contours 1 m below chart
datum were imposed inside tidal creeks of western and eastern backwaters (Fig. 4), so that their channels would appear in the DEM. The tsunami-era channel depths are unknown for the most part, but the 1 m depth assumed is consistent with pre-tsunami chan-nel soundings along Chinna Creek (Fig. 2b).
4. SRTM—Anachronistic upland elevations doubtfully related to the DEM datum and not intended for use in tsunami simulations, as discussed above.
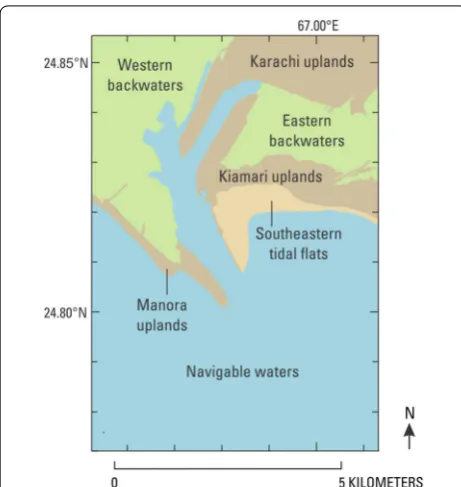
The compiled data were interpolated to convert a non-uniform distribution of points into a uniform grid. For this purpose, we divided the DEM area into seven parts—one area of navigable waters, including the densely sounded harbour; three areas dominated by tidal flats and mangroves; and three upland areas (Fig. 4). The interpolation, done separately within each of these seven areas, used a minimum curvature method in Surfer 15 (http://www.golde nsoft ware.com).
Minimum curvature is a kind of spline interpolation that fits a surface exactly through data points (Smith and Wessel 1990). In a comparison of interpolation schemes for mak-ing bathymetric grids, Amante and Eakins (2016) found spline interpolation more accurate than inverse distance weighting and triangulation. We managed abrupt slopes and sharp curves by adding what Surfer calls a “faultline,” the points on one side of which cannot influence interpola-tion on the other side. Finally, the seven partial DEMs were merged and were resampled at 1 m using nearest neighbour interpolation. The resulting DEM is plotted as by ranges of historical water depth and modern land height in Fig. 5.
The grid spacing of 1 m preserves details that may affect use of the DEM for tsunami simulation. These details include the tide-gauge location (Figs. 5 and 6) and a narrow sea wall (Kiamari Groyne, Fig. 1b). A much wider spacing would otherwise be warranted by the den-sity of soundings in the navigable waters area. This area contains 1763 soundings in 58 km2, or an average of
about 30 soundings per square kilometer, excluding the depths obtained from low-water lines, high-water lines, and mangrove margins. Randomly distributed data with an average density of 30 per square kilometer justifies a grid spacing of about 45 m (Eq. 13 of Hengl 2006).
Comparisons between DEM and source data
We tested the interpolation by making two comparisons between the DEM and the 1955 edition of BA 40. First, in the navigable waters area, we compared the 3 fathom (5.5 m) and 6 fathom (11.0 m) depth contours in the DEM with those same contours the nautical chart (Additional file 1: Figure S4). Second, we used the DEM to make a bathymetric profile that crosses the harbour through the site of the tide gauge, for comparison with nearest sound-ings on the 1955 chart (Fig. 6). Both comparisons show close agreement.
Known limitations
1. The DEM excludes the extensive tidelands west and east of the harbour (backwaters, Fig. 1b). These chiefly inter-tidal areas may have large capacity for tsunami water. 2. The DEM uses harbour soundings made mainly after
the tsunami. If the 1945 tsunami modified the
har-Fig. 4 Areas interpolated independently in construction of the
bour bathymetry, the DEM may locally differ from the water depths that the tsunami encountered. 3. The DEM includes uses assumed channel depths and
mangrove heights in the backwaters and relies on nineteenth century soundings on the tidal flat east of Kiamari Groyne (Fig. 2).
4. The SRTM data used for upland topography, in addi-tion to being anachronistic and insecurely related to the historical chart datum, include many small areas that spuriously plot below chart datum (Fig. 5).
5. The interpolation methods warrant further assess-ment in the manner of Amante and Eakins (2016).
Conclusions
A DEM for Karachi Harbour facilitates simulation of the 1945 Makran tsunami in Karachi Harbour, an area where observations of this tsunami are uncommonly abundant and diverse. The DEM is based mainly on a nautical chart that was surveyed less than 8 years after
the tsunami. Limitations of the DEM include its trunca-tion of backwaters inland from the harbour. The Karachi tide gauge recorded the 1945 tsunami in shallow water behind a headland—a physiographic setting that the DEM represents.
Additional files
Additional file 1: Figure S1. Scan of the 1955 edition of Admiralty nautical chart (BA 40), “Karáchi Harbour”. Figure S2. Scan the 1951 edition of the Karachi Guide Map, published by Survey of Pakistan. Figure S3.
Points used to georeference various editions of BA 40 and the Guide Maps (Table 1), plotted on a modern image from Google Earth. Figure S4.
Shaded relief image of the DEM showing a comparison of 3 and 6 fathom contours digitized from BA 40 and extracted from the DEM.
Additional file 2: Table S1. Soundings digitized from the 1955 edition of Admiralty nautical chart (BA40), “Karáchi Harbour”. Table S2. Soundings digitized from the 1939 edition of Admiralty nautical chart (BA40), “Karáchi Harbour”.
Authors’ contributions
HH georeferenced the source maps, digitized soundings and shorelines, and developed the gridded DEMs. BFA obtained scans of archival nautical charts and topographic maps. All authors prepared the figures, and BFA contributed most of the text. All authors read and approved the final manuscript.
Author details
1 Department of Civil Engineering, NED University of Engineering and Technol-ogy, Karachi, Pakistan. 2 U.S. Geological Survey at University of Washington, Seattle, WA, USA.
Acknowledgements
Frank I. Gonzaléz, James Luke Blair, Keith Knudsen, and two anonymous refer-ees improved this paper with their reviews.
Competing interests
The authors declare that they have no competing interests.
Availability of data and material
Included with this article, as additional files, are (1) the scanned maps on which the digital elevation models are based, and (2) the DEMs themselves, as tables of longitude, latitude, and a vertical parameter for water depth and land-surface elevation. The DEM data are available in Hasan et al. (2018).
Funding
This work was initiated under a UNESCO project supported by the United Nations Economic and Social Commission for Asia and the Pacific. Additional support was provided by the U.S. Agency for International Development through its Office of Foreign Disaster Assistance and the U.S. Geological Survey.
Appendix
See Table 1.
a
b
Fig. 6 Lower Karachi Harbour in the area where the tidal observatory was located in 1945. a Excerpt from nautical chart of 1955, showing
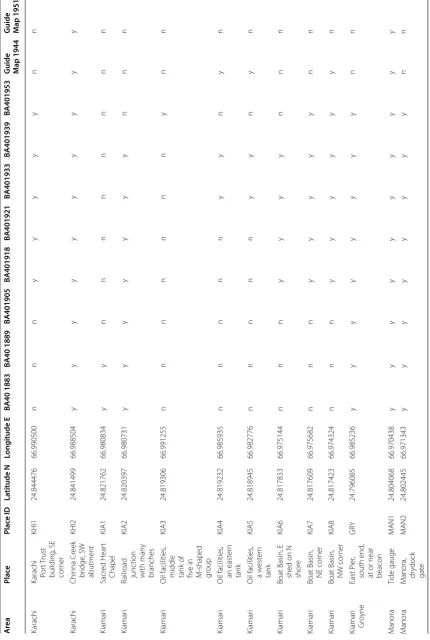
Table
1
P
oin
ts used t
o geor
ef
er
enc
e the v
arious editions of A
dmir
alt
y C
har
t 40 (B
A 40) and the Kar
achi G uide M ap A re a Plac e Plac e ID La titude N Long itude E BA40 1883 BA40 1889 BA401905 BA401918 BA401921 BA401933 BA401939 BA401953 G
uide Map 1944
G
uide Map 1951
Karachi
Karachi Por
t T rust building , SE cor ner KHI1 24.844476 66.990500 n n n y y y y y n n Karachi Chinna Cr eek br idge , SW abutment KHI2 24.841499 66.988504 y y y y y y y y y y Kiamar i Sacr ed Hear t Chapel KIA1 24.821762 66.980834 y y n n n n n n n n Kiamar i Railr oad junc tion with man y branches KIA2 24.820397 66.980731 y y y y y y y n n n Kiamar i Oil facilities ,
middle tank of five in M-shaped group
KIA3 24.819306 66.991255 n n n n n n n y n n Kiamar i Oil facilities , an east er n tank KIA4 24.819232 66.985935 n n n n n y y n y n Kiamar i Oil facilities , a w est er n tank KIA5 24.818945 66.982776 n n n n n y y n y n Kiamar i
Boat Basin, E shed on N shor
e KIA6 24.817833 66.975144 n n n y y y y n n n Kiamar i
Boat Basin, NE cor
ner KIA7 24.817609 66.975682 n n n y y y y y n n Kiamar i
Boat Basin, NW cor
ner KIA8 24.817423 66.974324 n n n y y y y y y n Kiamar i Gr oyne East P ier , south end ,
at or near beacon
GR Y 24.796085 66.985236 y y y y y y y y n n M anora Tide gauge M AN1 24.804068 66.970438 y y y y y y y y y y M anora M
anora, drydock gat
y
plac
e used f
or geor ef er encing n plac
e not used f
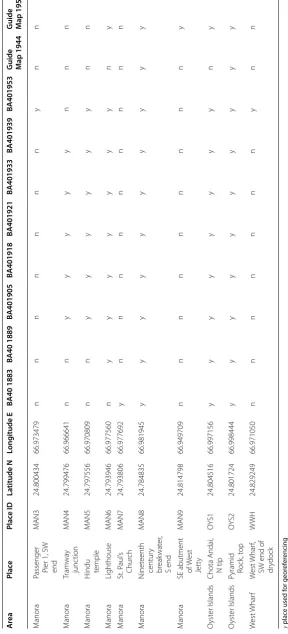
or geor ef er encing Table 1 (c on tinued) A re a Plac e Plac e ID La titude N Long itude E BA40 1883 BA40 1889 BA401905 BA401918 BA401921 BA401933 BA401939 BA401953 G
uide Map 1944
G
uide Map 1951
M
anora
Passenger Pier 1, SW end
M AN3 24.800434 66.973479 n n n n n n n y n n M anora Tram wa y junc tion M AN4 24.799476 66.966641 n n y y y y y n n n M anora H
indu temple
M AN5 24.797556 66.970809 n n y y y y y y n n M anora Lighthouse M AN6 24.793946 66.977560 n y y y y y y y n y M anora St. P aul ’s Chur ch M AN7 24.793806 66.977692 y n n n n n n n n n M anora N inet eenth centur y br eak wat er , S end M AN8 24.784835 66.981945 y y y y y y y y y y M anora
SE abutment of W
est Jett y M AN9 24.814798 66.949709 n n n n n n n n n y O yst er Islands
Chota Andai, N tip
OY S1 24.804516 66.997156 y y y y y y y y n y O yst er Islands
Pyramid Rock
, t op OY S2 24.801724 66.998444 y y y y y y y y y y W est Whar f W est Whar f,
SW end of drydock
Publisher’s Note
Springer nature remains neutral with regard to jurisdictional claims in pub-lished maps and institutional affiliations.
Received: 2 March 2018 Accepted: 25 July 2018
References
Adams LM, Atwater BF, Hasan H (2018) Karachi tides during the 1945 Makran tsunami. Geosci Lett. https ://doi.org/10.1186/s4056 2-018-0121-z Amante CJ, Eakins BW (2016) Accuracy of interpolated bathymetry in digital
elevation models. J Coastal Res Spec Issue 76:123–133. https ://doi. org/10.2112/SI76-011
Ambraseys NN, Melville CP (1982) A history of Persian earthquakes. Cambridge University Press, Cambridge
Brow DB (1947) The port of Karachi: outline history of its development, 1843–1945. Dock Harb Auth 28:167–173
Byrne DE, Sykes LR, Davis DM (1992) Great thrust earthquakes and aseismic slip along the plate boundary of the Makran subduction zone. J Geophys Res 97:449–478. https ://doi.org/10.1029/91JB0 2165
Durland N (2009) Defining mean sea level in military simulations with DTED (article 115). In: Proceedings of the 2009 spring simulation multi-conference. March 22–27; 2009. pp 1–3. http://dl.acm.org/citat ion. cfm?id=16399 31. Accessed 2 Sept 2018
Eakins BW, Taylor LA (2010) Seamlessly integrating bathymetric and topo-graphic data to support tsunami modeling and forecasting efforts. In: Breman J (ed) Ocean globe. ESRI Press Academic, Redlands, pp 37–56 Hasan H, Lodhi HA, LeVeque RJ, Lodhi SH, Ahmed S (2017) Assessing tsunami
risk to Karachi Port through simulation of currents that were reportedly produced there by the 1945 Makran tsunami. In: Proceedings of the 16th world conference on earthquake engineering, Santiago—Chile; 2017. January 8–13; 2017
Hasan H, Atwater BF, Ahmed S (2018) Bathymetric and topographic grid intended for simulations of the 1945 Makran tsunami in Karachi Harbour. U.S. Geological Survey data release. https ://doi.org/10.5066/P9NHQ W8M. Accessed 14 Sept 2018
Heidarzadeh M, Satake K (2015) New insights into the source of the Makran tsunami of 27 November 1945 from tsunami waveforms and coastal deformation data. Pure Appl Geophys 172:621–640. https ://doi. org/10.1007/s0002 4-014-0948-y
Hengl T (2006) Finding the right pixel size. Comput Geosci 32:1283–1298 Hoffmann G, Rupprechter M, Al Balushi N, Grützner C, Reicherter K (2013)
The impact of the 1945 Makran tsunami along the coastlines of the Arabian Sea (Northern Indian Ocean)—a review. Zeitschrift für Geomor-phologie, Supplementary Issue 57(supplement 4):257–277. https ://doi. org/10.1127/0372-8854/2013/S-00134
Hogarth P (2014) Preliminary analysis of acceleration of sea level rise through the twentieth century using extended tide gauge data sets. J Geophys Res 119:7645–7659. https ://doi.org/10.1002/2014J C0099 76
Hydrographic Department (1944) The Admiralty tide tables; part I. Tidal predictions for the year 1945; section B. Foreign waters. Admiralty, City of Westminster
Inskeep S (2011) Instant city: life and death in Karachi. Penguin Press, New York Kakar DM, Naeem G, Usman A, Mengal A, Naderi Beni A, Afarin M, Ghaffari H,
Fritz HM, Pahlevan F, Okal EA, Hamzeh MA, Ghasemzadeh J, Al-Balushi NS, Hoffmann G, Roepert A, Seshachalam S, Andrade V (2015) Remembering the 1945 Makran tsunami; interviews with survivors beside the Arabian Sea. UNESCO-IOC Brochure 2015-1. p 79. http://www.ioc-tsuna mi.org/ index .php?optio n=com_conte nt&view=artic le&id=293:1945-makra n-tsuna mi&catid =20&lang=en&Itemi d=68. Accessed 2 Sept 2018 Lambrick HT (1942) Census of India, 1941, vol 12. Sind tables
Neetu S, Suresh I, Shankar R, Nagarajan B, Sharma R, Shenoi SSC, Unnikrishnan AS, Sundar D (2011) Trapped waves of the 27 November 1945 Makran tsunami: observations and numerical modeling. Nat Hazards 59:1609– 1618. https ://doi.org/10.1007/s1106 9-011-9854-0
Pendse CG (1946) A short note on the Mekran earthquake of 28th November 1945. J Sci Ind Res 5:106–108
Pendse CG (1948) Mekran earthquake of the 28th November 1945. India Meteorol Dept Scientific Notes 10:141–145
Permanent Service for Mean Sea Level (2016) Karachi (station 204). National Oceanography Centre, Liverpool. http://www.psmsl .org/data/obtai ning/ stati ons/204.php. Accessed 10 August 2016
Pugh D, Woodworth P (2014) Sea-level science: understanding tides, surges, tsunamis and mean sea-level changes. Cambridge University Press, Cambridge
Rajendran CP, Ramanamurthy MV, Reddy NT, Rajendran K (2008) Hazard implications of the late arrival of the 1945 Makran tsunami. Curr Sci 95:1739–1743
Rastgoftar E, Soltanpour M (2016) Study and numerical modeling of 1945 Makran tsunami due to a probable submarine landslide. Nat Hazards 83:929–945. https ://doi.org/10.1007/s1106 9-016-2356-3
Smith WHF, Wessel P (1990) Gridding with continuous curvature splines in ten-sion. Geophysics 55:293–305. https ://doi.org/10.1190/1.14428 37 Tang L, Chamberlin C, Tolkova E, Spillane M, Titov VV, Bernard EN, Mojfeld HO
(2006) Assessment of potential tsunami impact for Pearl Harbor, Hawaii. NOAA Technical Memorandum OAR PMEL-131. https ://www.pmel.noaa. gov/publi c/pmel/publi catio ns-searc h/searc h_abstr act.php?fmCon tribu tionN um=2984. Accessed 2 Sept 2018
U.S. Coast and Geodetic Survey (1944) Tide tables Pacific Ocean and Indian Ocean for the year 1945. Serial no. 661. https ://catal og.hathi trust .org/ Recor d/00834 8547. Accessed 2 Sept 2018