R E S E A R C H
Open Access
A selective and sensitive LC-MS/MS method for
the simultaneous determination of two potential
genotoxic impurities in celecoxib
Ambavaram Vijaya Bhaskar Reddy, Nandigam Venugopal and Gajulapalle Madhavi
*Abstract
Background:Impurity profiling is now receiving critical attention from regulatory authorities. For trace level quantification of potential genotoxic impurities (PGIs), conventional analytical techniques like high-performance liquid chromatography (HPLC) and gas chromatography (GC) are inadequate; consequently, there is a great need to apply hyphenated analytical techniques to develop sensitive analytical methods for the analysis of pharmaceuticals. Methods:A selective and sensitive liquid chromatography-tandem mass spectrometry (LC-MS/MS) method was developed for the simultaneous determination of (4-sulfamoylphenyl)hydrazine hydrochloride (SHH) and (4-methyl-acetophenone)para-sulfonamide phenylhydrazine hydrochloride (MAP) PGIs in celecoxib active pharmaceutical ingredient (API). The LC-MS/MS analysis of SHH and MAP PGIs was done on Symmetry C18 (150 mm × 4.6 mm, 3.5μm) analytical column, and the mobile phase used was 5.0 mM ammonium acetate-acetonitrile in the ratio of 30:70 (v/v). The flow rate used was 0.7 mL/min. Triple quadrupole mass detector coupled to positive electrospray ionization operated in multiple reaction monitoring (MRM) mode was used for the quantification of SHH and MAP PGIs. The method was validated as per International Conference on Harmonization (ICH) guidelines and was able to quantitate both SHH and MAP PGIs at 1.0 ppm with respect to 10 mg/mL of celecoxib.
Results:The proposed method was specific, linear, accurate, precise, and robust. The calibration curves show good linearity between the concentration range of 0.06 and 7.5 ppm for both SHH and MAP PGIs. The correlation coefficient obtained was >0.9998 in each case. The method has very low limit of detection (LOD) and limit of quantification (LOQ). The obtained LOD and LOQ values were 0.02 and 0.06 ppm, respectively, for both SHH and MAP PGIs. For both the PGIs, excellent recoveries of 95.0% to 104.0% were obtained at a concentration range of 0.06 to 3.0 ppm. The developed method was also applied to determine the SHH and MAP PGIs in three formulation batches of celecoxib. Conclusions:The proposed method is simple and accurate and is a good quality control tool for the simultaneous quantitative determination of SHH and MAP PGIs at very low levels in celecoxib during its manufacturing.
Keywords:LC-MS/MS; Method validation; Genotoxicity; Ionization; Quantification
Background
The presence of potential genotoxic impurities (PGIs) even in smaller quantities may affect the efficacy and safety of pharmaceutical products. Impurity profiling is now receiving critical attention from regulatory authorities. The different pharmacopoeias such as BP (British pharmacopoeias), USP (United States pharmaco-poeias), IP (Indian pharmacopharmaco-poeias), and so on, are slowly
incorporating limits to the allowable levels of impurities present in the active pharmaceutical ingredients (APIs). Celecoxib is one of the most popular non-steroidal anti-inflammatory drug (NSAID) and a selective cyclooxy-genase-2 (COX-2) inhibitor used to treat osteoarthritis, rheumatoid arthritis, acute pain, painful menstruation, and menstrual symptoms (Dembo et al. 2005). Celecoxib also reduces the number of colon and rectum polyps in patients with familial adenomatous polyposis (Clemett and Goa 2000; Silverstein et al. 2000). It is chem-ically named as 4-[5-(4-methylphenyl)-3-(trifluoromethyl) * Correspondence:[email protected]
Department of Chemistry, Sri Venkateswara University, Tirupati 517502, India
pyrazol-1-yl]benzene sulfonamide, and the chemical struc-ture of celecoxib is shown in Figure 1. (4-Sulfamoylphenyl) hydrazine hydrochloride (SHH) and
(4-methyl-acetophe-none)para-sulfonamide phenylhydrazine hydrochloride
(MAP) are the two important key intermediates used in the synthesis of celecoxib, which are identified as PGIs in finished pharmaceutical substances due to their electrophilic functional groups (Ashby and Tennant 1988; Muller et al. 2006). Several analytical methods have been used to determine celecoxib concentrations in human plasma with various analytical techniques such as high-performance liquid chromatography-UV (HPLC-UV), liquid chromatography-mass spectrometry (LC-MS), and liquid chromatography-tandem mass spectrometry (LC-MS/MS) (Jalalizadeh et al. 2004; Zarghi et al. 2006; Emami et al. 2006; Chow et al. 2004; Stormer et al. 2003; Abdel-Hamid et al. 2001; Werner et al. 2002; Bräutigam et al. 2001), and few methods have been reported for the determination of impurities in celecoxib using HPLC and LC-MS/MS (Satyanarayana et al. 2004; Rao et al. 2006; Jadhav and Shinqare 2005). Ideally, many conventional analytical instruments in pharmaceutical industry such as HPLC with UV detection and GC with flame ionization detector (FID) detection should be employed as the standards in the first attempt for PGIs analysis. However, there are some drawbacks with the abovementioned techniques because HPLC retention times can vary, and some methods are needed to characterize the impurities on line when the
impurity standards are not available (Hsieh and Korfmacher 2006; Lee and Kems 1999). Therefore, for accurate de-termination of PGIs at trace levels, the abovemen-tioned techniques are inadequate; consequently, there is a great need to develop better analytical methods for the analysis of such PGIs in pharmaceutical industries. As a result, various kinds of hyphenated chromatographic techniques and methodologies have been explored as useful approaches.
Based on the threshold of toxicological concern (TTC) of 1.5μg/person/day, the impurity concentration in cele-coxib must not exceed 7.5 ppm considering the worst case scenario where 200-mg daily dose of celecoxib is applied. To the best of our knowledge, no analytical method for the simultaneous determination of SHH and MAP PGIs in celecoxib has been reported in the literature. Therefore, in the present study, we have developed a simple LC-MS/ MS method that can quantify two PGIs in celecoxib at permitted levels. The method was validated as per ICH guidelines in terms of limit of detection (LOD), limit of quantification (LOQ), linearity, precision, accuracy, specificity, robustness, and solution stability. The devel-oped method was also applied to determine SHH and MAP PGIs in three formulation batches of celecoxib.
Methods
Chemicals and reagents
All chemicals and solvents were of analytical grade. HPLC grade acetonitrile and ammonium acetate were purchased from Merck (Mumbai, India). Formic acid, trifluoroacetic acid, and methanol were obtained in their highest grade from SD fine chemicals limited (Mumbai, India). Refer-ence substances of SHH, MAP, and celecoxib with the highest purity (>99.0) were obtained from Sigma-Aldrich (St. Louis, MA, USA). High-purity Milli-Q water was used with the help of Millipore Milli-Q plus purification system (Bedford, MA, USA).
Preparation of stock and standard solutions
A stock solution of celecoxib (10 mg/mL) was prepared by dissolving appropriate amount in the methanol. A stock solution of mixture of PGIs (SHH and MAP) at 1.0 mg/mL was also prepared in methanol. The diluted stock solution (0.01 mg/mL) was prepared by diluting 1.0 mL of the 1.0 mg/mL solutions to 100 mL with
methanol. Then, 0.1 μg/mL diluted stock solution was
prepared by diluting 1.0 mL of 0.01 mg/mL diluted stock solution to 100 mL with methanol. The working standard solution was prepared by weighing accurately 100 mg of celecoxib into 10-mL volumetric flask and made the solution up to the graduation mark after adding 10μL of 0.1μg/mL diluted stock solution to give 10 ng/mL and 10 mg/mL of PGIs with respect to celecoxib which corresponds to 1.0 ppm of PGI contamination relative to
the drug substance. The PGI samples for validation at 0.06-, 0.5-, 1.0-, 3.0-, 5.0-, and 7.5-ppm concentrations relative to the drug substance were prepared in the same
manner using 0.5 μg/mL of diluted stock solution. The
concentration of the standard solutions and samples was optimized to achieve a desired signal-to-noise ratio (S/N) and good peak shape. All the standards were sonicated well and filtered through 0.22-μm membrane filters before the analysis.
Chromatographic conditions
All chromatographic experiments were carried out on a HPLC consisting of LC-20AD binary gradient pump, SPD-10AVP UV detector, SIL-10HTC autosampler, and a column oven CTO-10ASVP (Shimadzu, Switzerland) system coupled with MS/MS (Applied Biosystems Sciex API 4000 model, Rotkreuz, Switzerland). The analytical column used was Symmetry C18 (150 mm × 4.6 mm,
3.5 μm). The mobile phase flow operated in isocratic
mode using 5.0 mM ammonium acetate-acetonitrile in the ratio of 30:70 (v/v). The flow rate of the mobile phase was set at 0.7 mL/min, and the column oven temperature was maintained at 40°C. The injection volume was 10μL.
All the solutions were filtered through 0.22-μm nylon
filter before the analysis.
Mass spectrometer
The MS/MS system used was an Applied Biosystems Sciex API 4000 triple quadrupole mass spectrometer with electrospray ionization (ESI) probe operated in positive polarity. Multiple reaction monitoring (MRM) mode was selected for the quantification of SHH and MAP PGIs, and the data acquisition and processing were conducted using the Analyst 1.5.1 software. Typical operating conditions were as follows: ion spray voltage 5,500 V, source temperature 410°C, declustering potential (50 and 55 V), entrance potential (10 and 10 V), collision energy (25 and 20 V), respectively, for both SHH and MAP PGIs. The curtain gas flow, ion source gas 1, and ion source gas 2 nebulization pressure were maintained as 25, 30, and 35 psi, respectively. Electrospray ionization in positive MRM mode was used for the quantification of SHH and MAP PGIs at their transition ion pairs of
m/z 188.2→99.2 (protonated) and m/z 304.2→209.2
(protonated), respectively. Celecoxib was monitored with its transition ion pairm/z382.2→214.1 (protonated).
Method validation
To demonstrate the feasibility of the newly developed method, validation was performed in relation to specificity, linearity, LOQ, LOD, accuracy, precision, robustness, and solution stability. These parameters were validated in agreement with the ICH guidelines.
The linearity was performed by diluting the impurity stock solution to the required concentrations. The solutions were prepared at six concentration levels between 0.06 to 7.5 ppm for both SHH and MAP PGIs and were subjected to linear regression analysis with the least squares method. Calibration equation obtained from regression analysis was used to calculate the corresponding predicted responses. System precision of the mass spectrometric response was established by injecting six individual preparations of the standard solution. The method precision was evaluated by spiking each analyte and determining the percent relative standard deviation (%RSD). LOD and LOQ were evaluated by considering the impurity concentration that would yield S/N ratios of 3:1 and 10:1, respectively. The precision of LOD and LOQ values were experimentally verified by six injections of standard solutions of the compounds at the determined concentrations. Recoveries of SHH and MAP PGIs in spiked samples were studied at three different concentration levels, viz. 0.06, 1.5, and 3.0 ppm. At each concentration level, three independent sample prepara-tions were injected, and the percentage recoveries were determined by comparing the concentration of the spiked sample obtained with the concentration of the spiking standard. The robustness of the method was evaluated by changing mobile phase flow and column temperature, and the stability of the impurities in the sample solution was evaluated by analyzing spiked sample solution at different time intervals at room temperature.
Results and discussion
Optimization of sample preparation
Sample preparation is an important part in the pharma-ceutical impurity analysis, because matrix effects in trace analysis were enlarged, causing loss of sensitivity, abnor-mal recovery, and analyte instability. Different diluents were evaluated with respect to chromatographic efficiency. Solubility of both celecoxib and impurities were good in methanol. Good response and proper peak shapes were obtained for both the impurities when methanol was used as the diluent. Good recoveries (95.0% to 104.0%) were also observed for both SHH and MAP PGIs when methanol was used as a diluent. Therefore, methanol was employed as the diluent throughout the analysis.
Column selection and separation
The present method was developed by testing different stationary phases to achieve good separation of the im-purity peaks from drug substance peak. It is important to achieve proper separation among the two PGIs and celecoxib, because of similar chemical structure of two PGIs and celecoxib. In order to obtain a short analysis time, various analytical columns like Kromasil C18
150 mm × 4.6 mm, 3.5μm (Altmann Analytik, Munich,
(Altmann Analytik), Symmetry C18 150 mm × 4.6 mm,
3.5 μm (Waters, Milford, MA, USA), and Zorbax Rx
C8 150 mm × 4.6 mm, 3.5 μm (Agilent Technologies,
Inc., Santa Clara, CA, USA) were evaluated. The tested columns were checked under the same conditions; with the Kromasil C18 and Zorbax Rx C8 columns, the peaks of impurities were overlapped with celecoxib peak. The resolution between celecoxib and impurities were poor with Hypersil BDS C8 column. On Symmetry
C18 column (150 mm × 4.6 mm, 3.5μm), the separation
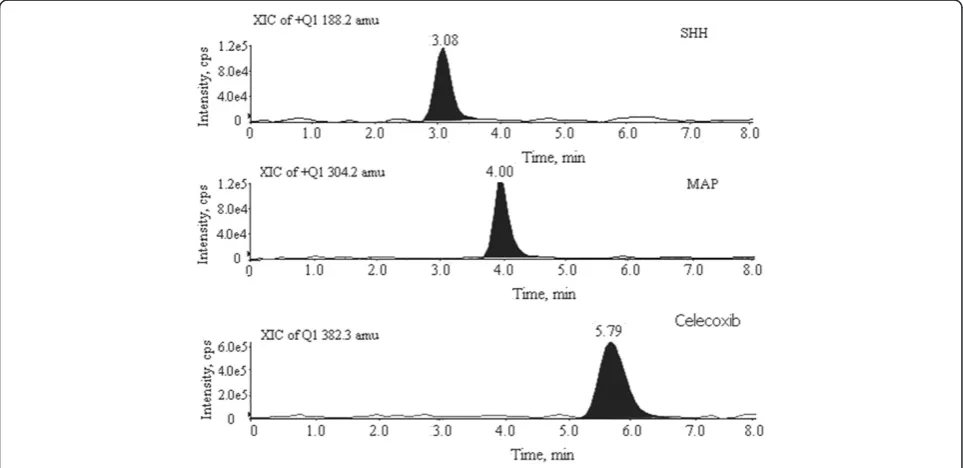
and responses for both the impurities and celecoxib were found good. On this column, the analytes were well retained and separated from each other and from the drug substance. This separation is achieved due to polar group technology that ‘shields’ the silica residual silanol surface from highly basic analytes; this reduced silanol activity for the symmetry column significantly improved the peak shape and resolution. Different compositions of mobile phases using 10 mM ammonium acetate and 5.0 mM ammonium acetate with acetonitrile were tested; finally, good separation and response were observed at a ratio of 5.0 mM ammonium acetate-acetonitrile (30:70,v/v). Both isocratic and gradient elution modes were evaluated. Isocratic elution was observed to be more efficient in achieving optimum separation of impur-ities from each other with respect to drug substance peak. The column was thermostated at 40°C to avoid any shift in retention time. Retention times of SHH and MAP PGIs were observed at 3.08 and 4.02 min, respectively. Peaks were well separated from the drug substance peak (5.79 min).
Optimization of MS-MS parameters
Selection of a detection method is also the most important part of pharmaceutical impurity analysis. From the instru-ment simplicity and availability, first, we have evaluated with HPLC-UV and GC-FID. However, on these techniques sufficient sensitivity for the trace level analysis of SHH and MAP PGIs was not achieved. In view of this, a sensitive and specific mass LC-MS/MS technique in MRM mode was evaluated for the quantification of SHH and MAP PGIs in celecoxib drug substance. Then, the possibility of using electrospray ionization (ESI) source under positive ion detection mode was evaluated during the early stage of
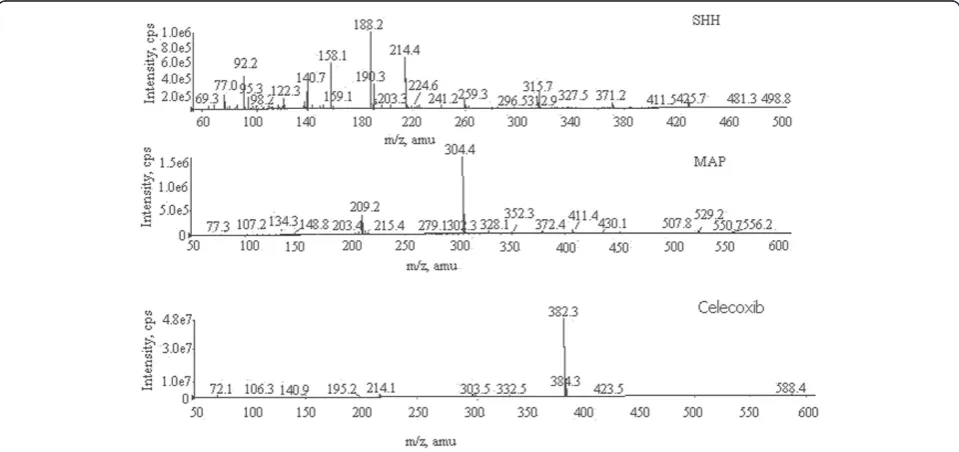
Figure 2Representative mass spectra of SHH, MAP PGIs, and celecoxib.
Table 1 The precision at LOD and LOQ concentrations of SHH and MAP PGIs
Injection ID SHH MAP LOD
(peak area) LOQ (peak area)
LOD (peak area)
LOQ (peak area)
1 2,196 6,280 2,496 7,109
2 2,094 6,300 2,344 7,350
3 2,173 6,351 2,342 6,973
4 2,085 6,240 2,349 7,300
5 2,210 6,190 2,488 7,246
6 2,090 6,250 2,371 6,920
Mean 2,141.33 6,268.50 2,398.66 7,149.66
Standard deviation 57.88 55.22 73.58 177.52
%RSD 2.70 0.88 2.94 2.48
method development. The signal intensity in positive mode was much higher than that in negative mode. Further, the method development was carried out with ESI source operated in positive polarity mode. The ion source parameters were optimized to get proper response. The representative mass spectra of SHH, MAP, and celecoxib are shown in Figure 2.
Method validation
In order to prove that the method is capable of its intended use, the newly developed method for the quantification of SHH and MAP PGIs in celecoxib drug substance was validated according to the inter-national guidelines (Vijaya Bhaskar Reddy et al. 2013; ICH 2005).
Limit of detection and limit of quantification
The method validation was started by injecting 1.0-ppm concentration of individual solutions of SHH and MAP PGIs of each with respect to the drug substance concen-tration of 10 mg/mL and determining their S/N ratios. Now, to evaluate LOD and LOQ values, their concen-trations were reduced sequentially such that they yield S/N ratios as 3:1 and 10:1, respectively. Each predicted concentration was verified for their precision by preparing the solutions at predicted concentrations and injected each solution six times for analyses. The LOD and LOQ values calculated form S/N ratio was found to be 0.02 and 0.06 ppm, respectively. It is noteworthy that the LOD values for both the impurities were below the re-quired concentration limit (7.5 ppm) for PGIs in celecoxib (Table 1).
Linearity
By MRM, the linearity of SHH and MAP PGIs was sat-isfactorily demonstrated with a six-point calibration graph between 0.06 and 7.5 ppm with respect to a sample concentration of 10 mg/mL. The calibration curves were produced by plotting the average of triplicate PGI
injections against the concentration expressed in percent-age. The slope, intercept, and correlation coefficient values were derived from linear least squares regres-sion analysis. The correlation coefficient obtained in each case was >0.9998. The corresponding linearity data is presented in Figure 3. The results indicated that an ex-cellent correlation existed between the peak areas and the concentrations of impurities.
Precision
The precision of the method was evaluated at two levels, viz. repeatability and intermediate precision. Repeatability was checked by calculating the %RSD of six replicate de-terminations by injecting six freshly prepared solutions containing 1.0 ppm each of the mixture of impurities on the same day. The same experiments were done on six different days to evaluate the intermediate precision.
Figure 3Linearity plot of SHH and MAP PGIs at 0.06- to 7.5-ppm concentration levels.
Table 2 Intra-day and inter-day precision of SHH and MAP PGIs at 1.0-ppm concentration
Injection ID SHH (peak area) MAP (peak area) Intra-day Inter-day Intra-day Inter-day
1 101,680 101,680 113,540 113,540
2 104,534 102,641 113,471 108,618
3 103,820 101,950 109,346 116,864
4 99,495 102,700 108,510 112,951
5 102,350 102,681 114,570 113,470
6 103,554 103,987 109,500 108,650
Standard deviation 1,826.69 801.93 252.78 3,194.58
%RSD 1.78 0.78 2.37 2.84
Table 3 The recovery data of SHH and MAP PGIs at three different concentrations
Parameter SHH MAP
Accuracy at LOQ level (n= 3)
Amount added (ppm) 0.06 0.06
Amount recovered (ppm) 0.057 0.059
%recovery 95.3 98.6
%RSD 1.95 1.84
Accuracy at 100% level (n= 3)
Amount added (ppm) 1.5 1.5
Amount recovered (ppm) 1.479 1.521
%recovery 98.6 101.4
%RSD 1.95 1.84
Accuracy at 150% level (n= 3)
Amount added (ppm) 3.0 3.0
Amount recovered (ppm) 3.102 3.108
%recovery 103.4 103.6
%RSD 1.21 1.44
As reported in Table 2, %RSD values were lower than 3.0% for both the impurities; this confirmed an adequate precision of the developed method.
Accuracy and specificity studies
When three pure and formulation sample solutions of 10 mg/mL of celecoxib were injected, impurities were not at all detected in them. Hence, recovery studies by the standard addition method were performed to evaluate
accuracy and specificity. Accordingly, the accuracy of the method was determined by spiking at (LOQ) 0.06-, 1.5-, and 3.0-ppm concentrations separately to three batches of pure and formulation solutions of celecoxib (10 mg/mL). Each determination was carried out three times. The recovery data is presented in Table 3, and the corre-sponding chromatogram is shown in Figure 4. Satisfac-tory recoveries of 95.3% to 98.6% for 0.06 ppm, 98.6% to 101.4% for 1.5 ppm, and 103.4% to 103.6% for
Figure 4Recovery chromatogram of SHH and MAP PGIs at LOQ concentration.
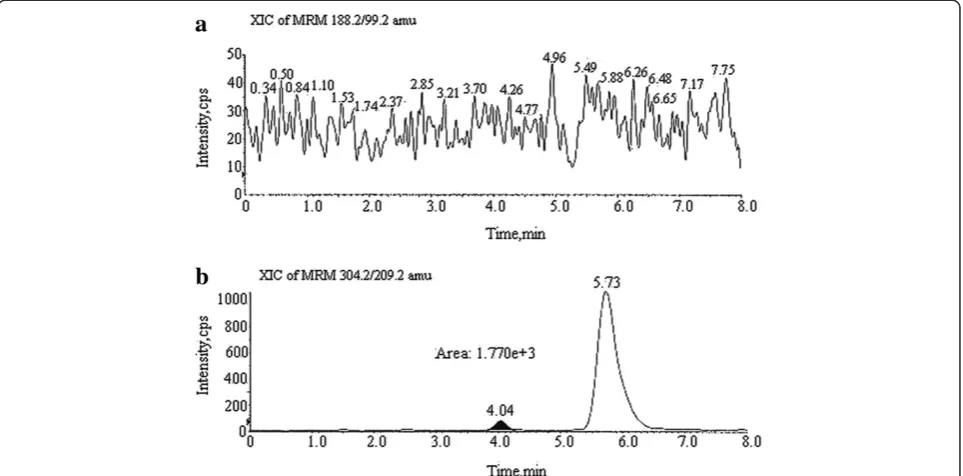
3.0 ppm were obtained. At such low concentrations, these recoveries and %RSDs were satisfactory. The spe-cificity of the method was established by injecting blank celecoxib (tablet) solution and celecoxib spiked with two PGIs. It was observed that the common ex-cipients used in the tablets were not interfered at the retention times of any PGIs and drug substance. The corresponding specificity chromatogram is shown in Figure 5. The developed method was also successfully applied for the determination of SHH and MAP PGIs in three different batches of celecoxib. In two batches, the PGIs were not detected. In one of the batches of celecoxib, only MAP was observed; however, its concen-tration was below the specification. The corresponding chromatogram is shown in Figure 6.
Robustness
The robustness of the method was studied with deliberate modifications in the flow rate of the mobile phase and the column temperature. The optimized flow rate of the mobile phase was 0.7 mL/min, and the same was altered by 10% of its flow, i.e., from 0.63 to 0.77 mL/min. The effect of col-umn temperature on resolution was studied at 38°C and 42°C (altered by 2°C). However, the mobile phase compo-nents were held constant as described above. As reported in Table 4, the %RSD in both the cases does not exceeded 3.0%, which demonstrates the robustness of the method.
Solution stability
Stability of SHH and MAP PGIs in methanol was checked by keeping them in an autosampler and observing the variations in their peak areas. From the stability results, we found that SHH and MAP were stable up to 48 h. The corresponding data is presented in Table 5.
Figure 6Representative chromatograms of (a) blank and (b) formulation sample of celecoxib.
Table 5 Solution stability data of SHH and MAP PGIs at LOQ concentration
Parameter SHH MAP
Solution stability
Theoretical concentration (ppm) 0.06 0.06
Percent recovery (n= 3)
At 0 h 98.2 ± 0.94 96.2 ± 1.24
At 12 h 101.4 ± 1.13 95.6 ± 0.91
At 24 h 102.6 ± 0.82 96.4 ± 0.88
At 48 h 99.8 ± 1.45 100.4 ± 1.36
n, number of determinations. Table 4 Robustness data of SHH and MAP PGIs at LOD
and LOQ concentrations
Parameter Actual Low High
Flow variation 0.7 0.63 0.77
Column oven temperature (°C) 40 38 42
SHH
%RSD at LOD 1.37 1.34 1.76
%RSD at LOQ 1.42 1.78 2.04
MAP
%RSD at LOD 0.68 1.42 0.74
Conclusions
The proposed method is a direct LC-MS/MS method for the separation and quantification of SHH and MAP PGIs in celecoxib drug substance. The method utilized MRM mode for the quantitation, which provided the better sensitivity. The method was fully validated and presents good linearity, specificity, accuracy, precision, and robust-ness, and it is also found to be simple, sensitive, selective, cost effective, and stability indicating. The LOD and LOQ of the method were found very low, as 0.02 and 0.06 ppm for both SHH and MAP impurities. The proposed method was successfully applied for the determination of the two PGIs in three formulation batches of celecoxib. The method presented here could be very useful to monitor SHH and MAP PGIs in celecoxib during its manufacturing.
Competing interests
The author declares no competing interests.
Authors’contributions
VBR designed the experiment, carried out the experiment, and contributed in framing the article. V assisted during the method development and analysis using LC-MS/MS. M assisted during the analysis and contributed in framing the article. All authors read and approved the final manuscript
Acknowledgements
One of the authors Dr. A. Vijaya Bhaskar Reddy is highly grateful to the UGC (BSR), Government of India, New Delhi for financial assistance in the form of an award of Meritorious Research Fellowship (RFSMS), and the authors are also thankful to Sipra Labs Limited, Hyderabad for supporting this work.
Received: 29 September 2013 Accepted: 8 January 2014
References
Abdel-Hamid M, Novotny L, Hamza H (2001) Liquid chromatographic-mass spectrometric determination of celecoxib in plasma using single-ion monitoring and its use in clinical pharmacokinetics. J Chrom B 753:401–408
Ashby J, Tennant RW (1988) Chemical structure,Salmonellamutagenicity and extent of carcinogenicity as indicators of genotoxic carcinogenesis among 222 chemicals tested in rodents by the U.S. NCI/NTP. Mutat Res 204:17–115 Bräutigam L, Vetter G, Tegeder I, Heinkele G, Geisslinger G (2001) Determination
of celecoxib in human plasma and rat microdialysis samples by liquid chromatography tandem mass spectrometry. J Chrom B 761(2):203–212 Chow HS, Anavy N, Salazar D, Frank DH, Alberts DS (2004) Determination of
celecoxib in human plasma using solid-phase extraction and high-performance liquid chromatography. J Pharma Biomed Anal 34:167–174
Clemett D, Goa KL (2000) Celecoxib: a review of its use in osteoarthritis, rheumatoid arthritis and acute pain. Drugs 59(4):957–980
Dembo G, Park SB, Kharasch ED (2005) Central nervous system concentrations of cyclooxygenase-2 inhibitors in humans. Anesthesia 102(2):409–415 Emami J, Fallah R, Ajami A (2006) A rapid and sensitive HPLC method for the
analysis of celecoxib in human plasma: application to pharmacokinetic studies. J Pharma Sci 16(4):211–217
ICH (2005) Validation of analytical procedures: test and methodology. Q2 (R1). ICH, Geneva
Hsieh Y, Korfmacher WA (2006) Increasing speed and throughput when using HPLC-MS/MS systems for drug metabolism and pharmacokinetic screening. Curr Drug Metabol 7:479–489
Jadhav AS, Shinqare MS (2005) A new stability-indicating RP-HPLC method to determine assay and known impurity of celecoxib API. Drug Dev Indust Pharm 31(8):779–783
Jalalizadeh H, Amini M, Ziaee V, Safa A, Farsam H, Shafiee A (2004) Determination of celecoxib in human plasma by high performance liquid chromatography. J Pharma Biomed Anal 35:665–670
Lee MS, Kems EH (1999) LC/MS applications in drug development. Mass Spec Rev 18:187–279
Muller L, Mauthe RJ, Riley CM, Andino MM, De Antonis D, Beels C, De George J, De Knaep AGM, Ellison D, Fagerland JA (2006) A rationale for determining, testing and controlling specific impurities in pharmaceuticals that possess potential for genotoxicity. Regul Toxicol Pharmacol 44:198–211
Rao RN, Meena S, Nagaraju D, Rao AR, Ravikanth S (2006) Liquid-chromatographic separation and determination of process-related impurities, including a regio-specific isomer of celecoxib on reversed-phase C18 column dynamically coated with hexamethyldisilazane. Anal Sci 22:157–1260 Satyanarayana U, Sreenivas Rao D, Ravindra Kumar Y, Moses Babu J, Rajender
Kumar P, Tirupathi Reddy J (2004) Isolation, synthesis and characterization of impurities in celecoxib, a COX-2 inhibitor. J Pharma Biomed Anal 35:951–957 Silverstein FE, Faich G, Goldstein JL, Simon LS, Pincus T, Whelton A, Makuch R,
Eisen G, Agrawal NM, Stenson WF, Burr AM, Zhao WW, Kent JD, Lefkowith JB, Verburg KM, Geis GS (2000) Gastrointestinal toxicity with celecoxib vs nonsteroidal anti-inflammatory drugs for osteoarthritis and rheumatoid arthritis: the CLASS study: a randomized controlled trial. Celecoxib Long-term Arthritis Safety Study. Amer Med Assoc 284(10):1247–1255
Stormer E, Bauer S, Kirchheiner J, Brockmoller J, Roots I (2003) Simultaneous determination of celecoxib, hydroxycelecoxib, and carboxycelecoxib in human plasma using gradient reversed-phase liquid chromatography with ultraviolet absorbance detection. J Chrom B 783(1):207–212
Vijaya Bhaskar Reddy A, Venugopal N, Madhavi G, Gangadhara Reddy K, Madhavi V (2013) A selective and sensitive UPLC-MS/MS approach for trace level quantification of four potential genotoxic impurities in zolmitriptan drug substance. J Pharma Biomed Anal 84:84–89
Werner U, Werner D, Pahl A, Mundkowski R, Gillich M, Brune K (2002) Investigation of the pharmacokinetics of celecoxib by liquid chromatography-mass spectrometry. Biomed Chrom 16(1):56–60 Zarghi A, Shafaati A, Foroutan SM, Khoddam A (2006) Simple and rapid high
performance liquid chromatographic method for determination of celecoxib in plasma using UV detection: application in pharmacokinetic studies. J Chroma B 835(1–2):100–104
doi:10.1186/s40543-014-0018-1
Cite this article as:Vijaya Bhaskar Reddyet al.:A selective and sensitive LC-MS/MS method for the simultaneous determination of two potential
genotoxic impurities in celecoxib.Journal of Analytical Science and
Technology20145:18.
Submit your manuscript to a
journal and benefi t from:
7 Convenient online submission
7 Rigorous peer review
7 Immediate publication on acceptance
7 Open access: articles freely available online
7 High visibility within the fi eld
7 Retaining the copyright to your article