Water-efficient sensing method for soil profiling in the paddy field
Zhenran Gao
,
Jun Ni
,
Yan Zhu
,
Qi Jiang
,
Weixing Cao
*(National Engineering and Technology Center for Information Agriculture, Jiangsu Key Laboratory for Information Agriculture,
Jiangsu Collaborative Innovation Center for Modern Crop Production, Jiangsu Collaborative Innovation Center for the
Technology and Application of Internet of Things, Nanjing Agricultural University, Nanjing 210095, China)
Abstract: The comprehensive and reliable perception of moisture in a soil profile is essential to irrigation. To establish an efficient method for sensing soil moisture, field trials were conducted to analyze the spatial and temporal variations of moisture in a paddy soil profile by using coefficients of variation. The results showed that soil layers at shallow depths undergo more extensive changes in the coefficients of variation. Moisture perception is most sensitive within a depth range of 0-60 cm in the vertical soil profile of a paddy field. By using the clustering algorithm of Euclidean distance, the paddy soil profile was divided into three categories based on soil depth. The first category includes depths ranging from 10-20 cm, the second is from 30-40 cm, and the third is from 50-100 cm. Path analysis indicated that the most sensitive depths for moisture sensing in a paddy soil profile were 20 cm, 30 cm, and 50 cm, whereas the most sensitive depths for moisture sensing by time stability analysis were 20 cm, 40 cm, and 60 cm. Based on the multiple regression of sensitive depths, the results of quantitative inversion indicated that the time stability analysis results were 0.962 when the Cor y y( , ) of path analysis was 0.980, and the time stability analysis was 0.61 when the root mean square error (RMSE) of path analysis was 0.40. The relative error range between the measured and predicted values of path analysis was less than that of time stability analysis. These findings suggest that it is feasible to effectively sense the moisture of the entire vertical soil profile based on the sensitive depth. The present study has also determined that path analysis is superior to time stability analysis.
Keywords: paddy field, profile soil, moisture perception, clustering algorithm, path analysis
DOI: 10.25165/j.ijabe.20181104.3593
Citation: Gao Z R, Ni J, Zhu Y, Jiang Q, Cao W X. Water-efficient sensing method for soil profiling in the paddy field. Int J Agric & Biol Eng, 2018; 11(4): 207–216.
1 Introduction
Soil moisture has obvious temporal and spatial variability and is one of the main factors affecting crop growth and yield. The infiltration and evaporation processes of soil moisture is complex[1],and studying the dynamic variation law of soil profiles
and methods for accurate, real-time soil moisture measurement may facilitate selection of the optimal irrigation time, optimal irrigation threshold and the establishment of a precise irrigation system[2]. Currently, real-time and comprehensive soil moisture
perception require a large number of soil moisture sensors in different soil layers, which results in tedious measurements, large signal interference, and high cost. Therefore, the establishment of a novel, low-cost, high-performance moisture perception method for soil profiling to improve irrigation efficiency is a significant advancement in the agricultural industry.
There is demand for a method for paddy fields that provides appropriate irrigation and water supply, these two factors not only
Received date: 2017-06-25 Accepted date: 2017-11-01
Biographies: Zhenran Gao, PhD candidate, research interest: agricultural information science, Email: [email protected]; Jun Ni, Professor, research interest: agricultural information science, Email: [email protected];
Yan Zhu, Professor, research interest: agricultural information science, Email: [email protected]; Qi Jiang, Undergraduate, research interest: agriculture specialty, Email: [email protected].
*Corresponding author: Weixing Cao, Professor, research interest: agricultural information science. National Engineering and Technology Center for Information Agriculture College of Agriculture, Nanjing Agricultural University, No.1 Weigang, Nanjing 210095, China. Tel: +86-25-84396593, Fax: +86-25-84396672, Email: [email protected].
affect the rate of water cycling and migration in paddy rice, but also directly or indirectly affect its growth, physiology, and yield[3].
The persistence of water supply and the intermittence of irrigation or rainfall result in large variability of soil moisture in the paddy field. Irrigation guided by efficient moisture perception of vertical soil profiles of paddies could maximize water utilization and enhance the effect of irrigation on paddy rice production[4].
Due to restricted spatial variability of soil moisture, most soil information in paddy fields is obtained from field water levels[5]
and soil surface moisture[6,7]. Methods for moisture perception of
paddy soil profiles are limited, and thus the depth of the sensitive soil layer can only be determined by experience[8-10].
Previous studies have reported a certain correlation of moisture among different soil layers, and a comprehensive vertical soil moisture profile can be realized by measuring the moisture content of different soil layers[11]. Yang et al.[12], who combined the
practical experience of agricultural and water departments, proposed that with R-hierarchical clustering, the soil moisture status of the 0-100 cm depth of the soil can be better understood by laying soil moisture sensors at 10 cm, 20 cm, and 50 cm depths to obtain a vertical soil profile. Gao et al.[13] and Liu et al.[14] who
used KMO and Bartlett's spherical test to search for correlation of soil depth with soil moisture, proposed that the suitable detection depths of soil moisture sensors under suitable growth conditions of winter wheat and summer maize were 10 cm, 30 cm, 60 cm, 90 cm, and 10 cm, 30 cm, 50 cm and 70 cm, respectively. Shi et al.[15]
regression model of soil moisture between the surface soil (0-10 cm) and the crop root zone (0-50 cm). Zhang[17] showed that through
correlation analysis and variance test, the lower reaches of the Yellow River alluvial plains at an optimal depth of 30 cm can be used in the determination of soil moisture content to monitor the root layer (0-50 cm). Zheng et al.[18] used data fitting and
clustering analysis to divide the soil depth of 0-120 cm into six soil layers and showed that the depth of 60 cm represents the average moisture content of the 0–120 cm soil layer. Wang et al. [19]
reported that soil moisture content could be measured at a soil layer depth of 20-60 cm through linear regression analysis. Some scholars have confirmed that time-stable measuring points could better characterize the average soil moisture content and profile moisture of small watersheds. Kachanoski[20] and Dejong[21]
defined time stability as time consistency performed by soil moisture at different spatial forms and time sustainability, performed by the spatial distribution structure or pattern associated with the spatial scale. Soil moisture content of some soil layers is the result of the interaction of various hydrological processes on different spatial scales. For example, Grayson and Western[22]
applied time stability to study the watershed, found that there are some soil depths that can be used to continuously characterize the average soil moisture status of the entire study area. These depths are called the catchment average soil moisture monitoring. Martinez and Ceballos[23] proposed to use the root mean square
error (RMSE) of the representative mean soil moisture to characterize the whole catchment soil moisture status; however, the efficiency in using time stability in the dry period or the wet period has not been evaluated.
Currently, research about monitoring soil moisture for different depths within soil profile of rice fields is limited. Most existing studies focus on soil from rainfed croplands or lands without crops. Generally, these researches determine representative monitoring depths through correlations or cluster analysis, but did not take the influence of moisture transfers between different soil layers on sensitive soil layers into account. In addition, intermittent irrigation makes the spatial and temporal variations in soil profile moisture of rice fields more obvious than rainfed croplands. Through monitoring soil moisture of sensitive soil layers from rice field soil, the efficiency of soil profile moisture monitoring technology can be improved to enhance effective utilization of irrigation water.
In this study, irrigation experiments at different irrigation levels were carried out in rice fields. Research objectives were: (1) determine the spatial and temporal variation characteristics in soil moisture from different soil layers (0-100 cm) of rice field soil, (2) quantify the correlations soil moisture between each soil layer and the whole soil to determine the location of sensitive soil layers, (3) predict the moisture of the whole soil profile based on the location of sensitive soil layers through inversion method. This study is aimed at providing technical support for R&D of soil profile moisture sensors for rice fields and precision irrigation.
2 Materials and methods
2.1 Experimental methods
The experiment was conducted at the Rugao Experimental Demonstration Base of the National Engineering Technology Center of Information Agricultural (NETCIA) in Nanjing Agricultural University from July to October 2015. The experimental soil was silty loam soil. Average annual rainfall of experimental site is 1055.5 mm, and average sunshine is 2041.5 h.
In August, the total daylight duration is 229.8 h. The aerial images of the field experiment layout and soil moisture test layout are shown in Figure 1. W1, W2, and W3 were three kinds of moisture treatments. Each treatment consisted of three replicates. Simultaneously, two areas without crop planting were used as control (CK). The area of the plot was 30 m2 with the dimensions
of 5 m × 6 m. W1 sites were fully irrigated, maintained with a shallow water layer during the entire growth period, and drained when it exceeded a water level of 1-3 cm. W2 was subjected to deficit irrigation. It was maintained in the natural state, and W2 sites were irrigated when the moisture content of soil at a 10-20 cm depth in the tillage was < 30%. Otherwise, no irrigation was applied. The upper limit of irrigation was the fully saturated soil moisture content (100%). W3 received intermittent irrigation. W3 sites were irrigated when the soil moisture content of soil at a 20 cm depth in the tillage was < 30%, otherwise no irrigation was applied. The upper limit of irrigation of the paddy field was a water level of 3 cm. CK was used as control, and no crops were planted in the area. The irrigation treatment used for CK was the same as that used for W2.
Note: W1 was fully irrigated treatments, where a shallow water layer (1-3 cm) was maintained during the entire growth period. W2 was the deficit irrigation treatments where irrigation was applied when the soil water content at a 10-20 cm depth of the tillage was <30%. W3 received intermittent irrigation treatments, where irrigation was applied when the soil water content on the tillage 20 cm was <30%. CK showed control plot, where no crops were planted and the irrigation treatment was the same as that for W2. The red circle indicated the location of sensors in each plot.
Figure 1 Experimental field and soil moisture treatment layout. W1, W2, and W3 indicated three kinds of moisture treatments
2.2 Equipment
Soil moisture data was collected using a Diviner 2000 Portable soil moisture content monitoring system (Sentek, Australia) (Figure 2), which has a monitoring accuracy of 1% and can automatically and rapidly monitor the soil water content of 10 soil layers. It consists of a detector (probe), a connecting cable, a displayer, and a monitoring sleeve. The monitoring sleeve was installed in the experiment area prior to the initiation of the experiment. The length of the sleeve was 120 cm, which included the ground part (15 cm in length) and the underground part (105 cm in length), and was kept sealed.
growth period of the paddy rice was monitored with Diviner 2000.
Figure 2 Diviner 2000 Portable soil moisture content monitoring system
2.3 Data processing and analysis
2.3.1 Analysis of spatiotemporal variability in soil moisture Based on the method for calculating the coefficient of variation, the degree of variation in soil moisture content in W2, W3, and CK was analyzed at different time points. The spatial variability of soil moisture content during the entire growth period was described in terms of CVti, which was calculated as follows:
(
)
(
)
2 2 1 1 1 / 1 / n n it it i t i n it tn y y n n
CVt y n = = = ⎛ ⎛ ⎞ ⎞ × − × − ⎜ ⎜ ⎟ ⎟ ⎜ ⎝ ⎠ ⎟ ⎝ ⎠ = ⎛ ⎞ ⎜ ⎟ ⎝ ⎠
∑
∑
∑
(1)where yit is the measured value of soil moisture of the ith soil layer at time t, and n is the number of sampling times. The average variation coefficient CVt of the sampling points selected from the entire growth period at different depths was based on time stability evaluation in space. The larger the value of CVt, the bigger the time variability of soil moisture in the soil layer. The equation is as follows: 1 / m i i
CVt CVt m
=
⎛ ⎞
= ⎜⎝
∑
⎟⎠
(2)
where, m is the number of samples. Based on the degree of variation; CVti was divided into three categories. CVti values ranging from 0 to 10% were classified as the stable class, CVti values ranging from 10% to 25% were defined to be of the medium stable class, and CVti values ranging from 25% to 100% were designated to be of the unstable class.
2.3.2 Systemic cluster analysis
To reduce the number of soil layers used in profile moisture perception, soil layers of the same depth were grouped together and a representative soil layer was selected as the sensitive soil layer. Different soil layers were considered as variables {S1,…,Sn}, which were then divided into n classes. The distance between each two layers was then calculated and used to generate a symmetric distance matrix as follows:
12 1 21 2 1 2 0 0 (0) 0 n n n n d d d d D d d ⎡ ⎤ ⎢ ⎥ ⎢ ⎥ = ⎢ ⎥ ⎢ ⎥ ⎣ ⎦ L L
M M M M
L
(3)
where dijis the distance between the variables of the ith soil layer and the variables of the j soil layer. dij has many definitions and methods, but the Euclidean distance with the concept of spatial distance is the distance standard. Calculations were performed using the following equation:
2
1
( , ) k ( i i)
i
d x y x y
=
=
∑
− (4) where, d(x, y) is the Euclidean distance of two soil layers variables,xiis the value of the first soil layer variable of the sample i, and yi is the value of the second soil layer variable of sample i. The two soil layers with the nearest distance were firstly merged into a new class, and the new class was then re-aggregated with other unpolymerized classes according to the Euclidean distance. Finally, all subclasses were aggregated into one large class, and the charting of coalescence was obtained according to the distance aggregated.
2.3.3 Analysis of sensitive soil layers (1) Path analysis
The dependent variable y is the average moisture content of the entire soil profile from depths of 0-100 cm. xi(i=1,2,…,m), which represents the measured moisture content of soils from different soil layers, was designated as the independent variable that influences the dependent variable y, and xiand xj were correlated. The direct action statistic of variable xi to the dependent variable y
was called the direct path coefficient, which was expressed as Pi, where i=1, 2, ..., m. The correlation coefficient between the variables was calculated with the Pearson correlation coefficient method by using the following equation:
1 2 2 1 1 ( )( ) ( ) ( ) n
i i j j
i
ij n n
i i j j
i i
x x x x
r
x x x x
= = = − − = − −
∑
∑
∑
(5)where, xiand xj are the soil moisture contents at different depths, and xi and xj are the average soil moisture contents at different
depths. The correlation coefficient matrix R was calculated as follows:
1
11 12 1
2
21 22 2
1 2 y m y m my
m m mm
r
r r r
r
r r r
r
r r r
⎧ ⎫ ⎪ ⎪ ⎪ ⎪ = ⎨ ⎬ ⎪ ⎪ ⎪ ⎪ ⎩ ⎭ L L L L L R (6)
where, rij is the correlation coefficient between the independent variable xi and the independent variable xj. Here, rii=1, and
rij=rji(i,j=1,2,…,m). riy is the correlation coefficient of xiand y. The correlation coefficient between the independent variables and the dependent variable y was then used to compute the path coefficient using the following normalized multiple linear regression equation:
11 1 12 2 1 1
21 1 22 2 2 2
1 1 2 2
m i y
m i y
m m i my
r P r P r P r
r P r P r P r
r P r P P r
+ + + = ⎧ ⎪ + + + = ⎪ ⎨ ⎪ ⎪ + + + = ⎩ L L L L L (7)
where the general effect riyof xion y is divided into two parts. Pi is the direct effect of xion y, which is the direct path coefficient of
xito y. For the other m-1 terms, rijPj is the indirect effect of xion
y through the relative path of xj, which is the indirect path coefficient of xj to y.
In path analysis, the path coefficient is a statistic between the regression coefficient and the correlation coefficient, and is a relative coefficient without unit. The direct and indirect determination coefficients of the independent variables on the dependent variable y were defined as follows:
di=P2i, dij=2PirijPj=2PiPij
where, diis the direct decision coefficient produced by xifor the dependent variable y, and dij is the indirect determination coefficient of xion y through xj. The determination coefficient was calculated by using the path coefficient and the statistic. For the m equations, R2
1, R22, …, R2m were set as the determination coefficients after regression. Each R2 is the ratio that is
interpreted by the regression equation in the variance of the corresponding independent variables. Then, the determination coefficient R2(i) is xi produced for y, which is the total contribution of variable for R2, which is calculated as follows:
( )
1
2 2 2
1 1
i
m m m
i ij i iy
i i j i
R d −d Pr
= < =
=
∑
+∑
=∑
(9)
where, R2(i) is the comprehensive determination effect of xi on y through the relevant path of x1, x2, …, xm, which not only contains the direct effect di of xi on y, but also comprises the indirect determination coefficient dij that is associated with xi. The indirect determination coefficient dij not only contains the determination effect of xion y through xj, but also comprises the determination effect of xjon y through xi. Path analysis was used to assess the significance of the effect of xion y, and that of the R2(i)
of xi o y. The direct or indirect effect of xi on y through other independent variables was also analyzed to determine the sensitive soil layer for soil profile moisture efficient perception. The comprehensive effect of variables on y was arranged from largest to smallest, and the largest variables were considered as the main decision variables.
(2) Time stability analysis
Based on the ranking stability analysis and the calculation methods recommended by Vachaud[24] and Grayson and
Western[22], the time stability of 10 soil layers in this study was
analyzed. The calculation method for relative differences was as follows: , , , 1 , n
i j i j
i j j i
i j j j nS S S S δ S nS = − −
= =
∑
(10), 1
1 m
i i j
j
MRD δ
m =
=
∑
(11)(
)
2,
i j i
i
δ MRD σ
m
−
=
∑
(12) where, Si,jis the measured soil moisture value of i measured point at time j; Sj is the average value of soil moisture at time j; n is thenumber of measured points, MRDi is the mean relative difference of all the measured time locations, m is the number of observed sample time, and σi is the standard deviation of the relative difference for the measured location i.
MRD was mainly used to compare the measured value of a specific soil layer with the average value of the entire soil column, and the relationship between the two was analyzed, which was a relatively direct and effective method. The MRD of each soil layer including standard deviation was calculated, and then plotted to determine which soil layer could represent or estimate the average soil moisture for the entire soil column. The optimal perception soil layer for the average soil moisture was selected using two criteria. One is to measure the MRD of the measuring points. A value of zero indicated that this soil layer could accurately estimate the average of the entire soil column. Furthermore, when the standard deviation was very small (i.e.,
shorter error bars), then the estimated value of the variation was small. When a soil layer exhibited these two characteristics at the same time, then the soil layer location was the sensitive soil layer, which could be used in accurately estimating the average soil moisture of the entire soil column.
2.3.4 Verification of the results of comparative analysis
The measured moisture content of the sensitive soil layer was set as the optimal combination of the independent variables (forecasting factors) for the prediction of moisture status of the entire soil profile. The moisture status of the soil profile was verified through quantitative inversion. Finally, based on the multiple regression equation established by using the sensitive soil layers, the degree of fitting between the predicted data and the measured data was calculated. The feasibility of efficient estimating of the entire soil column moisture content based on the moisture of the sensitive soil layer was verified and evaluated. The soil moisture content of the sensitive soil layer was set as the controllable variables xi, and the ternary linear regression equation of the soil moisture content y in the entire soil profile was calculated. Root mean square error and correlation coefficients
( , )
Cor y y were used as indexes in predicting performance. The following equations were used:
(
)
2 1 n ai pi y y RMSE n −=
∑
(13)(
)
(
)
(
)
(
)
(
)
1 2 2 1 , nai a pi p
i n
ai a pi p
i
y y y y
Cor y y
y y y y
= = − − = − −
∑
∑
(14)where, yai and ypi are the respective measured values and the predicted values of the whole soil profile moisture at time i, and
a
y and yp are the respective mean values of the n measured
values and the n predicted values. Smaller RMSE indicates better predictive performance of the model, the correlation coefficient closer to 1represents higher the correlation between the measured value and the predicted value.
3 Results and discussion
3.1 Spatiotemporal Variations in Soil Moisture in the Paddy Field
Figure 3 shows the spatiotemporal variability in soil moisture content in the soil layer from 0 to 100 cm under the treatments of W2, W3, and CK during late tillering to milk maturation, which was from July 29, 2015 to October 3, 2015. Using the three irrigation treatments, the overall pattern of soil moisture content was the same in the entire growth period, and the coefficient of variation gradually decreased with the increasing soil depth. In general, the spatiotemporal variability in soil moisture content in W2 was the most extensive, and that of W3 was the smallest. Furthermore, crop planting significantly influenced soil moisture.
50 cm and 60 cm soil depths were 9.46% and 1.99%, respectively, which are categorized as the stable class. The spatial variability coefficient of soil moisture content at a 0-60 cm depth in W3 decreased from 8.92% to 0.87%, which indicated that these were of the stable class. The spatial variability coefficient of soil moisture content at a 0-60 cm depth in CK decreased from 21.02% to 1.52%. The coefficients of variation of soil layers at depths of 10, 20, 30, and 40 cm were 21.02%, 18.52%, 20.01%, and 14.77%, respectively, which are categorized as the medium stable class. The coefficients of variation of the soil layers at depths of 50 cm and 60 cm were 6.45% and 1.52%, respectively, which are categorized as the stable class. The variations in soil moisture at depths from 60 cm to 100 cm were relatively small (<2%) and within the range of 0-5%, belong to the stable class. In summary, W2 was determined to be the most unstable treatment. The surface layer depths of 0-20 cm were in the unstable class, depths of 30-40 cm were in the medium stable class, and depths of 50-100 cm were in the stable class. With CK treatment, depths of 0-40 cm were in the medium stable class, and depths of 50-100 cm were in the stable class. With W3 treatments, depths ranging from 0-100 cm were all in the stable class.
Figure 3 Variations in soil moisture using different treatments In the shallower soil layer, greater variations in soil moisture content and more moisture instability were observed. In the deeper the soil layer, smaller changes in soil moisture content and more stable the soil layer were discovered. The main reason for this difference was that at depths of 10 cm and 20 cm, crop roots and environmental factors influenced the soil surface, thereby resulting in variations in soil moisture. Soil moisture at depths of 30 cm and 40 cm was closely related to transpiration in surface soil crops, whereas soil moisture at depths of 50 cm and 60 cm was not only affected by the transpiration of surface soil crops, but also by groundwater that seeps into deeper soil layers. Once soil moisture has been depleted, it is immediately replenished by groundwater and restored to saturation. Due to the high water level, most of the soil moisture content at the 70-100 cm depth was in the saturated state. Therefore, during the entire growth period of paddy rice, soil layers that closely associated with transpiration and field water consumption in the paddy field were mainly concentrated in the depth from 0 to 60 cm. As an example, the soil vertical profile depths of moisture perception in paddy field were concentrated in this area.
3.2 Clustering Analysis of Soil Vertical Profile Moisture
W2, which had the largest variation, was selected for analysis, and the soil moisture of the paddy soil profile was analyzed by
cluster analysis. Soil moisture variables at depths of 70 cm, 80 cm, 90 cm, and 100 cm were merged into the first class, the distance for soil moisture in the four soil layers was the smallest, and the spatial variations in soil moisture were minimal. In addition, soil moisture variables at depths of 60 cm, 70 cm, 80 cm, 90 cm, and 100 cm were merged together, which indicated that the distance of these depths was slightly larger than that of the first class. Soil moisture variables at depths of 10 cm and 20 cm were merged into another class, which indicated that the distance between these two depth was small, and their changes were similar. Soil moisture variables at depths of 30 cm and 40 cm were also merged into a class, which indicated that changes in soil moisture were also similar.
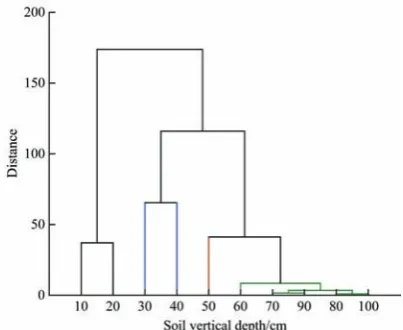
Figure 4 shows that when the soil moisture variables were classified into two classes based on the distance between the soil layers, soil moisture at depths of 10 cm and 20 cm was categorized as first class, and the other layers were categorized as second class. The first class represented the tillage layer, and the second class represented the moisture status of deep soil layers. When the moisture of the soil profile was divided into three classes, the soil moisture at depths of 10 cm and 20 cm was still categorized as first class. This classification indicated that the moisture distance at 10 cm and 20 cm depth was similar, and they could better reflect the soil moisture status of the tillage layer. The soil moisture at depths of 30 cm and 40 cm was categorized as second class, represented the soil moisture status of the subsoil layer. This class has been considered as the water supply capacity layer. The soil moisture at depths from 50 cm to 100 cm was categorized as third class, represented the soil moisture status of the gley and deep layers. This class was considered as the water storage capacity layer. These findings suggest that with the higher number of soil moisture classes, more sensitive soil layers should be selected and a higher number of soil moisture sensors should be deployed for soil moisture perception. For practical applications, soil moisture layers of the paddy soil vertical profile can be divided into three classes, namely, the main sensing tillage layer, water supply capacity layer, and water storage capacity layer. The first class ranged from soil depths of 0 to 20 cm, the second class was from depths of 30 cm to 40 cm, and the third class was from depths of 50 cm to 100 cm.
Figure 4 Clustering analysis of soil moisture in the paddy field
3.3 Moisture sensitive layer of the soil profile
3.3.1 Path analysis results
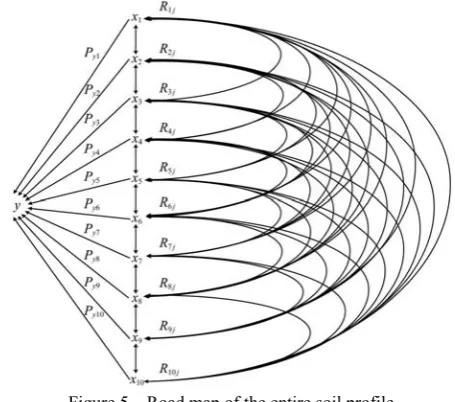
Figure 5 Road map of the entire soil profile
The normal equations of the path coefficient Piyof xifor y was solved based on Figure 5. Equation (6) was used to calculate the correlation coefficient between the variables. The direct and indirect effect of the factors on the results was calculated using Equation (7), and the results are shown in Table 1. The correlation coefficient riy between the soil depth and moisture content could be arranged in decreasing order as follows: 20 cm (0.901), 30 cm (0.879), 10 cm (0.858), 40 cm (0.707), and 100 cm (0.523). Path analysis showed that the maximum direct path coefficient occurred at x3 (0.334), followed by that at depths of
20 cm, 10 cm, 40 cm, and 50 cm. This indicated that the soil moisture at a soil depth of 30 cm had the greatest direct effect on the entire moisture profile, The minimum direct path coefficient occurred at x8 (0.003), followed by that at depths of 60, 70, 90, and 100 cm, indicated that the soil moisture at a soil depth of 80 cm had the smallest direct effect on the entire moisture profile.
Table 1 Direct and indirect effects of factors on soil moisture profile
Factors (riy) (Pi)
(Piy)
x1 x2 x3 x4 x5 x6 x7 x8 x9 x10 Total
x1 0.858 0.278 0.252 0.160 0.106 0.135 0.148 0.152 0.149 0.148 0.148 1.398
x2 0.901 0.309 0.280 0.209 0.125 0.156 0.166 0.167 0.166 0.165 0.165 1.598
x3 0.879 0.334 0.192 0.226 0.222 0.137 0.128 0.132 0.137 0.133 0.139 1.445
x4 0.707 0.250 0.095 0.101 0.166 0.070 0.056 0.044 0.043 0.047 0.047 0.669
x5 0.520 0.006 0.003 0.003 0.002 0.002 0.005 0.005 0.005 0.005 0.005 0.035
x6 0.520 0.004 0.002 0.002 0.002 0.001 0.004 0.004 0.004 0.004 0.004 0.025
x7 0.518 0.004 0.002 0.002 0.002 0.001 0.003 0.004 0.004 0.004 0.004 0.025
x8 0.519 0.003 0.002 0.002 0.001 0.001 0.002 0.003 0.003 0.003 0.003 0.019
x9 0.516 0.004 0.002 0.002 0.002 0.001 0.003 0.004 0.004 0.004 0.004 0.025
x10 0.523 0.005 0.003 0.003 0.002 0.001 0.004 0.005 0.005 0.005 0.005 0.032
Table 1 and Equations (8) and (9) were used to calculate the total contribution of 10 independent variables to R2, which was
used to estimate the reliability of the regression equation. The total contribution of the variables to R2 is shown in Figure 6.
Figure 6 Ordination plot of the total contribution of variables to
R2
Figure 6 shows that the total contribution of the 10 soil layers to R2 was as follows:
d12(0.173)>d23(0.151)>d43(0.148)>d21(0.140)>d32(0.129) x3 was the biggest contributor to the R2 of the entire soil profile,
which indicated that the most sensitive soil layer influences the entire soil moisture profile was at the depth of 30 cm. The first five indirect determination coefficients calculated by using equation (8) were arranged as
d12(0.173)>d23(0.151)>d43(0.148)>d21(0.140)>d32(0.129)
The relative determination coefficient produced by x2 and x3 on the entire soil moisture content y ranked second, and the total contribution of x2 to R2 also ranked second, which indicated that the
soil layer at the 20 cm depth was the second most sensitive soil layer. At the depth of 50-100 cm, the direct path coefficient of x5
was greater than that of x6, x7, x8, x9, and x10, and the total contribution of x5 to R2 was greater than x6, x7, x8, and x9. This
indicated that the soil layer at a 50 cm depth was the most sensitive soil layer affecting the soil profile moisture of the 50-100 cm depth. The total contribution of x1 to R2 was ranked third, but the soil
moisture content at the 10 cm depth, which was significantly influenced by the surrounding environmental factors, was not determined to be a sensitive soil layer. The total contribution of
x4 to R2 was ranked fourth, but for the classification, the depths of
40 cm and 30 cm were categorized as the same class. Because the 30 cm depth was determined to be the most sensitive layer, the 40 cm depth was not recommended as the sensitive layer. Cluster analysis and path analysis showed that the paddy soil profile could be divided into three classes, and the most sensitive soil layers to soil moisture were at the depths of 20, 30, and 50 cm.
3.3.2 Results of time stability analysis
average value. The MRD value of 40-100 cm depth was positive, which indicated that the soil moisture content at a 40-100 cm depth was higher than the measured average value. The MRD value of the 40-100 cm soil layer was close to 0, which indicated that the soil moisture at a depth of 40-100 cm exhibited overall time stability and the standard deviation was small with minor differences.
Figure 7 Average relative differences in different soil layer classifications
Combined with the results of cluster analysis in Figure 7, the first class comprised a depth range of 0-20 cm, and the length of the error bar at the 10 cm depth was the longest, which indicated that the estimated value variation at the 10 cm depth was larger, and 10cm depth was not suitable to serve as the sensitive layer. Thus, the best perception depth of the first class was at the 20 cm depth. The second class was from the 30-40 cm depth, and the length of the error bar at the 30 cm depth was longer than the error bar at the 40 cm depth, which indicated that the estimated value variation at the 30 cm depth was greater than that at the 40 cm depth. Therefore, the best perception depth of the second class was at the 40 cm depth. The third class was from the 50 cm to the 100 cm depth. The minimum MRD was at the 60 cm depth, and the length of the error bar at the 60 cm depth was the shortest, so the best perception depth in the range of 50-100 cm was at the 60 cm depth. Cluster and time stability analyses showed that the paddy soil profile was divided into three classes, and the most sensitive soil layers were at the 20, 40, and 60 cm depths.
3.4 Verification of the results of the comparative analysis
The soil moisture in the sensitive soil layers were used to predict the average soil moisture of the entire soil column. Correlation between the predicted values and the measured values was calculated by using a multivariate regression model of soil moisture at the depths selected by path analysis (20 cm, 30 cm, and 50 cm) and the depths selected by time stability analysis (20 cm, 40 cm, and 60 cm). Correlation analysis results are shown in Figure 8. The correlation coefficient Cor y y( , ) between the measured value and the predicted value of the path analysis was 0.980 (Figure 8a), indicated a strong correlation between the measured value and the predicted value. In addition, the RMSE was 0.40, which indicated that the prediction performance produced by the sensitive soil layers that was obtained through path analysis to predict the whole soil profile moisture was excellent. The correlation coefficient Cor y y( , )between the measured value and the predicted value was 0.962 (Figure 8b), which indicated that the measured value was also highly correlated with the predicted value, but the correlation coefficient was less than that of the path
analysis. The RMSE was 0.61 and was larger than that of the path analysis, which indicated that the sensitive soil layers obtained through time stability analysis showed better prediction performance than the sensitive soil layers obtained through path analysis.
a. Path analysis
b. Time stability analysis
Figure 8 Correlation analysis of the measured value and the predicted value
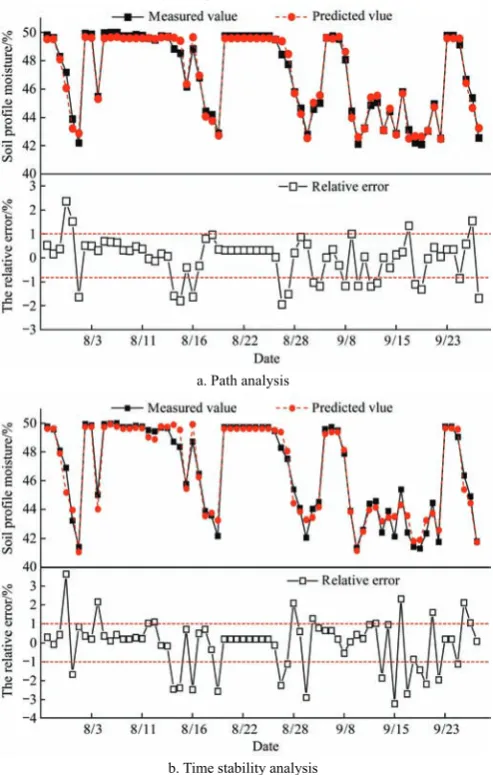
The comparison and the relative error between the measured value and the predicted value were shown in Figure 9. The results of the measured value and the predicted value of soil profile moisture content based on the sensitive layers showed that the pattern of the predicted value from the two methods coincided with the measured values. When the soil moisture content was badly affected by irrigation and rainfall, the real-time trend of the predicted value differed from that of the measured value. However, after irrigation and rainfall, when soil moisture was gradually affected by evapotranspiration in the paddy field, the real-time trend of the predicted value coincided with the measured value. This result proves that the predicted value in the slow-changing stage and in the stable stage can accurately reflect soil moisture.
layers can be used to accurately estimate soil moisture profile, and the sensitive soil depth selection of path analysis was superior to that of the time stability analysis.
a. Path analysis
b. Time stability analysis
Figure 9 Comparison and relative error of the measured and predicted mean soil moisture
4 Discussion
Traditional paddy soil moisture perception information mainly pertains to “point” information, and the relationship between “point” and “area” is often difficult to establish. Zheng
[18] has shown that the soil moisture content at a 60 cm depth can
represent the average moisture content of the 0-120 cm depths of the soil column. In the present study, the investigation on the spatiotemporal variability in soil moisture in the paddy field showed that the key areas of soil moisture perception in a vertical profile in the paddy field are within the depth range of 0-60 cm. Soil moisture perception of the root active layer can better reflect the soil moisture status of the root system, but the overall moisture trends of the root active layer and its effect on crop provide insufficient quantitative or qualitative information[25,26].
Souza et al. have designed an approach in using local soil moisture to reflect the overall soil moisture of the root soil layer. However, it is generally difficult and complicated to obtain measurements for the establishment of a model[27,28].
Furthermore, their analysis of sensitive soil layers mostly used simple correlation analysis or cluster analysis, which could not comprehensively examine the interrelationships between the soil layers and cannot avoid bias in result. In the present study, a
clustering method with Euclidean distance of spatial characteristic was used to divide the paddy soil vertical profile into three classes. The tillage layer at 0-10 cm and 10-20 cm depths comprised the first class, the water supply capacity layer at 20-30 cm and 30-40 cm depths was the second class, and the water storage capacity layer at the 50-100 cm depths was the third class. Firstly, the relationship between soil moisture in different soil layers and the entire soil profile was investigated, while the correlation coefficient between different soil layers and the entire soil profile was divided into the direct path coefficient and the indirect path coefficient. Secondly, the direct influence of different soil layers on the entire soil profile was analyzed, and the indirect influence of the soil layers on the whole profile through other related soil layers was analyzed simultaneously. Finally, the direct and indirect influence of each soil layer on the entire soil profile was quantified, and three optimal sensitive soil layers were determined at the 20 cm, 30 cm, and 50 cm depths. The average relative difference map of various soil layers was constructed using the results of time stability analysis. Three sensitive soil layers were identified, namely, the 20 cm, 40 cm, and 60 cm depths.
The vertical distribution cumulative percentage of paddy root biomass was 70%-79% at 0-24 cm depth. Soil moisture sensors should thus be placed at the top and bottom of the crop root active layer, and the deep leakage of irrigation should be controlled as much as possible[29,30]. The sensitive perception depth obtained
through path analysis coincided with the soil moisture perception depth of the soil profile under the requirements of the paddy rice root distribution, and the soil moisture content at the depths selected by path analysis (20 cm, 30 cm, and 50 cm) and at the depths selected by time stability analysis (20 cm, 40 cm, and 60 cm) were controlled as variables. An equation that constructed after ternary regression was used to predict the entire soil profile moisture, and the prediction was further verified by measurement. The results showed that based on the depths selected by path analysis, the prediction value of soil profile moisture was highly correlated with that of the measured value. The relative error range between the predicted value and the measured value was <±3%, and most of the relative error range was <1%, so the soil moisture of the sensitive layer could be used to efficiently determine soil moisture content of the entire soil profile. Based on the depths selected by time stability analysis, a strong correlation between the predicted and the measured soil moisture values was observed. The relative error range between the predicted and the measured values was <±3%. When soil moisture dramatically changed by irrigation or rainfall, the relative error significantly increased, which was in agreement with the measured RMSE results of the typical average soil moisture reported by Martinez and Ceballos[23]. These
layers or points may provide a more reliable and comprehensive basis for efficient sensing of soil profile moisture and moisture prediction for the entire soil profile.
However, the approach used in this study was only applied on one single type of rice paddy field. As obvious differences may be found in the spatial and temporal variations of soil profile moisture for different soil types, more experiments need to be carried out in different types of soil in the future. This study is expected to provide a new technique and method for soil profile moisture perception for other related research in future.
5 Conclusions
The variation coefficient of soil moisture in paddy soil gradually decreased with the increasing soil depth. W2 was determined to be the most unstable treatment. The surface layer at a depth range of 0-20 cm was determined to be the unstable class, the depth range of 30-40 cm was shown to be of medium stability, and the depth range of 50-100 cm was described as stable. The moisture perception area of the paddy soil profile was determined to range from the 0-60 cm depth. The paddy soil profile was divided into three classes, namely, the tillage layer (0-20 cm), the water supply capacity layer (30-40 cm), and the water storage capacity layer (50-100 cm). Path analysis showed that soil moisture at a 30 cm depth had the largest direct effect on soil profile moisture, followed by the 20 cm depth. The 50 cm depth had the largest direct effect on the total contribution to R2 of the regression equation and the whole soil
profile moisture. The depths of 20, 30, and 50 cm were identified to be the sensitive soil layers in the paddy field. Combined with the results of cluster analysis, time stability analysis showed that the MRD value and error bars at the 20 cm depth were <10 cm, the MRD value and error bars at the 40 cm depth were <30 cm, the MRD value and error bars at the 60 cm depth were less than that of the other soil layers, and the depths 20 cm, 40 cm, and 60 cm were categorized as sensitive soil layers of the paddy field. The soil moisture of the sensitive layers was used to predict the whole soil profile moisture content, and the results were used to compare the accuracy of the two methods. Correlation coefficient between the predicted and the measured values obtained through path analysis was 0.980, and the RMSE was 0.40. The correlation coefficient between the predicted and the measured values obtained through time stability analysis was 0.962, and the RMSE was 0.61. These findings indicate that path analysis is superior to time stability analysis. Therefore, the soil sensitive layers in the paddy field were at the 20 cm, 30 cm, and 50 cm depths. In terms of deployment of soil moisture sensors in the paddy field, the number of sensors could be reduced based on the number of sensitive soil layers.
Acknowledgements
This work was financially supported by the National Key Research and Development Program of China (2016YFD0300607), the Three New Project of Agricultural Machinery in Jiangsu Province (NJ2017-23), the Independent Innovation of Agricultural Science and Technology in Jiangsu Province (SCX(16)1006), and The Priority Academic Program Development of Jiangsu Higher Education Institutions (PAPD).
[References]
[1] Coelho E F, Or D. Flow and uptake patterns affecting soil water sensor
placement for drip irrigation management. Trans of the ASAE, 1996; 39(6): 2007–2016.
[2] Aljoumani B, Sànchez-Espigares J A, Cañameras N, Josa R, Monserrat J. Time series outlier and intervention analysis: irrigation management influences on soil water content in silty loam soil. Agricultural Water Management, 2012; 111(4): 105–114.
[3] Starks P J, Heathman G C, Ahuja L R, Ma L W. Use of limited soil property data and modeling to estimate root zone soil water content. Journal of Hydrology, 2003; 272(1-4): 131–147.
[4] Han Y G, Wu H F, Yang P L, Wang Y Q, Li B, Kong Q H. Optimal burial depth of soil moisture sensors for tomato-plangting field. Bulletin of Soil & Water Conservation, 2013; 33(4): 260–263. (in Chinese) [5] Shen X, Sun J, Zhang J, Wang J, Li S, Yang G. Study on the placement
of sensors for moisture content in soil profile for cotton under mulched drip irrigation condition. Agricultural Research in the Arid Areas, 2012; 30(3): 90–95. (in Chinese)
[6] Wang F, Huang L, Wu S, Li K, Li J, Gao Y, Cao Y. Design of multi-channel data acquisition and processing model and optimization of moisture sensor burying position. Transactions of the CSAE, 2015; 31(21): 148–153. (in Chinese)
[7] Qualls R J, Scott J M, Deoreo W B. Soil moisture sensors for urban landscape irrigation: Effectivenss and reliability. Journal of the American Water Resources Association, 2001; 37(3): 547–559.
[8] Wang X, Liu F, Han X. Influence of soil physical and chemical properties on performance of soil profile moisture sensor. Transactions of the CSAM, 2012; 43(11): 97–101.
[9] Zhang X, Li R, Jiao M, Zhang Q, Wang Y, Li J. Development of soil moisture monitor and forecast system. Transactions of the CSAE, 2016; 32(18): 140–146. (in Chinese)
[10] Yang T, Gong H, Li X, Zhao W, Meng D. Progress of soil moisture monitoring by remote sensing. Acta Ecologica Sinica, 2010; 22: 6264–6277.
[11] Zhou Q, Jun S. Temporal stability of the spatial distribution pattern of soil water. Acta Pedologica Sinica, 2003; 40(5): 683–690.
[12] Yang S, Wang Y, Sun K. Soil Moisture Content Sensors Placement Based on the Vertical Variety Law. Transactions of the CSAM, 2008; 39(5): 104–107. (in Chinese)
[13] Gao Y, Liu Z, Duan A, Liu Z, Zhang J, Sun J. Laying depth of soil moisture probe in soil profile and date processing technology. Journal of Irrigation and Drainage, 2011; 30(5): 28–32. (in Chinese)
[14] Liu Z, Gao Y, Duan A, Cheng J. Study on the soil moisture probe laying place of farmland in Shangqiu District of Henan Province. Water Saving Irrigation, 2008; 8: 19–22, 25. (in Chinese)
[15] Shi Y, Li F, Sun K, Wang Z, Dong C. Study on the Moisture Sensor Laying Place in Watching and Forecasting Soil Moisture Content. Journal of Laiyang Agricultural College, 2006; 23(3): 179–184. (in Chinese)
[16] Ragab R. Towards a continuous operational system to estimate the root-zone soil moisture from intermittent remotely sensed surface moisture. Journal of Hydrology, 1995; 173(14): 1–25.
[17] Zang Y, Ou-yang Z, Guo J, Li Y, Cheng B, Liu E. Research on the best measurement depth for determining the dynamic soil moisture content of root layer soil moisture. China Rural Water and Hydropower, 2010; 9: 102–104. (in Chinese)
[18] Zheng L, Ma J, Guo F, Ren R, Guo X, Sun X. Monitoring location of soil water content in water storage pit irrigated dwarfed apple tree orchard. Transactions of the CSAM, 2015; 46(10): 160–166. (in Chinese)
[19] Wang X, Jia Y. Sampling depth analysis of farmland soil moisture forecast. Water Resources Science and Technology of Shandong, 1997; 4: 6–8. (in Chinese)
[20] Kachanoski R G, Jong E. Scale dependence and the temporal persistence of spatial patterns of soil water storage. Water Resources Research, 1988; 24(1): 85–91.
[21] De J C. The contribution of condensation to the water cycle under high-mountain conditions. Hydrological Processes, 2010; 19(12): 2419–2435.
[22] Grayson R B, Western A W. Towards areal estimation of soil water content from point measurements: time and space stability of mean response. Journal of Hydrology, 1998; 207(1-2): 68–82.
spatially measured soil water probability density function. Soil Science Society of America Journal, 1985; 49(4): 822–828.
[25] Shae J B, Steele D D, Gregor B L. Irrigation scheduling methods for popcorn in the northern great plains. Transactions of the ASAE, 1999; 42(2): 351–360.
[26] Shock C C, Feibert E B G, Saunders L D. Irrigation criteria for drip-irrigated onions. Hortscience: A Publication of the American Society for Horticultural Science, 2000; 35(1): 63–66.
[27] Souza C F, Folegatti M V, Or D. Distribution and storage characterization of soil solution for drip irrigation. Irrigation Science,
2009; 27(4): 277–288.
[28] Liu J, Ma X, Zhang Z. Spatial variability of soil water retention curve in different soil layers and its affecting factors. Transactions of the CSAM, 2010; 41(1): 46–52.
[29] Zhang Y, Qin H, Huang M, Li Z, Yang C, Wang N, et al. Mathematical simulation of rice root spatial distribution and its application. Journal of South China Agricultural University, 2013; 34(3): 304–308. (in Chinese) [30] Cai K, Luo S, Duan S. The relationship between spatial distribution of