Distressed Firms and Dividend Reductions
Steven C. Hall1, Vipin K. Agrawal2 & Pushpa Agrawal1
1
Department of Accounting, Finance, and Economics, University of Nebraska at Kearney, USA
2 Department of Finance, University of Texas at San Antonio, USA
Correspondence: Steven C. Hall, Department of Accounting, Finance, and Economics, University of Nebraska at Kearney, USA
Received: January 11, 2019 Accepted: February 20, 2019 Online Published: February 23, 2019
doi:10.5430/afr.v8n1p222 URL: https://doi.org/10.5430/afr.v8n1p222
Abstract
We are interested in the effects of dividend reduction decisions on the firms that make them. Research shows that dividends tend to follow earnings as earnings increase but are less likely to follow earnings down. We speculate that there must be a cost associated with dividend reductions that cause this reluctance to decrease dividends as earnings decline. We form several hypotheses related to potential costs. To test these hypotheses, we examine changes in various financial ratios in each of the three years following a reduction in dividends. We also compare the changes in financial ratios of distressed dividend-reducing firms to those of distressed firms that did not reduce dividends and of non-distressed dividend-reducing firms to those of non-distressed firms that did not reduce dividends. Results do not indicate that there are costs, but rather, benefits of dividend reductions to both distressed and non-distressed firms. We find one cost of reducing dividends to non-distressed firms, i.e., a drop in the market value of the firm in the year following the dividend reduction.
Keywords: distressed firms, dividend reduction 1. Introduction
We are interested in the costs of dividend reductions on distressed and non-distressed firms. Research indicates that firms make dividend decisions to signal future earnings expectations and to distribute residual earnings or cash flows (Aharony and Swary, 1980 and Baker and Smith, 2006, for examples). Research also shows that dividends tend to follow earnings as earnings increase but are less likely to follow earnings down, that there is a reluctance to reduce dividends (DeAngelo and DeAngelo, 1990). We speculate that there are costs and benefits to dividend reductions and those costs may help explain the reluctance to reduce dividends. We also speculate that costs of dividend reductions differ between firms that are in distress and those that are not.
2. Dividends and Effects of Dividend Reduction on the Firm
The two primary explanations for dividend payout are (1) to distribute excess cash to the shareholders and (2) to signal to investors management’s assessment of future cash flows and investment opportunities. There is general agreement in the literature that dividends seem to follow earnings as earnings increase, but there is a general reluctance to reduce dividends as earnings fall. Such a tendency would be difficult to explain if we focused exclusively on the notion that the purpose of dividend payout is to distribute excess cash. However, it is not surprising relative to the notion of signaling.
When a dividend is initiated or increased the signal to investors is a positive signal. Earnings and cash flows can be maintained or increased in the future, and since dividends are rarely decreased, those earnings and cash-flow implications are for an indefinite period into the future. It has been shown that the market reacts positively to such news and the rewards are positive to the manager (e.g., Healy and Palepu, 1988, Michaely et al, 1995, Brooks et all, 1998, Grullon et al, 2002, and Lee and Yao, 2003). On the other hand, dividend omissions or reductions have the opposite effect in both the signal and the effect. The negative market reaction to dividend reductions is greater in magnitude than the positive reaction to dividend increases. We are interested in concurrent and longer-term effects on the firm that result from a reduction in dividends.
rates (Cohen and Yagil, 2009). Signaling and smoothing incentives will have less effect on distressed firms. Bankruptcy risk will have different implications for distressed firms. Strategic incentives to cut dividends may be different for distressed and non-distressed firms.
3. Hypotheses
This section develops hypotheses regarding the effects of dividend reductions on firms. There is some discussion about how the effect might be different for distressed and non-distressed firms as well.
3.1 Effect on Market Value
As noted, event studies of dividend reductions report a negative market effect for dividend reductions. For a firm that is not distressed the signal could be that earnings and cash flows will be lower in the future, that there are reduced investment opportunities. However, the firm also could be making the dividend reduction decision to conserve cash for a new investment opportunity.
For distressed firms, the dividend reduction may be in response to binding dividend constraints in the firms’ debt contracts. The firm is unable to maintain earnings at a level to avoid this debt-contracting cost. The effect on market values may be mitigated by the fact that the reduction would not be unexpected.
We measure the market-value effect with two ratios, market value to sales and market value to book value. We predict that the effect will be smaller with distressed firms since the financial difficulty leading to the dividend reduction should already be impounded in the stock price.
H1: Firms that reduce dividends will have lower market values and more negative changes in market values
following a dividend reduction than firms that did not reduce dividends. 3.2 Opportunity
Firms that reduce dividend payout will have more cash than they would otherwise and, thus, will have more opportunity to invest. We measure the opportunity effect with the ratio of capital expenditures to total assets. We predict that dividend reducing firms will have higher capital expenditures than firms that do not reduce dividends. We expect the effect to be more pronounced in non-distressed firms, since distressed firms may be more likely to reduce capital expenditures as a result of financial distress independent of the dividend decision.
H2: Firms that reduce dividends will have greater capital expenditures than firms that did not reduce
dividends. 3.3 Liquidity
Firms that reduce dividends will have more cash or less debt than if they had used the cash or borrowed money to pay a dividend. Thus, the direct effect on the firm will be an increase in liquidity. On the other hand, the lack of liquidity may have initiated the dividend reduction. We measure liquidity as cash to total assets.
H3: Firms that reduce dividends will have higher liquidity than firms that do not.
3.4 Capital
Since firms are reluctant to reduce dividends, a reduction by distressed firms signals an inability to produce cash flows sufficient to avoid binding dividend constraints or other factors that force the dividend cut. Such firms will find it more difficult to raise needed capital. Distressed firms that reduce dividends may lose the power to raise capital required to remain viable. Without financial backers, these firms are more likely to fail. We measure the firm’s ability to raise capital with sales growth, total liabilities to common stockholders’ equity, and retained earnings to total stockholders’ equity.
H4: Distressed firms that reduce dividends will have more difficulty raising capital relative to distressed
firms that do not reduce dividends and relative to non-distressed firms. 3.5 Profitability
Distressed firms may be obligated to reduce dividends due to debt contracting constraints, e.g., a binding dividend constraint or risk of default. Reduced appeal for the firms’ products may follow. Non-distressed firms are not expected to experience the same effect. We measure profitability with return on assets.
H5: Distressed firms that reduce dividends will experience reduced profitability relative to distressed firms
4. Method and Data
Our sample of firms in categorized into four groups, i.e., distressed firms that reduced dividends, distressed firms that did not reduce dividends, non-distressed firms that reduced dividends, and non-distressed firms that did not reduce dividends. For each group, we calculated the change in each financial ratio for each of the three years following the dividend reduction. We use one-sample t-tests assuming mean differences of zero to test for the effect of the dividend reduction on the ratios in each group. We use a two-sample t-test for differences of means to compare the changes in each ratio between groups.
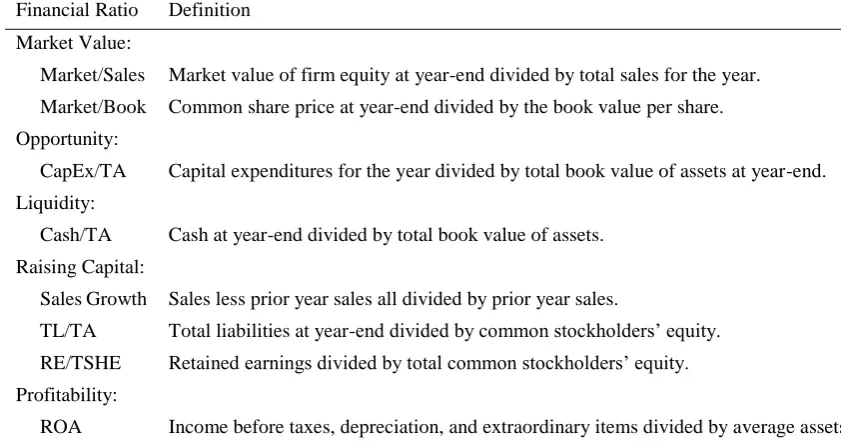
Table 1. Financial ratio definitions
Financial Ratio Definition
Market Value:
Market/Sales Market value of firm equity at year-end divided by total sales for the year. Market/Book Common share price at year-end divided by the book value per share. Opportunity:
CapEx/TA Capital expenditures for the year divided by total book value of assets at year-end. Liquidity:
Cash/TA Cash at year-end divided by total book value of assets. Raising Capital:
Sales Growth Sales less prior year sales all divided by prior year sales.
TL/TA Total liabilities at year-end divided by common stockholders’ equity. RE/TSHE Retained earnings divided by total common stockholders’ equity. Profitability:
ROA Income before taxes, depreciation, and extraordinary items divided by average assets.
We used two alternative definitions of distress that are found in the literature (Bhagat et al, 2005 and Altman, 1968). First, we defined stress as two successive years of reporting a net loss. The alternative measure of distress used the Altman’s Z-score (Altman et al, 2013). Altman estimates the financial health of a firm using an overall index Z, where:
Z = 0.717X1 + 0.847X2 + 3.10X3 + 0.420X4 + 0.998X5,
and where X1 is the working capital to total assets, X2 is the retained earnings to total assets, X3 is the ratio of earnings before interest and tax to total assets, X4 is the book value of equity to total liabilities, and X5 is sales to total assets. The distressed condition is defined as having an Altman’s Z-score less than 2.675.
We obtained our data from Compustat, 1984-2014. We deleted regulated industries. We also deleted firms that had less than three years of stable or increasing dividends. The result was 2,371 dividend paying companies and 46,374 firm-years. We defined a dividend-reducer as a firm that reduced dividends by at least 10% from the previous year. That gave us 4,785 firm-years with dividend reductions. Data availability to determine distress and non-distress using the two different definitions of distress also reduced the number of firms available for analysis. Table 2 gives the number of firm/years used in our analysis for each of the firm distressed/non-distressed dividend reduced/dividend not reduced categories.
Table 2. Number of Firm Years Used in Our Tests
Dividends Reduced Dividends Not Reduced
Distressed by 2 years of losses 403 433
Not distressed by 2 years of losses 4,383 41,156
Distressed per Altman’s Z-score 1,247 10,838
5. Results
Results of our tests are mixed relative to predictions. They are reported in Tables 3-10. 5.1 Effect on Market Value
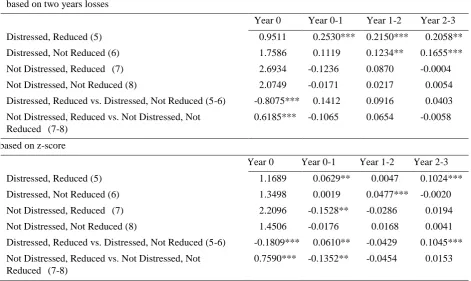
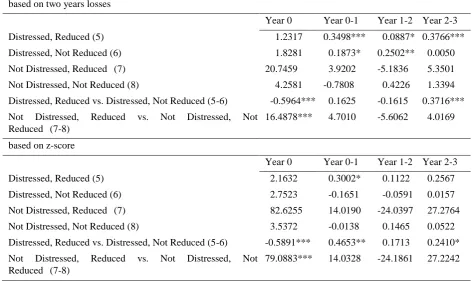
Tables 3 and 4 report the results of our tests of the changes in market value relative to the year of the dividend reduction. Contrary to our expectations, there is some indication that market value increases for distressed firms that reduce dividends. Whether we measure distress as two consecutive years of losses or measure distress using Altman’s Z-score, and whether we measure market value as the ratio of market value to sales or the ratio of market value to book value, there is a significant increase in market values in the years following a dividend reduction by distressed firms. When comparing the changes in market value of distressed firms that reduced dividends with distressed firms that did not, the results are not as strong. However, in both of the Z-score models, market value changes are significantly greater for the dividend reducing firms.
There is some evidence that non-distressed firms experience a decline in value in the year following the dividend reduction. The only significant finding is in the market to sales ratio test based on the Z-score.
Table 3. Comparison of changes in Market/Sales Ratio based on two years losses
Year 0 Year 0-1 Year 1-2 Year 2-3
Distressed, Reduced (5) 0.9511 0.2530*** 0.2150*** 0.2058**
Distressed, Not Reduced (6) 1.7586 0.1119 0.1234** 0.1655***
Not Distressed, Reduced (7) 2.6934 -0.1236 0.0870 -0.0004
Not Distressed, Not Reduced (8) 2.0749 -0.0171 0.0217 0.0054 Distressed, Reduced vs. Distressed, Not Reduced (5-6) -0.8075*** 0.1412 0.0916 0.0403 Not Distressed, Reduced vs. Not Distressed, Not
Reduced (7-8)
0.6185*** -0.1065 0.0654 -0.0058
based on z-score
Year 0 Year 0-1 Year 1-2 Year 2-3
Distressed, Reduced (5) 1.1689 0.0629** 0.0047 0.1024***
Distressed, Not Reduced (6) 1.3498 0.0019 0.0477*** -0.0020
Not Distressed, Reduced (7) 2.2096 -0.1528** -0.0286 0.0194 Not Distressed, Not Reduced (8) 1.4506 -0.0176 0.0168 0.0041 Distressed, Reduced vs. Distressed, Not Reduced (5-6) -0.1809*** 0.0610** -0.0429 0.1045*** Not Distressed, Reduced vs. Not Distressed, Not
Reduced (7-8)
0.7590*** -0.1352** -0.0454 0.0153
Table 4. Comparison of changes in Market/Book Ratio based on two years losses
Year 0 Year 0-1 Year 1-2 Year 2-3
Distressed, Reduced (5) 1.2317 0.3498*** 0.0887* 0.3766***
Distressed, Not Reduced (6) 1.8281 0.1873* 0.2502** 0.0050
Not Distressed, Reduced (7) 20.7459 3.9202 -5.1836 5.3501
Not Distressed, Not Reduced (8) 4.2581 -0.7808 0.4226 1.3394 Distressed, Reduced vs. Distressed, Not Reduced (5-6) -0.5964*** 0.1625 -0.1615 0.3716*** Not Distressed, Reduced vs. Not Distressed, Not
Reduced (7-8)
16.4878*** 4.7010 -5.6062 4.0169
based on z-score
Year 0 Year 0-1 Year 1-2 Year 2-3
Distressed, Reduced (5) 2.1632 0.3002* 0.1122 0.2567
Distressed, Not Reduced (6) 2.7523 -0.1651 -0.0591 0.0157 Not Distressed, Reduced (7) 82.6255 14.0190 -24.0397 27.2764 Not Distressed, Not Reduced (8) 3.5372 -0.0138 0.1465 0.0522 Distressed, Reduced vs. Distressed, Not Reduced (5-6) -0.5891*** 0.4653** 0.1713 0.2410* Not Distressed, Reduced vs. Not Distressed, Not
Reduced (7-8)
79.0883*** 14.0328 -24.1861 27.2242
Notes: One tail t-test, * 10 percent level, ** 5 percent level, and *** 1 percent level 5.2 Opportunity
Table 5 reports the results of our tests of the ratio of capital expenditures to total assets. In the model that defines distress as two consecutive years of losses, capital expenditures for distressed firms increase in the three years after a dividend reduction and significantly so in year 2. However, compared to firms that did not reduce dividends, capital expenditures are significantly higher in year 2 but significantly lower in year 3. In the Z-score model, dividend reducers have a greater increase in capital expenditures in all three years but significantly so only in year 3. These results provide some evidence to support our hypothesis.
Table 5. Comparison of changes in Capital Expenditures/Total Assets based on two years losses
Year 0 Year 0-1 Year 1-2 Year 2-3
Distressed, Reduced (5) 0.0261 0.0006 0.0053*** 0.0020
Distressed, Not Reduced (6) 0.0526 -0.0062 -0.0049 0.0042**
Not Distressed, Reduced (7) 0.0455 -0.0003 0.0007 0.0008 Not Distressed, Not Reduced (8) 0.0541 -0.0017*** -0.0005 -0.0006 Distressed, Reduced vs. Distressed, Not Reduced (5-6) -0.0266*** 0.0068 0.0101* -0.0022*** Not Distressed, Reduced vs. Not Distressed, Not
Reduced (7-8)
-0.0086*** 0.0014* 0.0011 0.0014***
based on z-score
Year 0 Year 0-1 Year 1-2 Year 2-3
Distressed, Reduced (5) 0.0551 -0.0004 -0.0003 0.0017**
Distressed, Not Reduced (6) 0.0639 -0.0012* -0.0008 -0.0021***
Not Distressed, Reduced (7) 0.0520 0.0011 0.0013 -0.0041** Not Distressed, Not Reduced (8) 0.0616 0.0012 -0.0017 -0.0018 Distressed, Reduced vs. Distressed, Not Reduced (5-6) -0.0088*** 0.0008 0.0005 0.0038*** Not Distressed, Reduced vs. Not Distressed, Not
Reduced (7-8)
-0.0095*** -0.0001 0.0030 -0.0023***
Notes: One tail t-test, * 10 percent level, ** 5 percent level, and *** 1 percent level 5.3 Liquidity
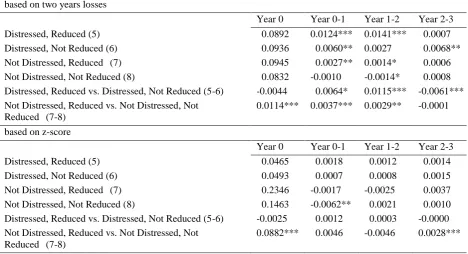
Results for our test of liquidity are reported in Table 6. These results support our hypothesis for both distressed and non-distressed firms. In the two years of losses model, the change in cash to total assets is significantly greater in years one and two and significantly less in year three for distressed firms that reduced dividends compared to distressed firms that did not. Also, the change in cash to total assets is significantly greater in years one and two for non-distressed firms that reduced dividends compared to non-distressed firms that did not. In the Z-score model, the results were mostly not significant.
Table 6. Comparison of changes in Cash/Total assets based on two years losses
Year 0 Year 0-1 Year 1-2 Year 2-3
Distressed, Reduced (5) 0.0892 0.0124*** 0.0141*** 0.0007
Distressed, Not Reduced (6) 0.0936 0.0060** 0.0027 0.0068** Not Distressed, Reduced (7) 0.0945 0.0027** 0.0014* 0.0006 Not Distressed, Not Reduced (8) 0.0832 -0.0010 -0.0014* 0.0008 Distressed, Reduced vs. Distressed, Not Reduced (5-6) -0.0044 0.0064* 0.0115*** -0.0061*** Not Distressed, Reduced vs. Not Distressed, Not
Reduced (7-8)
0.0114*** 0.0037*** 0.0029** -0.0001
based on z-score
Year 0 Year 0-1 Year 1-2 Year 2-3
Distressed, Reduced (5) 0.0465 0.0018 0.0012 0.0014
Distressed, Not Reduced (6) 0.0493 0.0007 0.0008 0.0015
Not Distressed, Reduced (7) 0.2346 -0.0017 -0.0025 0.0037
5.4 Capital
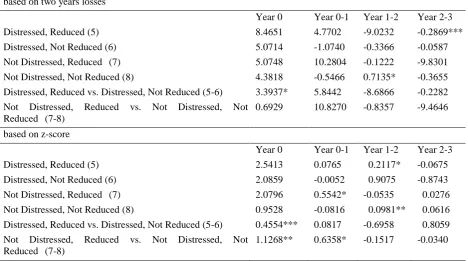
Results of our test of the ability to raise capital are reported in Tables 7-9. Results in Table 7 indicate support for a one-year increase in sales growth for dividend reducers relative to those firms that did not reduce dividends in both distressed and non-distressed firms. Results after the first year are less conclusive. Tables 8 and 9 do not provide any statistically significant evidence in support of our hypothesis.
Table 7. Comparison of changes in Sales Growth
based on two years losses
Year 0 Year 0-1 Year 1-2 Year 2-3
Distressed, Reduced (5) 0.1901 -0.1786 0.0671** 0.0627*
Distressed, Not Reduced (6) 0.7876 -0.6436 -0.0301 -0.0140
Not Distressed, Reduced (7) 0.0262 0.1447** -0.0857 0.0673 Not Distressed, Not Reduced (8) 0.1319 -0.0040 0.5573 -0.1014 Distressed, Reduced vs. Distressed, Not Reduced (5-6) -0.8230 0.6920 0.0953*** -0.0114* Not Distressed, Reduced vs. Not Distressed, Not
Reduced (7-8)
-0.1057*** 0.1487* -0.1414 0.1688*
based on z-score
Year 0 Year 0-1 Year 1-2 Year 2-3
Distressed, Reduced (5) 0.0324 0.0187** 0.0079 -0.0071
Distressed, Not Reduced (6) 0.0968 -0.0093 -0.0046 -0.0059
Not Distressed, Reduced (7) 0.0503 0.0475*** -0.0132 -0.0148 Not Distressed, Not Reduced (8) 0.1021 -0.0311*** 0.0145* -0.0043 Distressed, Reduced vs. Distressed, Not Reduced (5-6) -0.0644*** 0.0280** 0.0125 -0.0012 Not Distressed, Reduced vs. Not Distressed, Not
Reduced (7-8)
-0.0518*** 0.0786*** -0.0277* -0.0105***
Notes: One tail t-test, * 10 percent level, ** 5 percent level, and *** 1 percent level Table 8. Comparison of changes in Total Liabilities/CSHE
based on two years losses
Year 0 Year 0-1 Year 1-2 Year 2-3
Distressed, Reduced (5) 8.4651 4.7702 -9.0232 -0.2869***
Distressed, Not Reduced (6) 5.0714 -1.0740 -0.3366 -0.0587
Not Distressed, Reduced (7) 5.0748 10.2804 -0.1222 -9.8301
Not Distressed, Not Reduced (8) 4.3818 -0.5466 0.7135* -0.3655
Distressed, Reduced vs. Distressed, Not Reduced (5-6) 3.3937* 5.8442 -8.6866 -0.2282 Not Distressed, Reduced vs. Not Distressed, Not
Reduced (7-8)
0.6929 10.8270 -0.8357 -9.4646
based on z-score
Year 0 Year 0-1 Year 1-2 Year 2-3
Distressed, Reduced (5) 2.5413 0.0765 0.2117* -0.0675
Distressed, Not Reduced (6) 2.0859 -0.0052 0.9075 -0.8743
Not Distressed, Reduced (7) 2.0796 0.5542* -0.0535 0.0276
Not Distressed, Not Reduced (8) 0.9528 -0.0816 0.0981** 0.0616 Distressed, Reduced vs. Distressed, Not Reduced (5-6) 0.4554*** 0.0817 -0.6958 0.8059 Not Distressed, Reduced vs. Not Distressed, Not
Reduced (7-8)
1.1268** 0.6358* -0.1517 -0.0340
Table 9. Comparison of changes in Retained Earnings/Common Stockholders’ Equity based on two years losses
Year 0 Year 0-1 Year 1-2 Year 2-3
Distressed, Reduced (5) 0.6560 0.0604 -0.0188 -0.0918
Distressed, Not Reduced (6) 0.6261 -0.0180** 0.0009 0.0153*** Not Distressed, Reduced (7) 0.6502 -0.0060 0.1140 -0.0937 Not Distressed, Not Reduced (8) 0.7624 -0.0192 0.0067* 0.0513* Distressed, Reduced vs. Distressed, Not Reduced (5-6) 0.0299 0.0783 -0.0197 -0.1070 Not Distressed, Reduced vs. Not Distressed, Not
Reduced (7-8)
-0.1122*** 0.0132 0.1073 -0.1450*
based on z-score
Year 0 Year 0-1 Year 1-2 Year 2-3
Distressed, Reduced (5) 0.5866 -0.0037 0.0087** 0.0070**
Distressed, Not Reduced (6) 0.7094 -0.0276 0.0163 0.0183
Not Distressed, Reduced (7) 0.8597 -0.0169 0.5051 -0.5000
Not Distressed, Not Reduced (8) 0.8767 0.0104** 0.0081 0.0122* Distressed, Reduced vs. Distressed, Not Reduced (5-6) -0.1227** 0.0239 -0.0076 -0.0114 Not Distressed, Reduced vs. Not Distressed, Not
Reduced (7-8)
-0.0170 -0.0273* 0.4970 -0.5122
Notes: One tail t-test, * 10 percent level, ** 5 percent level, and *** 1 percent level 5.5 Profitability
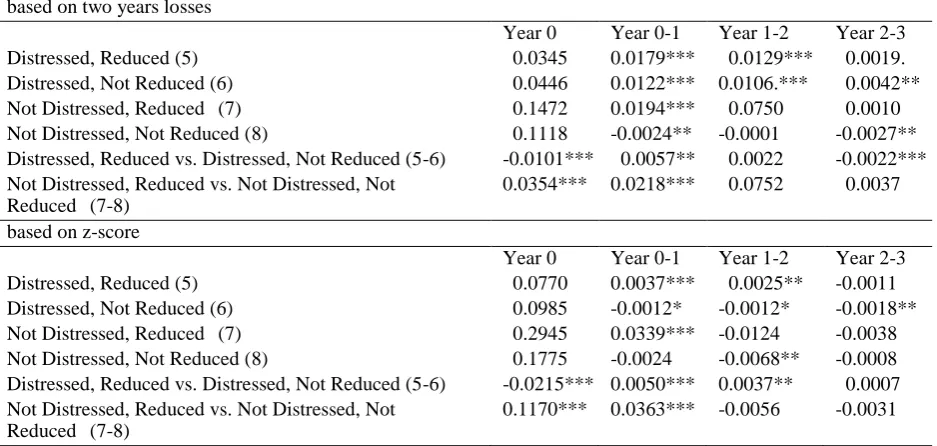
Results of our test of profitability are reported in Table 10. Contrary to our expectations, distressed firms experience an increase in profitability in the two years following a dividend reduction. In the model using two years of losses, distressed firms that did not reduce dividends also experienced a significant positive change in return on assets. Comparing the two groups, distressed firms that reduced dividends had a significantly positive change in ROA compared to distressed firms that did not reduce dividends in the first year and a significantly negative change in the third year. In the Z-score model, distressed dividend-reducing firms had significantly positive changes relative to nonreducing firms in both years one and two.
With respect to non-distressed firms, both models show significant positive changes for dividend reducing firms in the first year only.
Table 10. Comparison of changes in ROA based on two years losses
Year 0 Year 0-1 Year 1-2 Year 2-3
Distressed, Reduced (5) 0.0345 0.0179*** 0.0129*** 0.0019. Distressed, Not Reduced (6) 0.0446 0.0122*** 0.0106.*** 0.0042** Not Distressed, Reduced (7) 0.1472 0.0194*** 0.0750 0.0010 Not Distressed, Not Reduced (8) 0.1118 -0.0024** -0.0001 -0.0027** Distressed, Reduced vs. Distressed, Not Reduced (5-6) -0.0101*** 0.0057** 0.0022 -0.0022*** Not Distressed, Reduced vs. Not Distressed, Not
Reduced (7-8)
0.0354*** 0.0218*** 0.0752 0.0037
based on z-score
Year 0 Year 0-1 Year 1-2 Year 2-3
Distressed, Reduced (5) 0.0770 0.0037*** 0.0025** -0.0011
Distressed, Not Reduced (6) 0.0985 -0.0012* -0.0012* -0.0018**
5.6 Summary of Findings
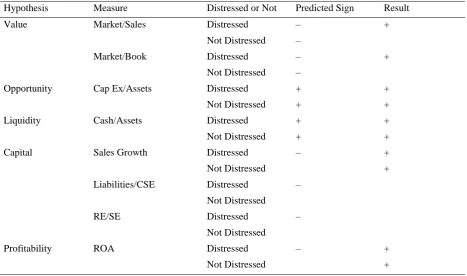
Table 11 contains a summary of our results. Contrary to expectations, effects of dividend reductions for distressed firms as measured by our accounting ratios are positive for all measures. Distressed firms that make dividend reductions gain more value, make greater capital expenditures, have higher liquidity and sales growth, and are more profitable in the years following the dividend reduction than distressed firms that do not reduce dividends. Contrary to expectations, results are similar for non-distressed firms that reduce dividends relative to firms that do not, except with respect to the value of the firm. Non-distressed firms that reduce dividends make greater capital expenditures, have higher liquidity and sales growth, and are more profitable in the years following the dividend reduction than non-distressed firms that do not reduce dividends. However, these firms also lose market value relative to non-distressed firms that do not reduce dividends. While this finding is consistent with the hesitation to reduce dividends, we had hoped to find costs associated with the dividend reduction that would explain both the reluctance to reduce dividends and the decline in market value that follows dividend reduction. We did not do so.
Table 11. Summary of Results of Test of Hypotheses
Hypothesis Measure Distressed or Not Predicted Sign Result
Value Market/Sales Distressed – +
Not Distressed –
Market/Book Distressed – +
Not Distressed –
Opportunity Cap Ex/Assets Distressed + +
Not Distressed + +
Liquidity Cash/Assets Distressed + +
Not Distressed + +
Capital Sales Growth Distressed – +
Not Distressed +
Liabilities/CSE Distressed –
Not Distressed
RE/SE Distressed –
Not Distressed
Profitability ROA Distressed – +
Not Distressed +
6. Conclusion
We are interested in the costs of dividend reductions on distressed and non-distressed firms. We speculated that these costs could explain the reluctance of firms to reduce dividends. We failed to find any costs to the firm of a reduction of dividends beyond the reduction in firm value for non-distressed firms. That reduction in firm value is already well documented in the literature.
Our research design compared the costs to firms that reduced dividends relative to firms that did not reduce dividends expecting to find a cost to the dividend reduction. This is a fundamental weakness in our research design. It may be that firms that would experience a cost to the dividend reduction did not reduce dividends. Future research might focus on firms with declining earnings and investigate the differences between those that reduce dividends and those that do not.
References
Aharony, J. & Swary, I. (1980). Quarterly Dividend and Earning Announcements and Stockholders’ Returns: An Empirical Analysis. The Journal of Finance, 35, 1-12. https://doi.org/10.1111/j.1540-6261.1980.tb03466.x Altman, E. (1968). Financial Ratios, Discriminant Analysis, and the Prediction of Corporate Bankruptcy, The
Altman, E. I., Danovi, A., & Falini, A. (2013). Z-Score Models’ Application to Italian Companies Subject to Extraordinary Administration. Journal of Applied Finance, 23, 1-10. https://ssrn.com/abstract=2686750
Baker, K. & Smith, D. (2006). In Search of a Residual Dividend Policy. Review of Financial Economics, 15, 1-18. https://doi.org/10.1016/j.rfe.2004.10.002
Bhagat, S., Moyen, N., & Suh, I. (2005). Investment and Internal Funds of Distressed Firms. Journal of Corporate Finance, 11, 449-472. https://doi.org/10.1016/j.jcorpfin.2004.09.002
Brook, Y., Charton, W. & Hendershott, R. (1998). Do Firms Use Dividends to Signal Large Future Cash Flow Increases? Financial Management, 27, 46-57. . https://doi.org/10.2307/3666274
Cohen, G. & Yagil, J. (2009). Why Do Financially Distressed Firms Pay Dividends? Applied Economic Letters, 16, 1201-1204. https://doi.org/10.1080/17446540802389057
Grullon, G., Michaely, R. & Swaminathan, B. (2002). Are Dividend Changes a Sign of Firm Maturity? Journal of Business, 75, 387-424. https://doi.org/10.1086/339889
Healy, P. & Palepu, K. (1988). Earnings Information Conveyed by Dividend Initiations and Omissions. Journal of Financial Economics, 21, 149-175. https://doi.org/10.1016/0304-405X(88)90059-1
Lee, B. S. & Yau, N. A. (2003). The Market’s Differential Reactions to Forward-Looking and Backward-Looking Dividend Changes. The Journal of Financial Research, 26, 449-468. https://doi.org/10.1111/1475-6803.00068 Michaely, R., Thaler, R., & Womack, K. (1995). Price Reactions to Dividend Initiations and Omissions:
Overreaction or Drift? The Journal of Finance, 50, 573-608.