RESEARCH
Validation of a novel model for the early
detection of hepatocellular carcinoma
Philip M. Hemken
1†, Lori J. Sokoll
2†, Xiaoqing Yang
1,6, Jianliang Dai
3, Debra Elliott
2, Susan H. Gawel
1,
Michael Lucht
1, Ziding Feng
3, Jorge A. Marrero
4, Sudhir Srivastava
5, Daniel W. Chan
2and Gerard J. Davis
1*Abstract
Background: The biomarkers alpha-fetoprotein (AFP) and protein induced by vitamin K absence/antagonist-II (PIVKA-II) may be useful for detecting early-stage hepatocellular carcinoma (HCC). We evaluated the performance of AFP and PIVKA-II levels, alone and in combination with clinical factors, for the early detection of HCC.
Methods: In a case–control study, serum AFP and PIVKA-II were measured using the ARCHITECT immunoassay ana-lyzer system in a cohort of 119 patients with HCC, 215 patients with non-malignant liver disease, and 34 healthy sub-jects. Five predictive models for detecting HCC were developed based on age, gender, AFP, and/or PIVKA-II levels; the best model was validated in an independent cohort of 416 patients with HCC and 412 control subjects with cirrhosis. Results: In both cohorts, AFP and PIVKA-II concentrations were higher in patients with HCC compared to healthy controls and patients with non-malignant liver disease. The model that combined AFP and PIVKA-II, age, and gender had the highest AUC of 0.95 (0.95, 95% CI 0.93–0.98), with a sensitivity of 93% and a specificity of 84% in the develop-ment cohort, and an AUC of 0.87 (95% CI 0.85–0.90), sensitivity of 74%, and specificity of 85% in the validation cohort. When limiting the validation cohort to only early-stage HCC, the AUC was 0.85 (95% CI 0.81–0.88), sensitivity was 70%, and specificity was 86%.
Conclusions: Compared to each biomarker alone, the combination of AFP and PIVKA-II with age and gender improved the accuracy of detecting HCC and differentiating HCC from non-malignant liver disease.
Keywords: Biomarker, Early diagnosis, Liver, Cancer, Des-gamma carboxyprothrombin
© The Author(s) 2019. This article is distributed under the terms of the Creative Commons Attribution 4.0 International License (http://creat iveco mmons .org/licen ses/by/4.0/), which permits unrestricted use, distribution, and reproduction in any medium, provided you give appropriate credit to the original author(s) and the source, provide a link to the Creative Commons license, and indicate if changes were made. The Creative Commons Public Domain Dedication waiver (http://creat iveco mmons .org/ publi cdoma in/zero/1.0/) applies to the data made available in this article, unless otherwise stated.
Background
Worldwide, liver cancer is the fifth most common can-cer in men and ninth most common in women, and the majority of primary liver cancers are hepatocellular car-cinoma (HCC) [1]. The incidence of HCC has tripled between 1975 and 2011 in the US, with nearly 40,000 new cases diagnosed in 2016, primarily due to a rise in hepa-titis C virus (HCV)-induced cirrhosis [1, 2]. Liver cancer is also one of the most fatal cancers, with a 5-year sur-vival rate of 17% in the US [2] and less than 20% globally [1]. The poor prognosis of HCC is in large part related
to late-stage diagnosis, as symptoms do not appear until advanced stages when there are fewer effective treatment options.
The 5-year survival rate is approximately 3% in patients with metastatic HCC [3], compared to 31% in patients with localized disease [2]. Thus, a number of clinical practice guidelines [4–8] recommend screening of high-risk patients, such as those with cirrhosis, to detect early-stage tumors and initiate treatment to improve outcomes [9]. Surveillance primarily involves imaging, most com-monly by ultrasound with or without alpha-fetoprotein (AFP) every 6 months, as recommended by the recent guidelines from the American Association for the Study of Liver Diseases (AASLD) [2, 4]. However, early diagno-sis of HCC by ultrasound alone is complicated by under-lying cirrhosis and may increase the potential harms of surveillance, with low sensitivity and a high false negative
Open Access
*Correspondence: [email protected] †Philip M. Hemken and Lori J. Sokoll are joint first authors
1 Diagnostics Discovery Research and Development, Abbott Diagnostics, Abbott Laboratories, 100 Abbott Park Road, D09GP, AP20/1, Abbott Park, IL 60064, USA
rate (60%) [10]. Further, ultrasound is operator-depend-ent and has relatively poor reproducibility.
Circulating biomarkers may provide additional diag-nostic information to complement ultrasound findings and may be particularly helpful in detecting biochemi-cal changes associated with malignancy in the liver prior to the formation of hepatic nodules [11]. AFP is a widely used, yet imperfect biomarker for detection of liver can-cer [12]. AASLD guidelines suggest that adding AFP to ultrasound may improve detection of HCC in at-risk patients with cirrhosis [4].
The biomarkers protein induced by vitamin K absence/ antagonist-II (PIVKA-II), also known as des-gamma car-boxyprothrombin (DCP), and AFP-L3, a glycosylated form of AFP that is more specific to liver cancer, have been investigated as additional HCC biomarkers. Abnor-mal carboxylation of the anticoagulation factor pro-thrombin by vitamin K-dependent carboxylase occurs in malignant hepatocytes, leading to increased levels of cir-culating PIVKA-II in patients with HCC [11, 13]. Several studies have shown that PIVKA-II has a higher sensitivity and specificity than AFP for detecting HCC versus non-malignant liver diseases [14–16]. However, a large, mul-ticenter National Cancer Institute (NCI) Early Detection Research Network (EDRN) study in 836 patients reported similar areas under the receiver operating characteristic curve (ROC AUC) of 0.83 (95% CI 0.80–0.85) for AFP and 0.81 (95% CI 0.78–0.84) for PIVKA-II for differen-tiating between HCC and cirrhosis [17]. The same study demonstrated that the combination of AFP and PIVKA-II increased the AUC, particularly for the detection of early-stage disease [17]. PIVKA-II has been used clini-cally as a biomarker for risk stratification of HCC, and is now included in biomarker panels for HCC surveillance in Japanese guidelines [6, 7].
In a preliminary study of AFP and novel biomarkers for HCC using AFP and PIVKA-II assays on the Abbott ARCHITECT i2000 system, we showed that PIVKA-II had the highest diagnostic accuracy for HCC [18]. In the current study, we further evaluated the performance of the ARCHITECT AFP and PIVKA-II assays, alone and in combination with clinical factors, for the detection of HCC in populations of patients with HCC in the US, including those with early-stage HCC and non-malignant liver disease. We further validated our findings in the NCI EDRN cohort [17].
Methods
Study design and serum samples
This was a retrospective case–control study measuring the biomarkers AFP and PIVKA-II in serum samples collected between 2003 and 2016 at the Johns Hopkins Medical Institutions (JHMI) in Baltimore, MD, from
patients with HCC or chronic liver disease (cirrhosis and pre-cirrhotic stages) with viral or non-viral etiology, and healthy controls. Serum samples from patients with HCC were collected prior to treatment. The study was approved by the Johns Hopkins Medicine IRB. Additional serum samples obtained after consent from patients with liver cirrhosis at the University of Texas Southwestern Medical Center (UTSMC) in Dallas, TX, were analyzed at JHMI. For each serum sample, the following de-identi-fied data was collected: age, gender, race/ethnicity, etiol-ogy of liver disease, and HCC stage based on the TNM staging system [19], if applicable. These samples were used to develop and train the HCC detection models (development cohort).
Additional samples from the NCI EDRN cohort (vali-dation cohort) were used to validate the best model derived from the development cohort. Validation cohort samples were obtained from EDRN [17] through an agreement with NCI. The EDRN study included 836 sub-jects; of these, 828 were included in this analysis (416 HCC with cirrhosis and 412 controls with cirrhosis only) and the study was powered for detecting at least a 15% sensitivity difference for a new biomarker compared with the performance of AFP alone. For each serum sample, the following de-identified data was collected: age, gen-der, race/ethnicity, etiology of liver disease, and HCC stage based on the Barcelona Clinic Liver Cancer (BCLC) staging system [20]. A direct comparison of the cohorts based on the TNM and BCLC systems was not possible because BCLC includes clinical criteria other than size [21].
Sample storage and assays
Serum samples were stored at approximately − 80 °C prior to analysis. US-approved AFP and ex-US‒approved PIVKA-II were measured using the ARCHITECT i2000 immunoassay analyzer (Abbott Laboratories, North Chi-cago, IL) per the manufacturer’s instructions [22, 23]. Each two-step sandwich immunoassay utilizes paramag-netic microparticles coated with either anti-AFP [24] or anti-PIVKA-II [25] antibodies and a chemilumines-cent signal for the quantitative measurement of AFP or PIVKA-II in human serum and plasma. The performance characteristics for the ARCHITECT AFP and PIVKA-II assays are described in Table 1.
Statistical analysis
de-correlated trees, and then averages them. With the RF method, the bias of the full model is equivalent to the bias of a single decision tree, but the variance is much lower due to the nature of averaging a large collection of trees [26].
All of the JHMI/UTSMC sample results, comprising the development cohort, were used to train the models. The response variable for the models was the binary HCC status (any stage HCC vs. non-HCC). Multiple RF mod-els were developed by selecting different combinations of age, gender, and the two biomarkers as the classifiers. The best model was selected based on the combination of classifiers with the highest ROC AUC. The sensitivi-ties (SEs) and specificisensitivi-ties (SPs) were reported at cut-off points where the sum of the sensitivity (SE) and the specificity (SP) were maximized. The confidence intervals of AUCs and SEs/SPs were calculated based on the two-sided non-parametric method developed by Delong et al. [27].
The best, final model selected from the development cohort was assessed further. To evaluate the generaliz-ability of the best model in a different population, an independent, blinded data set from the NCI EDRN study was used to validate model performance. The valida-tion cohort serum samples had been previously run on a PIVKA-II sandwich immunoassay (Eisai Co, Tokyo, Japan) and an AFP immunoassay on a Wako automated system (Mountain View, CA) [17]. To address bias with the Wako and Abbott immunoassay platforms, both AFP and PIVKA-II values for the validation cohort were transformed to the ARCHITECT concentration scale as follows. One hundred EDRN matched samples (50 cases and 50 controls) were randomly selected and measured using the ARCHITECT system. The linear regression coefficients (intercept a and slope b) between the AFP and PIVKA-II values in natural log scale from the EDRN study [17] and the corresponding values measured with
the ARCHITECT system were obtained for the 100 sam-ples. The transformed values were determined by apply-ing the regression coefficients to the AFP/PIVKA-II values in natural log scale of all validation cohort samples followed by exponential transformation. The transformed AFP/PIVKA-II values were then used for subsequent analyses.
All statistical analyses were performed using R 3.1.2 (The R Foundation for Statistical Computing).
Results
Patient demographics
The development cohort consisted of serum samples from 70 patients with stage 1 or 2 HCC, 49 patients with stage 3 or 4 HCC, and samples from 215 patients with non-malignant liver disease (40 of whom had cirrho-sis) and 34 healthy subjects (Table 2). The mean age for patients in the HCC, non-malignant liver disease, and healthy control groups were 61.5, 49.5, and 58.9 years, respectively, with the majority of patients being Cauca-sian or African American.
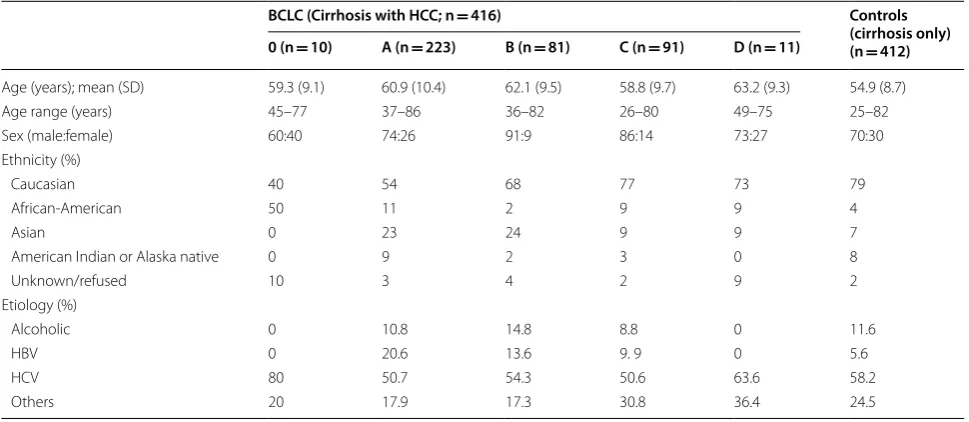
Demographics of the validation cohort (n = 828) are shown in Table 3. The cohort included 416 patients with HCC, the majority of whom had BCLC stage A disease, and 412 subjects with cirrhosis. Patient age varied from 26 to 82 years, with a greater proportion of men in each group. The majority of patients were Caucasian or Afri-can AmeriAfri-can, and the majority had chronic hepatitis C (HCV) infection. The development and validation cohorts had similar demographics in terms of average age, ratio of men to women, and race/ethnicity distribu-tion, and the majority of cases in both cohorts had a viral etiology.
Biomarker concentrations
In the development cohort, AFP and PIVKA-II concen-trations were found to be higher in patients with HCC Table 1 ARCHITECT assay performance characteristics [22, 23]
CV coefficient of variation, HAMA human anti-mouse antibodies, LoD limit of detection, LoQ limit of quantitation, RF rheumatoid factor
Parameter AFP assay PIVKA-II assay
20-Day precision Total within-laboratory %CV of ≤ 7.5% Total within-laboratory %CV ≤ 8.6%
LOQ 2.0 ng/mL 5.06 mAU/mL
LoD ≤1.0 ng/mL 1.45 mAU/mL
Dilution Linearity Within ± 1 ng/mL for samples < 10 ng/mL, ± 10 ng/mL for
sam-ples 10–2000 ng/mL Within ± 10% for samples 20–30,000 mAU/mL
Range 2–2000 ng/mL 5.06–30,000 mAU/mL
Extended range with autodilution 1:10 autodilution to 20,000 ng/mL 1:10 autodilution to 300,000 mAU/mL HAMA/RF and Interferences Within ± 10% for HAMA/RF and potential interferents, no notable
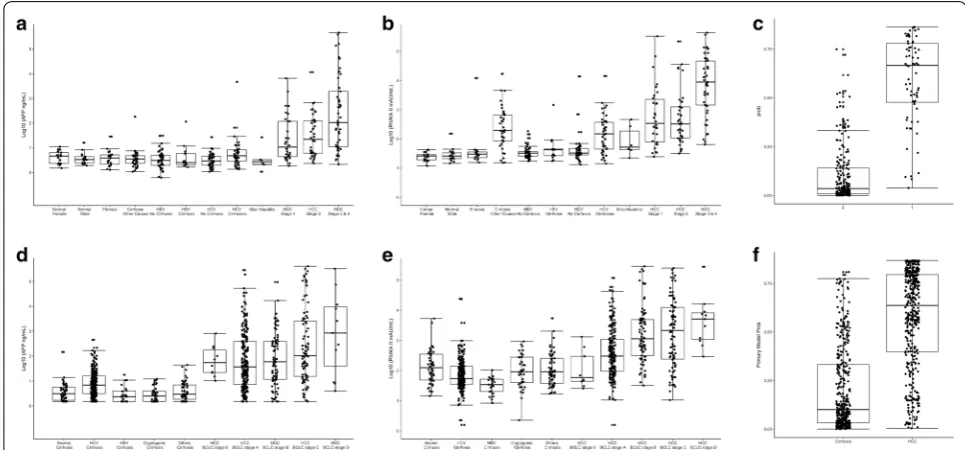
than in healthy controls (p < 0.0010) and patients with chronic liver disease (p < 0.0010), with levels increasing with HCC stage (Fig. 1a, b; Additional file 1: Table S1). AFP and PIVKA-II generally demonstrated higher lev-els in the HCC groups than in the non-HCC and control groups, and showed increasing levels with increasing
stages of HCC, as shown in a probability plot (Fig. 1c). In the validation cohort, AFP and PIVKA-II levels yielded similar patterns as seen in the development cohort (Fig. 1d, e), and the probability of the biomarker associ-ated with the presence and staging of HCC is shown in Fig. 1f.
Table 2 JHMI/UTSMC development cohort demographics (N = 368)
a Chronic hepatitis (n = 102); fibrosis, pre-cirrhotic (n = 19); cirrhosis (n = 40); hepatitis with cirrhosis (n = 54)
HCC (n = 119)a Non-malignant liver
diseasea (n = 215) Healthy controls (n = 34) Stage 1
(n = 30) Stage 2(n = 40) Stage 3 and 4(n = 49)
Age (years); median (IQR) 61.5
(56.2–67.0) 61(58.0–64.5) 60(57.0–65.5) 54(42.0–60.0) 60.5(51.2–64.8)
Age range (years) 45–88 18–85 45–80 8–75 40–77
Sex (male:female) [%] 77:23 75:25 85:15 60:40 50:50 Ethnicity (%)
Caucasian 53 55 52 47 68
African American 37 33 40 38 6
Hispanic/Latino 3 5 2 2 0
Asian 7 0 6 10 0
Native American/Pacific Islander 0 3 0 0 0
Other 0 0 0 1 0
Unknown 0 5 0 1 26
Etiology (%)
Non-viral 27 28 29 – –
HBV 7 0 6
HCV 53 65 52
HBV and HCV 0 5 4
Unknown 13 2 8 – –
Table 3 NCI EDRN validation cohort demographics (N = 828)
BCLC (Cirrhosis with HCC; n = 416) Controls
(cirrhosis only) (n = 412) 0 (n = 10) A (n = 223) B (n = 81) C (n = 91) D (n = 11)
Age (years); mean (SD) 59.3 (9.1) 60.9 (10.4) 62.1 (9.5) 58.8 (9.7) 63.2 (9.3) 54.9 (8.7) Age range (years) 45–77 37–86 36–82 26–80 49–75 25–82 Sex (male:female) 60:40 74:26 91:9 86:14 73:27 70:30 Ethnicity (%)
Caucasian 40 54 68 77 73 79
African-American 50 11 2 9 9 4
Asian 0 23 24 9 9 7
American Indian or Alaska native 0 9 2 3 0 8
Unknown/refused 10 3 4 2 9 2
Etiology (%)
Alcoholic 0 10.8 14.8 8.8 0 11.6
HBV 0 20.6 13.6 9. 9 0 5.6
HCV 80 50.7 54.3 50.6 63.6 58.2
The AFP and PIVKA-II concentrations in the validation cohort significantly correlated with the concentrations in the development cohort based on 50 control/50 HCC samples (AFP Spearman correlation coefficient ρ = 0.933, p < 0.0001; PIVKA-II Spearman correlation coefficient ρ = 0.826, p < 0.0001). However, Passing-Bablok regres-sion and Deming regresregres-sion showed systematic differ-ences between two cohorts (data not shown). Therefore, a linear transformation method was employed to remove the systematic bias between the two cohorts.
Model performance in the development cohort
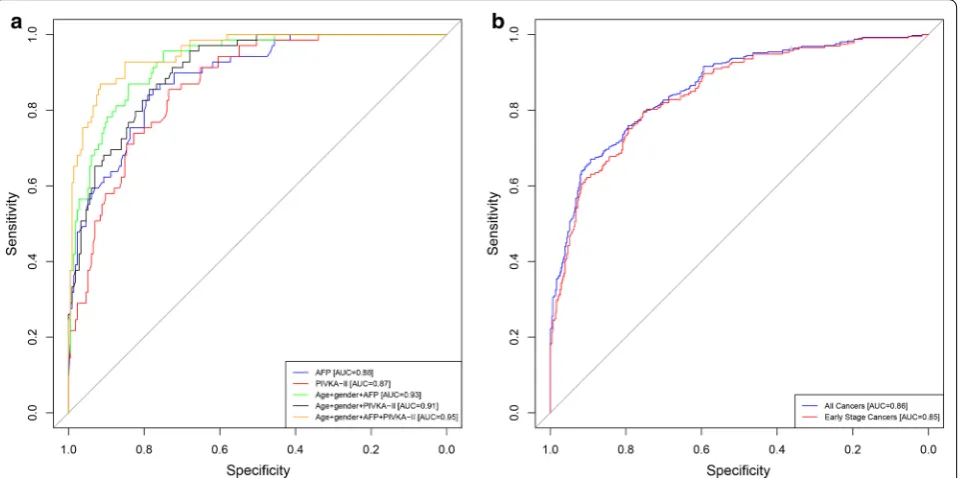
Five models were developed based on the development cohort data using age, gender, AFP, and/or PIVKA-II, and the performance of these five models were compared to each other (described in Methods). The AUC for dif-ferentiating HCC from non-malignant liver disease was similar for AFP alone (Model 1: 0.88, 95% CI 0.84–0.93) and PIVKA-II alone (Model 2: 0.87, 95% CI 0.82–0.90) (Fig. 2a). The addition of age and gender to either AFP or PIVKA-II increased the AUCs (Model 3: 0.93, 95% CI 0.90–0.96 and Model 4: 0.91, 95% CI 0.87–0.94, respec-tively), but the increases were not statistically signifi-cant. The best model included a combination of both biomarkers, age, and gender, which increased the AUC to 0.95 (Model 5: 95% CI 0.93–0.98), with a sensitivity of 93% and a specificity of 84%. The increase was statisti-cally significant compared to AFP or PIVKA-II alone and
either biomarker combined with age and gender (p values between 0.0000 and 0.0042). The combination of either biomarker with age and gender increased sensitivity, with only a small decrease in specificity (Table 4). When speci-ficity was held to 90%, sensitivity reached 84%.
Model validation in the EDRN cohort
The best model from the development cohort (model 5) was evaluated using the validation cohort data as an inde-pendent assessment of clinical performance (Table 4). Model 5, which combines both biomarkers, age, and gen-der, had an estimated AUC of 0.87 (95% CI 0.85–0.90) in the validation cohort. Model 5 had an estimated sensitiv-ity of 74% and a specificsensitiv-ity of 85%; when specificsensitiv-ity was held to 90%, sensitivity was estimated to be 67%. When limiting the validation cohort to only early-stage HCC (BCLC stage 0 and A), the estimated AUC was 0.85 (95% CI 0.81–0.88), sensitivity was 70%, and specificity was 86% for model 5. Model 5 was further assessed in the validation cohort stratified by non-viral and viral etiolo-gies for all cancers and early-stage cancers. AUCs were comparable for viral and non-viral cancers, though the model had a slightly lower sensitivity and higher specific-ity for detecting all cancers and early-stage cancers with non-viral etiology compared to those with viral etiology.
Fig. 1 Concentrations of biomarkers for each study subject in the development cohort (JHMI/UTSMC) and validation cohort (NCI EDRN). a AFP
Discussion
We report here that the biomarkers AFP and PIVKA-II, when combined with age and gender, showed superior sensitivity and specificity for HCC detection compared to AFP and PIVKA-II alone or individually combined with age and gender. Further, analysis of the model in an independent validation cohort showed similar clinical performance, although with lower AUC, sensitivities,
and specificities. This is important because the devel-opment cohort control group had a small number of patients with cirrhosis, while the validation cohort con-trol group was comprised only of patients with cirrho-sis. This study demonstrated the robustness of the HCC detection model with an external cohort dataset from a population of diverse composition.
Fig. 2 ROC analysis. a ROC for the development cohort (JHMI/UTSMC) for AFP (blue), PIVKA-II (red), age + gender + AFP (green),
age + gender + PIVKA-II (black), age + gender + AFP + PIVKA-II (brown); b ROC for the validation cohort (EDRN) for age + gender + AFP + PIVKA-II for all cancers (blue) and for early-stage cancers (BCLC stage 0 and A; red)
Table 4 Diagnostic performance of biomarkers alone and in combination with clinical factors in the development cohort (JHMI/UTSMC) and in the model 5 in the validation cohort (NCI EDRN)
a All cancers
b Early-stage cancers (BCLC stage 0 and A)
Model Predictor variables AUC AUC 95% CI SE SP SE (SP = 0.90) SP (SE = 0.90) SP (SE = 0.75)
Development cohort
1 AFP 0.88 0.84–0.93 0.86 0.77 0.64 0.64 0.81
2 PIVKA-II 0.87 0.82–0.90 0.86 0.72 0.51 0.65 0.77 3 Age, gender, AFP 0.93 0.90–0.96 0.94 0.76 0.78 0.78 0.91 4 Age, gender, PIVKA-II 0.91 0.87–0.94 0.93 0.72 0.67 0.72 0.86 5 Age, gender, AFP, PIVKA-II 0.95 0.93–0.98 0.93 0.84 0.84 0.83 0.97 Validation cohort
5a Age, gender, AFP, PIVKA-II All 0.87 0.85–0.90 0.74 0.85 0.67 0.54 0.84
Viral etiology 0.86 0.83–0.89 0.79 0.80 0.62 0.61 0.82 Non-viral etiology 0.87 0.83–0.91 0.75 0.91 0.75 0.58 0.91 5b Age, gender, AFP, PIVKA-II All 0.85 0.81–0.88 0.70 0.86 0.63 0.51 0.79
Our findings are consistent with previous studies of the diagnostic accuracy of HCC biomarker panels in Asian and Western populations. In a prospective study of 734 high-risk Japanese patients with chronic hepatitis or liver cirrhosis, Ishii et al. [28] found that the combination of AFP and PIVKA-II had 65% sensitivity and 85% specific-ity for detecting early-stage HCC. A nested case–con-trol study in China that included 45 patients with HCC and 138 matched controls found a similar increase in the diagnostic accuracy of the combination of AFP and PIVKA-II over either biomarker alone in patients with HCC [29]. In the US, the HALT-C trial reported that the sensitivity and specificity of PIVKA-II (74% and 46%) for the detection of early HCC were higher than those of AFP (61% and 81%), but the combination had a higher sensitivity than either biomarker alone (91%), with a 74% specificity [30]. The original EDRN case–control study of 419 US patients with HCC (208 early-stage) and 417 controls with cirrhosis found that AFP had a higher ROC AUC (0.80, 95% CI 0.77–0.84) than PIVKA-II (0.72, 95% CI 0.68–0.77), with the AUC of the combined biomarkers slightly higher than either biomarker alone (0.83, 95% CI 0.80–0.87) [17]. Our model 5 analyses in the validation cohort performed slightly better than the analyses in the original EDRN study (AUC = 0.87, 95% CI 0.85–0.90). No
other biomarkers have shown better results.
One rationale for combining multiple biomarkers is that each may detect different aspects of early HCC tumor biology and provide additive information. One prospec-tive study by Izuno et al. [31] reported that AFP was bet-ter able to detect small local tumors while PIVKA-II was more sensitive for detecting more diffuse tumors, with the combination of biomarkers having a higher diagnos-tic accuracy. Other studies have examined the addition of AFP-L3% as a third biomarker to improve accuracy; AFP-L3 is a glycosylated form of AFP that is specifically produced by HCC cells and has been shown to be better than AFP at differentiating between patients with HCC or cirrhosis [32]. In a study of 685 patients with HCC, 77% of patients had at least one elevated biomarker, the levels of AFP, PIVKA-II, and AFP-L3% correlated with the extent of disease as well as patient outcomes, and all three bio-markers decreased with treatment [33].
In this study, we found that PIVKA-II had lower speci-ficity and similar sensitivity as AFP in the development cohort. Yu et al. also reported a consistently lower sensitivity of PIVKA-II compared with AFP, with similar specificities [29]; however, this is not seen consistently in the literature. Volk et al. reported that PIVKA-II is superior to either AFP or AFP-L3% at differentiating between HCC and cirrhosis (sensitivity 86%, specificity 93%), but that the AUC is lower for patients with high-risk HCC vs. low-risk HCC [34].
Differences between our findings and those of others may be related to the use of the RF model for statistical analysis, which does not specify a cut-off point, as well as differences in the patient population. When using AFP as a biomarker, a modified threshold that consid-ers various factors, such as disease etiology/spectrum, underlying viral infection, age, and race/ethnicity for dif-ferent populations may improve diagnostic accuracy [17, 35, 36]. For example, HCV is the causative agent largely responsible for the increase in incidence of HCC in the US; while HBV is the leading cause of HCC worldwide, particularly in Asia and Africa. Thus, taking viral infec-tion into account when setting AFP biomarker thresholds may improve assessment of HCC risk in the US versus other countries.
A limitation of this study was that, given the retro-spective nature of the analysis, the control groups in the development and validation cohorts were somewhat different in terms of composition and different staging systems were used, which limits assessment of specific confounders (Tables 2 and 3). A strength of this study was the demonstration of the robustness of the HCC model 5 with data from the external EDRN cohort. The large size of the validation cohort made it possible to examine the diagnostic performance of the model in subgroups of early-stage versus all cancers and viral versus non-viral etiology. The next step in the validation process is a phase 3 biomarker study using a prospective-specimen-collec-tion, retrospective-blinded-evaluation (PRoBE) design [37], and such a study is currently underway.
Conclusions
The use of a biomarker panel of AFP and PIVKA-II in combination with age and gender improved accuracy of detecting HCC and differentiating HCC from non-malig-nant liver disease in a US study population as compared to the individual biomarkers alone. Additional analyses are needed to assess the diagnostic accuracy of the AFP and PIVKA-II panel for early-stage vs later-stage HCC. Further validation in a phase 3 biomarker study is needed to support the use of multiple biomarker panels to aid in the early detection of HCC.
Additional file
Additional file 1: Table S1. Median and Interquartile Range of AFP (ng/ mL) and PIVKA-II (mAU/mL) Assay Results for Subjects in the Development (JHMI) and Validation (EDRN)* Cohorts, by Disease Category.
Abbreviations
alpha-fetoprotein; NCCN: National Comprehensive Cancer Network; NACB: National Academy of Clinical Biochemistry; PIVKA-II: protein induced by vitamin K absence/antagonist-II; DCP: des-gamma carboxyprothrombin; NCI: National Cancer Institute; EDRN: Early Detection Research Network; ROC: receiver operating curve; AUC : area under the curve; JHMI: Johns Hopkins Medical Institutions; UTSMC: University of Texas Southwestern Medical Center; BCLC: Barcelona Clinic Liver Cancer; RF: random forest; SE: sensitivity; SP: specificity.
Authors’ contributions
PMH, LJS, and GJD conceived and designed the study, collected and analyzed data, and helped write the manuscript; XY, JD, and ML analyzed the data and helped write the manuscript; DE collected and analyzed data and revised the manuscript; SHG and JAM collected and analyzed data and helped write the manuscript; and ZF, SS, and DWC designed the study and helped write the manuscript. All authors read and approved the final manuscript.
Author details
1 Diagnostics Discovery Research and Development, Abbott Diagnostics, Abbott Laboratories, 100 Abbott Park Road, D09GP, AP20/1, Abbott Park, IL 60064, USA. 2 Division of Clinical Chemistry, Department of Pathology, The Johns Hopkins University, Baltimore, MD, USA. 3 Division of Quantitative Sciences, Department of Biostatistics, The University of Texas, MD Anderson Cancer Center, Houston, TX, USA. 4 Division of Digestive and Liver Diseases, University of Texas Southwestern, 5959 Harry Hines Blvd POB I Suite 420B, Dal-las, TX, USA. 5 Cancer Biomarkers Research Group, Division of Cancer Preven-tion, National Cancer Institute, Bethesda, MD, USA. 6 Present Address: Novartis Institutes for BioMedical Research, Inc., Cambridge, MA, USA.
Acknowledgements
The authors acknowledge the contributions of NCI EDRN investigators who participated in the collection of specimens, including Yinghui Wang, Mindie Nguyen, Alex Befeler, Lewis Roberts, K. Rajender Reddy, Denise Harnois, Josep Llovet, Daniel Normolle, Jackie Dalhgren, David Chia, Anna Lok, Paul Wagner, and Myron Schwartz. Stacey Tobin, PhD, received compensation for her assis-tance in preparing this manuscript.
Preliminary data reported in this manuscript were previously presented at the 43th ISOBM Annual Congress in Chicago, Illinois, September 2, 2016.
Competing interests
Philip M. Hemken is an employee of, owns stock in, and holds intellectual property interests with Abbott Laboratories; Lori J. Sokoll receives research funding support from Abbott Laboratories; At time of contributions to study, Xiaoqing Yang was an employee of, received research funding support from, and held intellectual property interests with Abbott Laboratories; Jianliang Dai has nothing to disclose; Debra Elliott has nothing to disclose; Susan H. Gawel is an employee of, owns stock in, receives research funding support from, and holds intellectual property interests with Abbott Laboratories; Michael Lucht is an employee of Abbott GmbH & Co. KG and owns stock in Abbott Laboratories; Ziding Feng has nothing to disclose; Jorge A. Marrero has noth-ing to disclose; Sudhir Srivastava has nothnoth-ing to disclose; Daniel W. Chan has received research funding support from Abbott Laboratories; Gerard J. Davis is an employee of, owns stock in, and receives research funding support from Abbott Laboratories.
Availability of data and materials
The dataset from JHMI used to develop the model is available from the cor-responding author upon request. The dataset from EDRN used to validate the model is not publicly available as it is a consortium reference set from an ongoing trial and blinding must be maintained.
Consent for publication Not applicable.
Ethics approval and consent to participate
The study was approved by the Johns Hopkins Medicine IRB.
Funding
The study was supported by Abbott Laboratories and the National Cancer Institute (NCI) Early Detection Research Network (EDRN) (NIH U24 CA115102).
Publisher’s Note
Springer Nature remains neutral with regard to jurisdictional claims in pub-lished maps and institutional affiliations.
Received: 20 July 2018 Accepted: 27 December 2018
References
1. American Cancer Society: Global cancer facts & figures, 3rd ed. Atlanta, GA: American Cancer Society. 2015; http://www.cance r.org/acs/group s/ conte nt/@resea rch/docum ents/docum ent/acspc -04473 8.pdf. Accessed 11 Oct 2016.
2. American Cancer Society: Cancer facts & figures 2016. Atlanta, GA: Ameri-can Cancer Society. http://www.cance r.org/acs/group s/conte nt/@resea rch/docum ents/docum ent/acspc -04707 9.pdf. Accessed 11 Oct 2016. 3. American Cancer Society: Liver cancer survival rates. https ://www.cance
r.org/cance r/liver -cance r/detec tion-diagn osis-stagi ng/survi val-rates .html. Accessed September 14, 2017.
4. Heimbach JK, Kulik LM, Finn RS, Sirlin CB, Abecassis MM, Roberts LR, et al. AASLD guidelines for the treatment of hepatocellular carcinoma. Hepa-tology. 2018;67:358–80.
5. European Organisation For Research and Treatment Of Cancer. EASL-EORTC clinical practice guidelines: management of hepatocellular carcinoma. J Hepatol. 2012;56:908–43.
6. Kokudo N, Hasegawa K, Akahane M, Igaki H, Izumi N, Ichida T, et al. Evidence-based clinical practice guidelines for hepatocellular carcinoma: The Japan Society of Hepatology 2013 update (3rd JSH-HCC Guidelines). Hepatol Res. 2015;45:123–7.
7. Makuuchi M, Kokudo N, Arii S, Futagawa S, Kaneko S, Kawasaki S, et al. Development of evidence-based clinical guidelines for the diagnosis and treatment of hepatocellular carcinoma in Japan. Hepatol Res. 2008;38:37–51.
8. National Comprehensive Cancer Network: NCCN clinical practice guide-lines in oncology: hepatobiliary cancers. 2016; https ://www.nccn.org/ profe ssion als/physi cian_gls/pdf/hepat obili ary.pdf. Accessed 11 Oct 2016. 9. Singal AG, Pillai A, Tiro J. Early detection, curative treatment, and survival
rates for hepatocellular carcinoma surveillance in patients with cirrhosis: a meta-analysis. PLoS Med. 2014;11:e1001624.
10. Atiq O, Tiro J, Yopp AC, Muffler A, Marrero JA, Parikh ND, et al. An assess-ment of benefits and harms of hepatocellular carcinoma surveillance in patients with cirrhosis. Hepatology. 2017;65:1196–205.
11. Tsuchiya N, Sawada Y, Endo I, Saito K, Uemura Y, Nakatsura T. Biomarkers for the early diagnosis of hepatocellular carcinoma. World J Gastroenterol. 2015;21:10573–83.
12. Li D, Satomura S. Biomarkers for hepatocellular carcinoma (HCC): an update. Adv Exp Med Biol. 2015;867:179–93.
13. Liebman HA, Furie BC, Tong MJ, Blanchard RA, Lo KJ, Lee SD, et al. Des-gamma-carboxy (abnormal) prothrombin as a serum marker of primary hepatocellular carcinoma. N Engl J Med. 1984;310:1427–31.
14. Marrero JA, Su GL, Wei W, Emick D, Conjeevaram HS, Fontana RJ, et al. Des-gamma carboxyprothrombin can differentiate hepatocellular carcinoma from nonmalignant chronic liver disease in american patients. Hepatology. 2003;37:1114–21.
15. Li C, Zhang Z, Zhang P, Liu J. Diagnostic accuracy of des-gamma-carboxy prothrombin versus alpha-fetoprotein for hepatocellular carcinoma: a systematic review. Hepatol Res. 2014;44:E11–25.
16. Pote N, Cauchy F, Albuquerque M, Voitot H, Belghiti J, Castera L, et al. Performance of PIVKA-II for early hepatocellular carcinoma diagnosis and prediction of microvascular invasion. J Hepatol. 2015;62:848–54. 17. Marrero JA, Feng Z, Wang Y, Nguyen MH, Befeler AS, Roberts LR, et al.
Alpha-fetoprotein, des-gamma carboxyprothrombin, and lectin-bound alpha-fetoprotein in early hepatocellular carcinoma. Gastroenterology. 2009;137:110–8.
•fast, convenient online submission
•
thorough peer review by experienced researchers in your field
• rapid publication on acceptance
• support for research data, including large and complex data types
•
gold Open Access which fosters wider collaboration and increased citations maximum visibility for your research: over 100M website views per year
•
At BMC, research is always in progress.
Learn more biomedcentral.com/submissions
Ready to submit your research? Choose BMC and benefit from: hepatitis, cirrhosis, and hepatocellular carcinoma. Clin Chem Lab Med.
2011;49:711–8.
19. American Joint Committee on Cancer. AJCC cancer staging manual. 7th ed. New York: Springer; 2010.
20. Llovet JM, Bru C, Bruix J. Prognosis of hepatocellular carcinoma: the BCLC staging classification. Semin Liver Dis. 1999;19:329–38.
21. Maida M, Orlando E, Camma C, Cabibbo G. Staging systems of hepatocellular carcinoma: a review of literature. World J Gastroenterol. 2014;20:4141–50.
22. ARCHITECT PIVKA-II [package insert]. Weisbaden, Germany: Abbott GmbH & Co. KG; 2015.
23. ARCHITECT AFP [package insert]. Sligo, Ireland: Abbott Ireland; 2013. 24. Morota K, Komori M, Fujinami R, Yamada K, Kuribayashi K, Watanabe N, et al. Improvement and multicenter evaluation of the analytical performance of an automated chemiluminescent immunoassay for alpha fetoprotein. Int J Biol Markers. 2012;27:39–46.
25. Fujita K, Kinukawa H, Ohno K, Ito Y, Saegusa H, Yoshimura T. Development and evaluation of analytical performance of a fully automated chemilu-minescent immunoassay for protein induced by vitamin K absence or antagonist II. Clin Biochem. 2015;48:1330–6.
26. Breiman L. Random forests. Mach Learn. 2001;45:5–32.
27. DeLong ER, DeLong DM, Clarke-Pearson DL. Comparing the areas under two or more correlated receiver operating characteristic curves: a non-parametric approach. Biometrics. 1988;44:837–45.
28. Ishii M, Gama H, Chida N, Ueno Y, Shinzawa H, Takagi T, et al. Simultane-ous measurements of serum alpha-fetoprotein and protein induced by vitamin K absence for detecting hepatocellular carcinoma. South Tohoku District Study Group. Am J Gastroenterol. 2000;95:1036–40.
29. Yu R, Xiang X, Tan Z, Zhou Y, Wang H, Deng G. Efficacy of PIVKA-II in prediction and early detection of hepatocellular carcinoma: a nested case-control study in Chinese patients. Sci Rep. 2016;6:35050.
30. Lok AS, Sterling RK, Everhart JE, Wright EC, Hoefs JC, Di Bisceglie AM, et al. Des-gamma-carboxy prothrombin and alpha-fetoprotein as biomarkers for the early detection of hepatocellular carcinoma. Gastroenterology. 2010;138:493–502.
31. Izuno K, Fujiyama S, Yamasaki K, Sato M, Sato T. Early detection of hepatocellular carcinoma associated with cirrhosis by combined assay of des-gamma-carboxy prothrombin and alpha-fetoprotein: a prospective study. Hepatogastroenterology. 1995;42:387–93.
32. Sato Y, Nakata K, Kato Y, Shima M, Ishii N, Koji T, et al. Early recognition of hepatocellular carcinoma based on altered profiles of alpha-fetoprotein. N Engl J Med. 1993;328:1802–6.
33. Toyoda H, Kumada T, Kiriyama S, Sone Y, Tanikawa M, Hisanaga Y, et al. Prognostic significance of simultaneous measurement of three tumor markers in patients with hepatocellular carcinoma. Clin Gastroenterol Hepatol. 2006;4:111–7.
34. Volk ML, Hernandez JC, Su GL, Lok AS, Marrero JA. Risk factors for hepatocellular carcinoma may impair the performance of biomarkers: a comparison of AFP, DCP, and AFP-L3. Cancer Biomark. 2007;3:79–87. 35. Gopal P, Yopp AC, Waljee AK, Chiang J, Nehra M, Kandunoori P, et al. Factors that affect accuracy of alpha-fetoprotein test in detection of hepatocellular carcinoma in patients with cirrhosis. Clin Gastroenterol Hepatol. 2014;12:870–7.
36. Richardson P, Duan Z, Kramer J, Davila JA, Tyson GL, El-Serag HB. Determi-nants of serum alpha-fetoprotein levels in hepatitis C-infected patients. Clin Gastroenterol Hepatol. 2012;10:428–33.
![Table 1 ARCHITECT assay performance characteristics [22, 23]](https://thumb-us.123doks.com/thumbv2/123dok_us/646893.2064501/3.595.54.553.99.233/table-architect-assay-performance-characteristics.webp)