Last generation instrument for agriculture multispectral data
collection
Marco Dubbini
1, Andrea Pezzuolo
2, Michaela De Giglio
3, Mario Gattelli
4,
Lucia Curzio
4, Daniele Covi
5, Tatevik Yezekyan
6, Francesco Marinello
2,7*(1. Department of History and Cultures, University of Bologna, 40126 Bologna, Italy;
2. Department of Land, Environment, Agriculture and Forestry, University of Padova, 35020 Legnaro, Padova, Italy; 3. Department of Civil, Chemical, Environmental and Materials Engineering, University of Bologna, 40126 Bologna, Italy;
4. SAL Engineering srl, 48026 Russi, Ravenna, Italy; 5. Eoptis srl, 38121 Trento, Italy;
6. Estonian University of Life Sciences, 51014 Tartu, Estonia; 7. NEOS srl, Spin off of the University of Padova, 35129 Padova, Italy)
Abstract: In recent years, the acquisition and analysis of multispectral data are gaining a growing interest and importance in agriculture. On the other hand, new technologies are opening up for the possibility of developing and implementing sensors with relatively small size and featuring high technical performances. Thanks to low weights and high signal to noise ratios, such sensors can be transported by different types of means (terrestrial as well as aerial vehicles), giving new opportunities for assessment and monitoring of several crops at different growing stages or health conditions. The choice and specialization of individual bands, within the electromagnetic spectrum ranging from the ultraviolet to the infrared, plays a fundamental role in the definition of the so-called vegetation indices (eg. NDVI, GNDVI, SAVI, and dozens of others), posing new questions and challenges in their effective implementation. The present paper firstly discusses the needs of low-distance-based sensors for indices calculation and then focuses on development of a new multispectral instrument, namely MAIA, specially developed for agricultural multispectral analysis. Such instrument features high frequency and high resolution imaging through nine different sensors (1 RGB and eight monochromes with relative band-pass filters, covering the range from 390 to 950 nm). The instrument allows synchronized multiband imaging owing to integrated global shutter technology, with a frame rate up to 5 Hz, and the exposure time can be as low as 1/5000 s. An applicative case study is eventually reported on an area featuring different materials (organic and non-organic), to show potential of the new instrument.
Keywords: wavelengths, vegetation indices, multiband imaging, synchronized, measurement
Citation: Dubbini, M., A. Pezzuolo, M. D. Giglio, M. Gattelli, L. Curzio, D. Covi, T. Yezekyan, and F. Marinello. 2017. Last generation instrument for agriculture multispectral data collection. Agricultural Engineering International: CIGR Journal, 19(1): 87–93.
1 Introduction
The effects of the interaction between the solar
radiation and soil or vegetation are of great interest in
agriculture, thanks to the possibility of collecting
information with non-contact instrumentation.
Specifically, remote or proximal sensors can collect
Received date: 2016-08-05 Accepted date: 2017-01-16
* Corresponding author: Francesco Marinello, Department of Land, Environment, Agriculture and Forestry, University of Padova, 35020 Legnaro, Padova, Italy. Email: francesco.marinello@ unipd.it. Tel: 39 049 8272722. Fax: 39 049 8272750.
reflected electromagnetic radiation from a given surface,
which typically depends on incident radiation and is
inversely proportional to that absorbed by the same
surface (e.g. plants or ground). Sensed data can be used to
collect fast information at ground level (Sofia et al., 2016;
Mavrakis et al., 2014).
With specific reference to vegetation, two main
wavelengths intervals can be identified (Mulla, 2013;
Taghadomi-Saberi and Hemmat, 2015; Ghosh et al.,
2015): in the visible spectrum (390-700 nm) plants
other pigments presence, and in the near infrared
spectrum (700-2500 nm) reflectance is higher mainly due
to multiscattering processes that occur within the
structure of leaves.
The different behavior occurring in the visible and
NIR regions intervals can be used in order to extract and
collect information related to the photosynthetic pigments,
whose activity is typically correlated to the physiological
conditions of vegetation and thus provides indications on
biomass, leaf area, health status, stresses, anomalies, etc.,
benefitting agricultural operations such as seeding or
fertilization (Basso et al., 2016; Marinello et al., 2015).
Indeed, a number of indices has been developed and
proposed, based on calculations of reflectance values at
wavelengths chosen in the two intervals (Bannari et al.,
2007; Li et al., 2010; Miao et al., 2009; Mulla, 2013).
Normalized Difference Vegetation Index (NDVI) is
certainly the most common and well-known: according to
Scopus database, it is cited in the title, abstract or as a
keyword of over 12,000 scientific papers, but other
indices are present in over 18,000 scientific papers.
As mentioned, contactless measurement has been one
of the driving forces behind the studies on
electromagnetic radiations on soil and plants (Karimi et
al., 2015). Non-contact optical instruments can be
therefore mounted at different distances from the surface
of interest, varying from some hundreds of kilometers (as
in the case of satellites) to some hundreds or tens of
meters (as in the case of manned or unmanned aerial
vehicles), down to less than one meter (proximal sensing
with ground based platforms). Following the constant
reduction in optical sensing (Marinello et al., 2008)
particularly in the last few years, a great interest is raising
around lightweight and small instruments, mainly due to
the possibility to load onboard of drones or machinery
(Candiago et al., 2015). Indeed, this can open up to the
possibility of filling the gap and allowing high spatial
resolution spectral imaging, with almost unconstrained
return frequency.
Many instruments have been proposed in the last few
years, allowing measurement at multiple wavelengths
(from 4 to 25 bands) with high resolution (from 0.08 to
2 Mpixels) and featuring reduced weight (typically lower
than 500 g) with interesting performances also in terms of
frame rate (Hill and Clemens, 2015). Some examples are
those produced for instance by Tetracam, Sentek,
Headwall, BaySpec, etc. (Berni, 2009).
2 Materials and methods
In the present paper the development of a new
multispectral instrument is proposed. The new instrument,
namely MAIA, features an array of nine sensors with
1.2 Mpixel resolution: specifically, 1 RGB color and
eight monochrome sensor are available for analysis of the
VIS-NIR spectrum from 390 to 950 nm, operating with a
frame rate of 5 Hz per sensor. The dimensions of the
sensors are 3.6×4.8 mm, with a 3.75 µm pixel size. Each
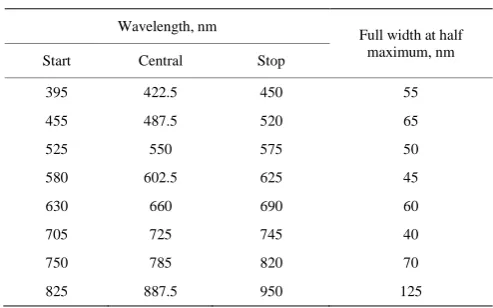
of the eight sensors is provided with a band-pass filter
(Table 1), but the specific configuration of the camera is
designed for relatively fast exchange of filters for
customized needs. Global shutter technology is
implemented: thanks to this solution, all of the pixels in
each sensor start to collect charge simultaneously allowing images to be scanned in “one shot” for synchronized multiband measurements. Exposure time
can be as low as 1/5000 s.
Table 1 Instrument monochrome sensors with relative band-pass filters
Wavelength, nm
Full width at half maximum, nm Start Central Stop
395 422.5 450 55
455 487.5 520 65
525 550 575 50
580 602.5 625 45
630 660 690 60
705 725 745 40
750 785 820 70
825 887.5 950 125
The horizontal and vertical angles of view for the
system are respectively 33.4 and 25.5 degrees, with a
nominal focal length of 7.5 mm (fixed lens). This
corresponds to an imaged area of 45×35 m2 with a ground
sampling distance of 36 mm at 75 m height above ground
and of 6×4 m2 with a ground sampling distance of 5 mm
at 10 m height.
Images are stored in an internal solid-state storage
possibility to save about 10,000 images in the maximum
format allowed (12-bit raw). Considering an overlapping
between images of 50% and a ground sampling distance
of 3.5 cm, this corresponds to a potential maximum area
of over 700 sampled hectares. The instrument is suited for
unmanned aerial vehicles transportation, thanks to its
reduced dimensions (99×128×46 mm3) and weight
(400 g).
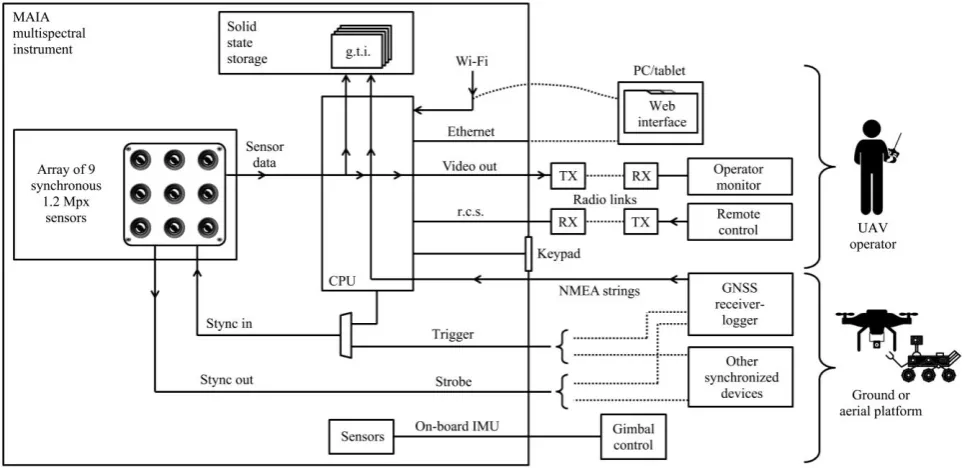
A schematic view of the instrument is proposed in
Figure 1, where r.c.s. indicate the remote control signals
coming from the operator and sent to the central
processing unit (CPU). Data collected from the array of
RGB and monochromatic sensors are processed by the
CPU and sent to the operator monitor. RX and TX
indicate respectively receiver and transmitter. The
instrument can be interconnected with different global
navigation satellite systems: GPS L1 or L1/L2,
GLONASS, Galileo or Beidou, for an accurate log of
synchronized shutter positions (available in PPP, PPK,
RTK). GNSS data are sent in a standard format (NMEA
string) to the CPU; synchronization is ensured by a
feedback loop (indicated by sync in and sync out). The
user can interact with the camera to configure operating
parameters and to manage the images both through the
Giga Ethernet port and through integrated Wi-Fi.
Instrument settings can be configured through the
dedicated keypad using the On-Screen Display on the
Video output port. The system can be stabilized by means
of a gimbal that can get the positioning data directly from
the on-board inertial measurement unit (IMU) for
maximum precision. Co-registration process is based on
specific alignment parameters computed in a laboratory
calibration process which considers each of the nine
optical elements and sensors of the camera. The
instrument is completed by an included pre-processing
software tool, which permits merging the images of each
single band on one multispectral image with the
pixel-convergence.
Figure 1 Schematic representation of the proposed MAIA instrument
2.1 Indices coverage
As discussed in the previous paragraph, the new
multispectral instrument has been designed in order to
allow the maximum flexibility in terms of characterization
capability in the agricultural field, opening to the
possibility of quantifying a large number of vegetation
indices. In Figure 2 the eight bands of the monochrome
sensors are represented (namely BP1÷BP8), together with
the wavelengths occurrences in 81 different vegetation
indices, as reported in literature (Bannari et al., 2007; Li
et al., 2010; Miao et al., 2009; Mulla, 2013). From the
histogram it appears how the eight bands cover the most
important wavelengths, particularly 550 nm (occurring in
20 indices), 670 nm (in 19 indices) and 800 nm (in 22
Figure 2 Wavelengths occurrences in spectral indices and band coverage by the proposed instrument
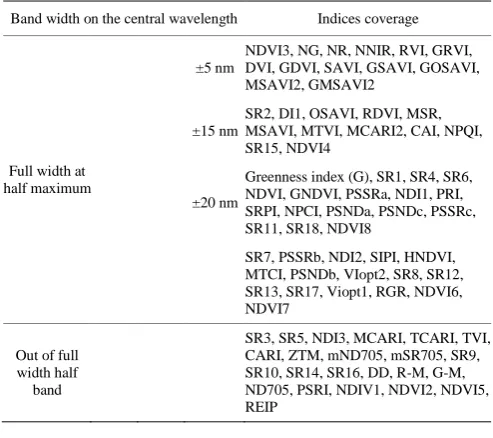
Considering the central wavelength of the eight bands,
with a tolerance of ±5 nm, 16% of the indices can be
properly computed; increasing the tolerance at ±15 nm or
±20 nm, the percentage raises respectively at 31% and
52% of the indices; considering the full width at half
maximum, 72% of the indices can be computed (Table 2).
Table 2 Indices coverage considering different band widths on the central wavelengths of the proposed instrument
Band width on the central wavelength Indices coverage
Full width at half maximum
±5 nm
NDVI3, NG, NR, NNIR, RVI, GRVI, DVI, GDVI, SAVI, GSAVI, GOSAVI, MSAVI2, GMSAVI2
±15 nm
SR2, DI1, OSAVI, RDVI, MSR, MSAVI, MTVI, MCARI2, CAI, NPQI, SR15, NDVI4
±20 nm
Greenness index (G), SR1, SR4, SR6, NDVI, GNDVI, PSSRa, NDI1, PRI, SRPI, NPCI, PSNDa, PSNDc, PSSRc, SR11, SR18, NDVI8
SR7, PSSRb, NDI2, SIPI, HNDVI, MTCI, PSNDb, VIopt2, SR8, SR12, SR13, SR17, Viopt1, RGR, NDVI6, NDVI7
Out of full width half band
SR3, SR5, NDI3, MCARI, TCARI, TVI, CARI, ZTM, mND705, mSR705, SR9, SR10, SR14, SR16, DD, R-M, G-M, ND705, PSRI, NDIV1, NDVI2, NDVI5, REIP
3 Results and discussion
3.1 Sensors performance
In the present paragraph some aspects of the new
instrument performance are discussed. Figure 3 shows the
Quantum Efficiency curve QE(λ) of the imaging sensor weighted by the Transmittance curve T(λ) of the bandpass filters. The product between these two
quantities is the key figure related to the light detection
efficiency of the camera. The QE data are provided by the
sensor manufacturer, while the transmittance has been
measured by means of a spectrophotometer on the filters
actually used.
Figure 3 Wavelengths occurrences in spectral indices and band coverage by the proposed instrument
Other elements in the optical path are the protective
glass window and the lens. They feature a flat
transmittance across the wavelength range of interest and
have therefore been neglected in the calculations. The
bandpass filters have been custom designed in order to
optimize their performance and achieve high
transmittance within the band, steep transition from the
pass-to blocking-region and no overlap between adjacent
bands. The in-band transmittance of the filters is in
average higher than 90%. This feature allows to fully
exploit the excellent quantum efficiency of the sensors,
which is one of the highest currently available
efficiencies on the market. The transition between T=10%
and T=90% is approximately 5 nm and therefore the gap
between the band is so small that the full VIS-NIR
spectrum can be effectively explored.
of the camera is the area underneath the curve QE·T
(Figure 4). The area is the integral of all photons that hits
the sensor and that can be converted into an electric
signal. The larger the area, the higher the signal and
brighter the image.
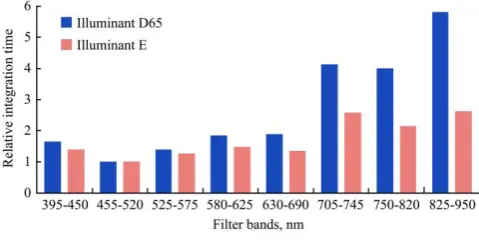
Figure 4 Relative energy distribution for different wavelength bands
The number of photons reaching the sensor in each
band also depends on the spectrum of the light source that
illuminates the observed target and the reflectance of the
target itself. By choosing a certain illuminant and
reflectance spectrum, it is possible to estimate what is the
expected energy distribution of the photons among the
bands and, by integration over wavelengths, calculate the
expected signal that the camera will detect.
It is important that the difference between the highest
and the lowest signal is as low as possible. A difference
between these values turns into a difference in the
integration times that has to be used by the sensor in
order to obtain the same digital number while detecting
them. Having images with the same average digital
number is not mandatory for the proper calculation of a
certain index.
However, it is a constraint that is often implicit in
real-life operations, when a camera shot in auto-exposure
mode. In this case, the sensor that receives the lowest
amount of light needs the longest integration time and
becomes the bottleneck of the system because it sets the
limit for the maximum speed that the UAV can travel
without having motion blur in the images. An estimation
of the ratio between the signals in the various bands
(keeping the highest as divider) has been calculated under
the following assumptions:
The illuminant is the average midday light of the sun at European latitude (D65, according to ISO
10526:1999/CIE S005/E-1998 standard); this is not
only a well-known illuminant but also in agreement
with the very likely operating scenario of the system.
Also the equal-energy illuminant E has been
considered for reference.
The reflectance of the target is 100% across the wavelength range, which is equivalent of having a
perfectly white target; such reflectance curve
(differently from others like those of vegetation, soil
or water) is interesting due to its independency from
the specific application.
Results are depicted in Figure 4, and show how the
bands in the visible range are expected to gather a similar
signal. Specifically, in the visible region a factor lower
than two is detected between the highest and lowest
bands, while in the near infrared region, the rate increases
up to a factor of five (Figure 5). This is due to the
combination of two elements:
The decrease of QE in the NIR region, typical of a silicon-based detector
The fact that the NIR region is split in three bands and therefore the available energy is shared on three
sensors.
The latter has been a design choice that is needed in
order to maximize the above mentioned instrument
flexibility in indices calculation.
Figure 5 Relative integration times for different wavelength bands
3.2 Field application
The first field test analysis for the evaluation of the
instrument performance was carried out. Tests were
performed considering the acquisition of the
pseudo-nadiral images with the sensor installed on board
a four-rotor unmanned aerial vehicle (Figure 6a). The
radio-controlled quadcopter was operated in an area
featuring different physical conditions on the ground
terms of materials (grass, bare soil, asphalt, brick, etc.)
and ground conformation (different relative heights and
different dimension). Reference spots (fiducial marks)
were positioned on the ground in order to test the ability
of the instrument to align the nine images.
a. MAIA sensor installed on board a drone
b. Signal collected by the nine sensors
Figure 6 New instrument during field measurements
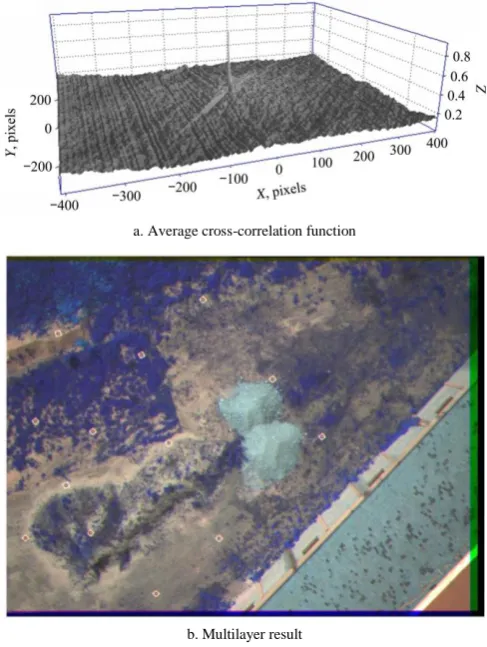
In order to assess the quality of the co-registration
process, the images from the nine sensors (Figure 6b)
were post-processed in order to calculate the average
normalized cross-correlation, as reported in Figure 7a.
Cross-correlation function describes the statistical
similarity between two images, and values close to one
are indicative of an ideal degree of correspondence (Van
der Meer, 2006).
For the scope, images underwent normal gradient
calculation and subsequent binarization, in order to
highlight borders and fiducial marks, and eliminate
differences intrinsically present due to the different signal
collected at different wavelength. Cross-correlation was
then computed for any given couple of scans picked
between the nine collected for a total of 36 controls per
measurement. An average value higher than 0.99 was
detected and values higher than 0.97 were in general
detected for any given couple of scans. This correspond
to an average shift between different scans which is in
general comprised between 0.1 and 0.4 pixels, with an
average misalignment as low as 0.14 pixels.
Such good correlation is at a basis of the possibility to
generate a multi-layer product as a result of aligned scans
taken at different wavelengths (Figure 7). This is a
primary condition when vegetation indices have to be
computed from multispectral measurements and pixel or
even sub-pixel accuracy is needed to allow specific
localization of extracted indices.
a. Average cross-correlation function
b. Multilayer result
Figure 7 Result of the co-registration process
4 Conclusions
The present paper focuses on the development of a
new instrument allowing exploitation of multispectral
measurements, covering the visible and near-infrared
range (from 390 to 950 nm). The main features of the
proposed instrument include:
useful for determination of a large number of spectral
indices;
implementation of a global shutter technology which allows collection of images with a high level of
accuracy with respect to alignment (average
cross-correlation higher than 0.995);
custom designed filters characterized by high
transmittance within the band, steep transition from
the pass- to blocking-region and no overlap between
adjacent bands;
homogeneous relative energy distribution and low integration time disparity between different detected
bands, especially in the visible field;
High resolution imaging, high frequency frame rate
and relatively low dimensions and weight give the new
instrument ideal characteristics for ground or aerial
sensing to exploit vegetation indices extrapolation in
agricultural applications.
Acknowledgements
The activity of Francesco Marinello and Andrea
Pezzuolo is supported by a grant from the University of
Padova (code CPDA143174), Italy.
References
Bannari, A., K. S. Khurshid, K. Staenz, and J. W. Schwarz. 2007. A Comparison of hyperspectral chlorophyll indices for wheat crop chlorophyll content estimation using laboratory reflectance measurements. IEEE Transactions on Geoscience and Remote Sensing, 45(10): 3063–3074.
Basso, B., B. Dumont, D. Cammarano, A. Pezzuolo, F. Marinello, L. Sartori. 2016. Environmental and economic benefits of variable rate nitrogen fertilization in a nitrate vulnerable zone.
Science of the Total Environment, 545-546: 227–235. Berni, J. A. J., P. J. Zarco-Tejada, L. Suarez, and E. Fereres. 2009.
Thermal and narrowband multispectral remote sensing for vegetation monitoring from an Unmanned Aerial Vehicle.
IEEE Transactions on Geoscience and Remote Sensing, 47(3): 722–738.
Candiago, S., F. Remondino, M. De Giglio, M. Dubbini, and M. Gattelli, 2015. Evaluating multispectral images and vegetation indices for precision farming applications from UAV images.
Remote Sensing, 7(4): 4026–4047.
Ghosh, S., T. R. C. Domínguez, B. Diezma, L. Lleó, P. Barreiro, T.G. Lacarra, and J.M. Roger. 2015. VIS/NIR spectral signature for the identification of peanut contamination of powder foods. CIGR Journal, 17(2): 310–329.
Hill, S. L., and P. Clemens. 2015. Miniaturization of high spectral spatial resolution hyperspectral imagers on unmanned aerial systems. In Proceedings of the SPIE 9482, Next-Generation Spectroscopic Technologies VIII. 94821E.
Karimi, H., H. R. Ghassemzadeh, P. Pashaee, and E. Z. Shahamat. 2015. Proposing an appropriate soil water content estimation technique for Iran. CIGR Journal, 17(2): 1–10.
Li, F., Y. Miao, S. D. Hennig, M.L. Gnyp, X. Chen, L. Jia, and G. Bareth. 2010. Evaluating hyperspectral vegetation indices for estimating nitrogen concentration of winter wheat at different growth stages. Precision Agriculture, 11(4): 335–357. Marinello, F., E. Savio, S. Carmignato, and L. De Chiffre, 2008.
Calibration artefact for the microscale with high aspect ratio: The fiber gauge. CIRP Annals - Manufacturing Technology, 57(1): 497–500.
Marinello, F., A. Pezzuolo, F. Gasparini, J. Arvidsson, and L. Sartori. 2015. Application of the Kinect sensor for dynamic soil surface characterization. Precision Agriculture, 16(6): 601–612.
Mavrakis, A., A. Colantoni, and L. Salvati. 2014. Soil degradation, landscape and climate variations in a Mediterranean agro–forest system (Thriasio, Greece): proposal for a desertification indicator using time series analysis.
International Journal of Agricultural Resources Governance and Ecology, 10(4): 335–343.
Miao, Y., D. J. Mulla, G. W. Randall, J. A. Vetsch, and R. Vintila. 2009. Combining chlorophyll meter readings and high spatial resolution remote sensing images for in-season site-specific nitrogen management of corn. Precision Agriculture, 10(1): 45–62.
Mulla, D. J. 2013. Twenty-five years of remote sensing in precision agriculture: Key advances and remaining knowledge gaps.
Biosystems Engineering, 114(4): 358–371.
Sofia, G., F. Marinello, and P. Tarolli. 2015. Metrics for quantifying anthropogenic impacts on geomorphology: Road networks. Earth Surface Processes and Landforms, 41(2): 240–255.
Taghadomi-Saberi, S., and A. Hemmat. 2015. Improving field management by machine vision - A review. CIGR Journal, 17(3): 92–111.
Van der Meer, F. 2006. The effectiveness of spectral similarity measures for the analysis of hyperspectral imagery.