QT interval Detection in ECG using Pan
Tompkins Algorithm and Trapeziums Area
Method
N. I. Ingle
Lecturer, Department of Instrumentation Engineering, GCOEA Pune, Maharashtra, India
ABSTRACT: ECG is used for measuring the electrical activity of the heart in patients and it is the most basic tool in medical field for diagnosis. Now a days there may be automated or semi-automated ECG analysis algorithms which are expected to play vital role in the utilization of the ECG data. Most important in ECG analysis is to detect QRS complex and other waves accurately. It is the fundamental step so that doctors can easily detect diseases properly. This paper is one of the effort of measuring QT interval in ECG with an automatic computerized algorithm because many diseases are related with QT interval. The general methodology adopted in this algorithm is to find more consistent QT interval measurement by using the combination of Pan Tompkins and Trapeziums Area method with Arrhythmia database taken from Physio-net. Pan Tompkins algorithm contains a band pass filter to cut off the high, low and DC noise ,a differentiator and a squaring operator that emphasize the steep prominent features, and an adjustable moving window integrator for smoothing. TRA method is used to detect T wave end.
KEYWORDS: Electrocardiograph (ECG), Pan Tompkins Algorithm(PTA), QT variability(QTV), Trapeziums Area Method(TRA).
I. INTRODUCTION
Different types of tiny waves in ECG indicates various electrical activities and mechanism of the heart. Like, P wave is the effect of the depolarization of the atrium before their contraction, while the QRS complex is caused by electric currents obtained from the depolarization of the ventricles prior to their contraction, during the extending of the depolarization in the ventricular myocardium. The QRS complex composed of three different types of waves, the Q, R, and S waves. The T wave is produced when ventricles get recovered from the state of depolarization. The T wave is specified as the wave of re polarization. A normal and healthy ECG consists of a P wave, a QRS complex, and a T wave. Specifically QRS complex is a group of tiny three different waves, the Q, R, and S waves. Note that both the P wave,v wave,and the waves that form the QRS complex, are depolarization waves. The role of T wave is very much interested because T wave is produced during recovery of the ventricles from the state of depolarization. Accuracy of T wave end is very much essential to determine the QT interval. QT interval variability is of interest as its correspondence is with increased cardiovascular morbidity. The analysis of beat to beat QT interval variability has received or indicates significant results. The significance of QT analysis followed by several approaches and their finding with limitations, analyses the signals under various cardiac conditions to assess the ventricular arrhythmia. Similarly, in thyroid patients the QT interval get prolonged and T wave is inverted. Although this is not true for all patients who suffer from thyroid diseases but at least we can consider the chances of thyroid diseases.
II. ECGDATABASE
open source analysis format, also providing solution for data analysis and evaluation of proposed new algorithms. Physio Bank is a large and growing collection of well specified digital recordings of bio-medical signals for use
by the
bio-medical researchers.
Fig. 1. Electrocardiograph
III.METHOD
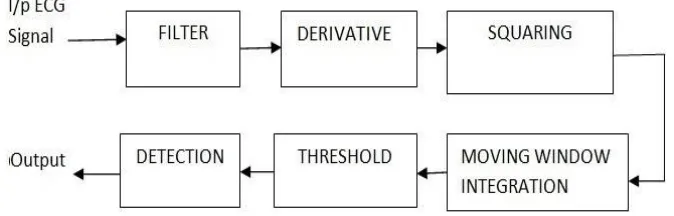
A. Pan Tompkins Algorithm
Pan and Tompkins discovered real-time QRS detection algorithm based on analysis of the slope, width and amplitude of QRS complexes. This algorithm contains some commonly used steps of signal processing, like series of the filters and methods that perform low pass, high-pass derivative, squaring, integration, threshold. A recursive low pass filter provides an attenuation greater than 35 dB at 50 Hz to suppress the power-line interference. The high-pass filter has a cut off frequency of 5 Hz and it introduces delay of 80 ms maximize the QRS energy is approximately 5-15 Hz. By choosing our sample rate, we could not design a band pass filter directly for the desired pass band of 5-15 Hz using this specialized design technique. Therefore, we obtained 3 dB of pass band by cascading the low pass and high-pass filters from about 5-12 Hz, then in the derivative section low frequency components of P and T wave and it provides the large gain to high frequency part of signal arising from the high slopes of the QRS complex. The transfer function of the second-order low-pass filter is-
H (z) = (1 − z− 6)2 / (1 − z− 1)2 (1)
The difference equation of the filter is-
y(nT ) = 2y(nT − T ) − y(nT − 2T ) + x(nT ) −2x(nT− 6T ) + x(nT − 12T ) (2)
Where the gain is 36 and cuto ff frequency is about 11 Hz. While the delay is six samples which is generated due to filter processing.
Here design of high pass filter is obtained on subtracting the output of a first order low pass filter from an all pass filter. The transfer function for such designed high-pass filter is-
H (z) = (−1 + 32z− 16 + z6 − 32)/(1 + z− 1) (3)
The difference equation is-
Y (nT ) = 32x(nT −16T )−[y(nT −T )+x(nT )−x(nT−32T )] (4)
H (z) = (1/8T )(−z− 2 − 2z− 1 + 2z1 + z2 ) (5) The difference equation is-
y(nT ) = (1/8T )[−x(nT− 2T ) − 2x(nT − T ) + 2x(nT + T ) + x(nT + 2T ] (6)
In next step, the squaring operation makes the results positive and then emphasizes large differences resulting from a QRS complexes. The equation of this operation is-
y(nT ) = [x(nT )]*[x(nT)] (7)
Then finally, the output of the preceding operations is smoothed through a moving window integration to prevent merging of the QRS and T waves, but large enough to the yield only one peak for the single QRS complex. Waveform feature information is mainly obtained from moving window integration in addition to the slope of the R wave.Then equation is
-y(nT ) = 1/N [x(nT −(N −1)+x(nT−(N −2)T )+...+x(nT ))] (8)
Where, N is denoted with the number of samples in the width of the integration window.
Fig. 2. Pan Tompkins Algorithm
B. Detection of T wave end
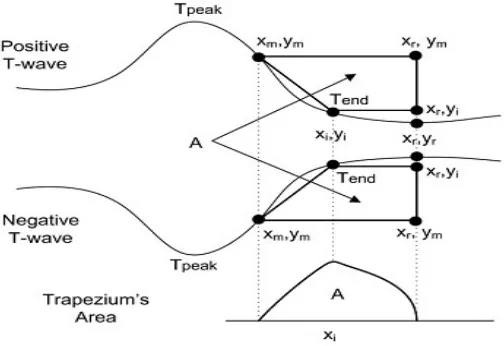
The detection of end point on T wave in electrocardiogram (ECG) is a basic procedure for ECG processing and analysis. A new proposal and algorithm for T-wave end location based on the computation of Trapezium’s areas is proposed and validated. We consider here monophasic T wave. The TRA method is totally depend on measuring the successive areas of a rectangular trapeziums which have three fixed vertexes and one mobile vertex:(Xi, Yi), which is shifted through the signal from (Xm, Ym) to (Xr, Yi),at that time the total area is computed. We indicate T-wave end point where the area A of the trapeziums is maximum. The formula for the area of the trapeze is:
A = 0.5(Y m − Y i)(2X r − X i − X m) (9)
1. The point having coordinators (Xm,Ym) respectively, of a point with the highest absolute derivative inside the T-wave and after the last peak. The derivative value on this point is a minimum negative for positive T-waves and is a maximum. positive for the negative T-waves.
3. Here one consideration is that, the point(Xi,Yi) is the only moving point among all two points which are indicated in the diagram As shown in Figure, We found that the area A will be : minimum or zero when (Xi, Yi) is directly placed on the vertexes (Xr, Yr) or (Xm,Ym), respectively. Maximum when (Xi, Yi) is on the end of the T-wave, and that point is consider as T wave end.
Fig. 3: Trapezium Area method
C. Processing
1. Decide the point ”Xm” which is located in the segment after T peak in T wave, which has a minimum (maximum) value in the first derivative, and after the maximum (minimum) for a T-wave positive (negative). 2. Locate a point denoted as ”Xr” which is inside the isoelectric segment and searched in a window from the
peak (maximum or minimum) of the T-wave in ECG, preferably near to zero. If no point satisfied this condition, the central point is chosen. Actually, the exact position of this point is not very important as long as it is beyond the T end point. Calculation of the trapeziums areas of all the points located between ”Xm” and ”Xr”. Recognition of the point with maximum area identified as the T-wave end.
D. QT interval
Fig. 4. P r o l o n g a t i o n o f Q T i n t e r v a l
IV.FUTURESCOPE
The automatic classification of arrhythmia helps in recognizing the diseases more accurately with less time. In the future this effort could be extended as an ECG based, automated diagnostic tool for various diseases of Cardiovascular System. More work is necessary in order to detect P wave as well which provide additional information about specific functionality. Diagnosis of Thyroid Patients with the help of QT Interval and inverted T wave detection.
V. RESULT
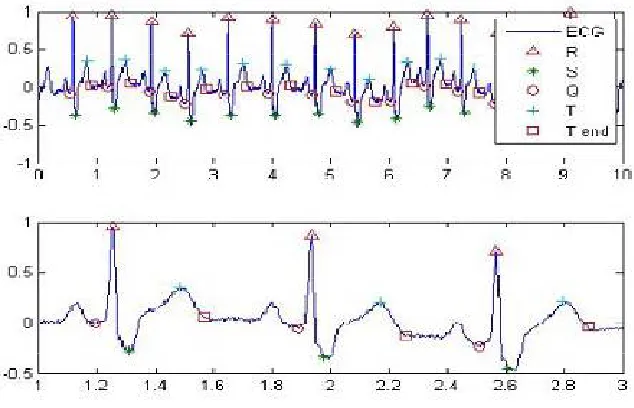
Here, we consider a signal of 212 (ML-II) female , age 32 from Physionet. We obtained following results for this a signal of 212(ML-II) female, age 32 fromPhysionet .We obtained following results for
Fig. 6 QT Interval
Similarly, following are the some more results as follows using the combination of Pan Tompkins algorithm and TRA method.
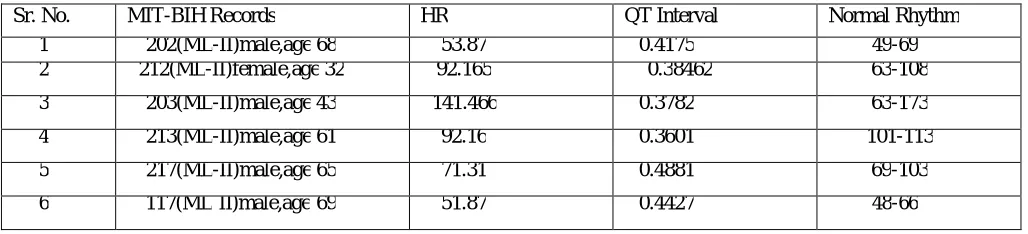
Sr. No. MIT-BIH Records HR QT Interval Normal Rhythm
1 202(ML-II)male,age 68 53.87 0.4175 49-69
2 212(ML-II)female,age 32 92.165 0.38462 63-108
3 203(ML-II)male,age 43 141.466 0.3782 63-173
4 213(ML-II)male,age 61 92.16 0.3601 101-113
5 217(ML-II)male,age 65 71.31 0.4881 69-103
6 117(ML II)male,age 69 51.87 0.4427 48-66
Table1. Performance using this method
VI.CONCLUSION
This method is able to detect the QRS complex more accurately. ECG is non-invasive technique so that only ob- serving the ECG graph of patient we can diagnosis the disease like Arrthimiya and we can derive the QT interval by making combination of Pan Tompkins and TRA method.
REFERENCES
[1] J. Pan and W. J. Tompkins, “A real-time qrs detection algorithm,”Biomedical Engineering, IEEE Transactions on, no. 3, pp. 230– 236,1985.
[3] M. Shojaie and A. Eshraghian, “Physiologic signal archives for biomed- ical research.” Primary hypothyroidism presenting with Torsades de pointes type tachy-cardia: a case report, no. 1.1, p. 298, 2008.
[4] P. Muaynoi, S. Tretriluxana, and K. Chitsakul, “Signal processing for heart rate variability analysis case study: Ventricular tachycardia condi- tion,” in Biomedical Engineering International Conference (BMEiCON), 2011. IEEE, 2012, pp. 117–119.
[5] M. Risk, J. Bruno, M. L. Soria, P. Arini, and R. Taborda, “Measurement of qt interval and duration of the qrs complex at different ecg sampling rates,” in Computers in Cardiology, 2005. IEEE, 2005, pp. 495–498.
[6] S. Singh, “Pattern analysis of different ecg signal using pan-tompkins algorithm 1,” 2010
[7] C. R Vazquez-Seisdedos, J.E. Neto, E. J. M Reyes, A Klautau, and R. C. L. De Oliveira, “New approach for t wave end detection on electrocardiogram: Performance in noisy conditions,” Biomedical engineering online, vol. 10, no. 1, p.77, 2011.
[8] F. Osman, M. D. Gammage, and J. A. Franklyn, “Thyroid disease and its treatment: short-term and long-term cardiovascular consequences,” Current opinion in pharmacology, vol. 1, no. 6, pp. 626–631, 2001