IJPAR |Vol.6 | Issue 1 | Jan - Mar -2017
Journal Home page: www.ijpar.com
Research article Open Access
Method development and validation of simultaneous estimation of
metformin and glibenclamide in combined tablet dosage form by RP-HPLC
method
Dr.A.Yasodha*
1, B.Kavitha
1, G.Venkataih
1, A.Sivakumar
2 1Dhanvanthri College of Pharmaceutical Sciences, Mahabubnagar- 509002, Telangana, India.
2AurobindoPharma Limited, Unit –VII, Jadcherla, Hyderabad.
*Corresponding Author: Dr.A.YasodhaEmail: [email protected]
ABSTRACT
A new simple, accurate, rapid and precise isocratic high performance liquid chromatographic (HPLC) method was developed and validated for the determination of Metformin and Glibenclamide in tablet formulation. The proposed HPLC method utilizes Develosil ODS HG-5 RP C18, 250 mm x 4.6 mm I.D; 5 μm with a flow rate of 1.0 mL/min, mobile phase consisting of Methanol : Acetate buffer (pH=3.0) = 75:25 (v/v) at a detection wavelength 256 nm. The method was validated in terms of accuracy, precision, linearity, limits of detection, limits of quantitation, and robustness. This optimized method has been successively applied to pharmaceutical formulation and no interference from the tablet excipients was found. Retention times of Metformin and Glibenclamide were found to be 2.24 min, and 3.28 min with a tailing factor 1.30, 1.29and 2603, 3534 as theoretical plates respectively which are within the limits. All the parameters were validated according to the ICH guidelines and found to be within limits. Limit of detection (LOD) and Limit of quantification (LOQ) were estimated from the signal-to-noise ratio. The LOD values of Metformin and Glibenclamide were found to be 0.062 and 0.018 µg/mL respectively. Metformin and Glibenclamide LOQ’s were found to be 0.19, and 0.056µg/mL respectively. Linearity ranges for Metformin and Glibenclamide were 2-10 µg/mL, and 3-15 µg/mL respectively. Percent recovery study values of Metformin and Glibenclamide were found to be within 98-100 %. This new method was successfully developed and validated as per ICH guidelines, can be utilized for the quantitative estimation of Metformin and Glibenclamide in pharmaceutical dosage forms.
Keywords:
Metformin, Glibenclamide, RP-HPLC, Validation, Simultaneous estimation.INTRODUCTION
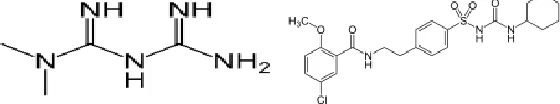
Metformin hydrochloride (MET)
1-Carbamimidamido-N-N-Dimethyl
Methanimidamide is an antihyperglycemic agent
production, decreasing intestinal absorption of glucose, and improving insulin sensitivity by increasing peripheral glucose uptake and utilization. These effects are mediated by the initial activation by metformin of AMP-activated protein kinase (AMPK), a liver enzyme that plays an important role in insulin signaling, whole body energy balance, and the metabolism of glucose and fats. Increased peripheral utilization of glucose may be due to improved insulin binding to insulin receptors. Metformin administration also increases AMPK activity in skeletal muscle. The rare side effect, lactic acidosis, is thought to be caused by decreased liver uptake of serum lactate, one of the substrates of gluconeogenesis.
Glibenclamide is the most extensively used sulphonylurea in many parts of the world for the
management of noninsulin- dependent diabetes mellitus (NIDDM). It is practically insoluble in water; slightly soluble in alcohol and in methyl alcohol; sparingly soluble in dichloromethane. It is a second-generation sulfonylurea antidiabetic agent, appears to lower the blood glucose acutely by stimulating the release of insulin from the pancreas, an effect dependent upon functioning beta cells in the pancreatic islets. Glibenclamide bind to ATP-sensitive potassium channels on the pancreatic cell surface, reducing potassium conductance and causing depolarization of the membrane. Depolarization stimulates calcium ion influx through voltage-sensitive calcium channels, raising intracellular concentrations of calcium ions, which induces the secretion, or exocytosis of insulin [1-3].
Fig 1.1: Structures of Metformin & Glibenclamide
MATERIALS AND METHODS
Instrument specifications:
Waters HPLC 2965 systemChemicals and reagents
Methanol obtained from local market,
manufactured Pure METFORMIN and
GLIBENCLAMIDE were obtained as gift sample from Aurabindo Pharma India Ltd; The tablet dosage form BEN Q MET 500mg (claim: 400.mg
METFORMIN HCL and 2.5mg
GLIBENCLAMIDE) was procured from local market.
Preparation of standard stock solutions
Working mixed standard solutions of concentrations at 50, 75, 100, 125 and 150% levels (i.e., 400mg/ml of Metformin HCl and 2.5mg/ml of Glibenclamide) were prepared by appropriate dilutions of the mixed standard stock solution with the diluent. The solutions thus prepared were filtered through 0.45µ membrane filter and the resulting filtrates were sonicated for 5min [4].
Preparation of sample solutions
BEN Q MET a commercial formulation containing a combination of Metformin HCl and Glibenclamide has been taken up for evaluating the proposed method for formulation. Twenty tablets were weighed and titurated to a fine powder, was weighed accurately weight equivalent to 10 mg (i.e., 9.525 mg) from the powdered sample was weighed and transferred into a 50ml volumetric flask and was dissolved in the diluent. The volume was made upto the mark with the same and the resulting solution was labeled as sample stock solution (contains 10mg of Metformin HCl and 0.1mg of Glibenclamide per ml). The solution was shaken well and allowed to stand for 15 min with intermittent sonication to ensure complete solubility of drug and filtered through a 0.45 μm membrane filter [5].
Preparation of Placebo solution
resulting solution was transferred into 10ml volumetric flask and the volume was made upto the mark with the diluent. The solution thus prepared was filtered and the resulting filtrate was sonicated for 10 minutes [6].
Method Validation and Results
Procedure
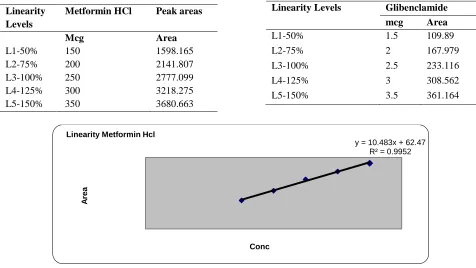
The solutions of 100% level (i.e., solutions containing 500µg/ml of Metformin HCl and 2.5µg/ml of Glibenclamide) which were previously prepared in duplicate were injected at the optimized method conditions and the chromatograms were recorded and the percentage drug content was calculated.
Figure: 2.5.1 Chromatogram of Blank
Figure: 2.5.3 Chromatogram of sample (02) Metformin HCl and Glibenclamide.
Figure: 2.5.5 Chromatogram of standard (01) Metformin HCl and Glibenclamide.
Figure: 2.5.7 Chromatogram of standard (03) Metformin HCl and Glibenclamide.
The % assays of Metformin HCl and Glibenclamide were found to be 100.02% and 99.36% respectively and were within the acceptance limits. Hence the developed method can
be routinely used for the simultaneous estimation of Metformin HCl and Glibenclamide in the marketed formulations.
Table: 2.5.1 Assay Results Of Metformin HCl&Glibenclamide
Metformin HCl Glibenclamide
Standard Area 1 2671.765 217.271
2 2725.489 222.936
3 2709.08 220.328
Average 2702.111 Average 220.178
Sample area 1 2696.018 217.364
2 2702.791 215.416
3 2725.474 220.243
Average 2708.094 Average 221.007
Tablet average weight 500 Mg 5mg
Standard weight 250 Mg 2.5mg
Sample weight 250 Mg 2.5mg
Label amount 500 Mg 5mg
std.purity 99.6% 99.7%
Cal.: 502.70 Mg 5.01mg
METHOD VALIDATION
Specificity
Procedure
The Placebo solution was injected at the optimized conditions and the chromatogram was
recorded. As there were no peaks were found at the retention times of Metformin HCl and Glibenclamide, the proposed method was specific for the detection of the same [7].
Figure: 3.1.1 Chromatogram of placebo
Figure: 3.1.3 specificity sample (02) Metformin HCl & Glibenclamide
System suitability
Five replicate injections of standard solution were injected and the chromatograms were recorded. The system was suitable for analysis if the % relative standard deviation (%RSD) of area counts in five replicate injections should be not more than 2.0%.USP tailing factor for Metformin HCl and Glibenclamide peak should be not more than 2.0.USP resolution factor between the peaks
corresponding to Metformin HCl and Glibenclamide should be more than 2.0 [8].
Procedure
The standard solution was prepared as per the proposed assay method and was injected into the HPLC system. The tailing factor and theoretical plate count of Metformin Hcl and Glibenclamide peak from fifth injection and % RSD on replicate injections were recorded.
Table 3.2.1: System Suitability parameters of Metformin HCl Injection Rt(min) Area USP Plate Count USP Tailing
1 2.240 2706.929 2443 1.22
2 2.240 2727.230 2603 1.308
Mean - 2717.079 -
%RSD - 1.7 - -
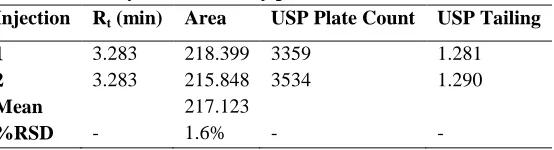
Table 3.2.2: System Suitability parameters of Glibenclamide Injection Rt (min) Area USP Plate Count USP Tailing
1 3.283 218.399 3359 1.281
2 3.283 215.848 3534 1.290
Mean 217.123
%RSD - 1.6% - -
Linearity and Range
The linearity of an analytical method is its ability to elic it test results that are directly, or by a well-defined mathematical transformation, proportional to the concentration of analyte in samples within a given range.
Procedure
Standards equivalentto50%, 75%, 100%, 125% & 150% of the stated amount of standard were
weighed individually and the s o l u t i o n s w e r e p r e p a r e d a c c o r d i n g t o t h e a s s a y m e t h o d . A graph of weight taken (%) versus chromate graphic area was plotted. There gressionline obtained was linear. From the data obtained, co-relation coefficient, slopeandy-intercept were calculated. Ideally co-relation coefficient should be not less than 0.999 [9].
Figure: 3.3.2 Chromatogram of Metformin HCl & Glibenclamide at 100%
Figure: 3.3.3 Chromatogram of Metformin HCl & Glibenclamide at150%
Table 3.3.1 linearity data of Metformin HCl and linearity data of Glibenclamide
Linearity Levels
Metformin HCl Peak areas
Mcg Area
L1-50% 150 1598.165
L2-75% 200 2141.807
L3-100% 250 2777.099
L4-125% 300 3218.275
L5-150% 350 3680.663
Figure 3.3.4 Graphical Representation of Linearity range of Metformin HCl.
y = 10.483x + 62.47 R² = 0.9952
A
re
a
Conc Linearity Metformin Hcl
Linearity Levels Glibenclamide
mcg Area
L1-50% 1.5 109.89
L2-75% 2 167.979
L3-100% 2.5 233.116
L4-125% 3 308.562
Figure 3.3.5 Graphical Representation of Linearity range of Glibenclamide.
Precision
The precision of an analytical method was the degree of agreement among individual test results when the method is applied repeatedly to multiple sampling of homogenous sample. The precision of analytical method is usually expressed as the standard deviation or relative standard deviation (coefficient of variation) of series of measurement [9].
System Precision
The system precision was checked by using standard Metformin HCl, Glibenclamide to ensure
that the analytical system was precise. The retention time and area of five determinations was measured and RSD was calculated. % RSD of the assay value for five determinations should not be more than 2.0%.
Procedure
The standard solution was prepared as per the proposed assay method in five determinations and was injected into HPLC system. The retention time and peak area of five determinations was measured and RSD was calculated [9].
Figure: 3.5.1 precision 01 Metformin HCl & Glibenclamide
y = 128.63x - 85.423 R² = 0.9974
A
re
a
Figure: 3.5.2 precision 02Metformin HCl & Glibenclamide
Figure: 3.5.3 precision 03 Metformin HCl & Glibenclamide
Data Interpretation
It was observed from the data tables above, that the retention time and area responses are consistent as evidenced by the values of relative standard deviation. Hence, it can be concluded that the system precision parameter meets the requirement of method validation.
Method Precision
In method precision, a homogenous sample of a single batch was analyzed six times. This indicates whether a method was giving consistent results for a single batch. The method precision was
performed on Metformin HCl, Glibenclamide formulation. The % RSD of the assay value for six determinations should not be more than 2.0%.
Procedure
Method precision indicates whether a method is giving consistent results for a single material. The sample solution was prepared as per the proposed assay method in five determinations and was injected into HPLC system. The retention time and peak area of five determinations was measured and RSD was calculated [10].
Table 3.7.1 Method Precision of Metformin HCl and Method Precision of Glibenclamide
S. No Retention time( Rt ) Area
1 2.337 2767.579
2 2.26 2710.928
3 2.233 2689.908
AVG 2.276 2722.495
STDEV 0.0381 29.538
%RSD 1.4 1.2
Accuracy
The accuracy of an analytical method is the closeness of test results obtained by that method to the true value. The accuracy of an analytical method should be established across its range. Accuracy is performed in three different levels for Metformin HCl and Glibenclamide at 50%, 100% and 150%. Samples analysed at each level in triplicate. From the results, % recovery was calculated. Average % recovery at each spike level not less than 98.0 and not more than 102.0 [10].
Preparation of Standard and Test Solutions
Mixed standard solutions containing 150µg/ml, 400µg/ml and 650µg/ml of Metformin HCl (60µg/ml, 160µg/ml and 260µg/ml of Glibenclamide respectively) were prepared in triplicate, from the mixed standard stock solution by appropriate dilutions. A test solution containing 100µg/ml of Mteformin Hcl and (40µg/ml of
Glibenclamide) was prepared by appropriate dilution of the sample stock solution [11].
Procedure of Spiking
Spiking at 50% level was accomplished in triplicate, by adding 2.5ml of sample stock solution to 3.75ml of mixed standard stock solution (containing 1mg/ml of Metformin HCl and 0.4mg/ml of Glibenclamide) in a test tube. The contents of test tube were then cautiously filtered through Whatmann filter paper. In order to collect the remnants of the solution, the test tube and filter paper were washed with small quantities of diluent, and the washings were added to the filtrate through the same filter paper. Then the volume of filtrate was made up to 25ml with the diluent and the resultant solution was filtered through 0.45µ membrane filter. In the similar manner, spiking at 100% and 150% levels was carried out by adding 2.5ml of sample stock solution separately to 10ml and 16.25ml of mixed standard stock solution respectively [12].
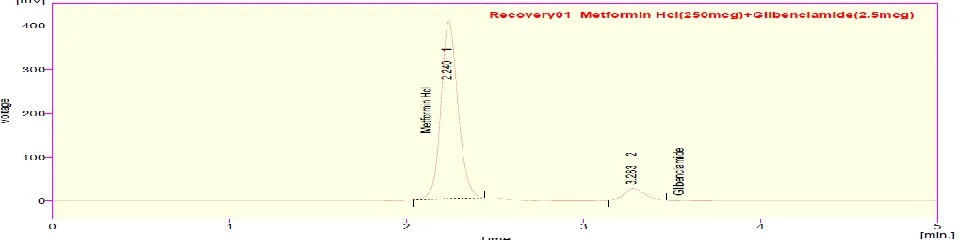
Figure 3.10.1 Chromatogram for Accuracy level
S. No Retention time( Rt ) Area
1 3.413 222.354
2 3.303 221.339
3 3.26 218.775
AVG 3.325 220.822
STDEV 0.056 2.599
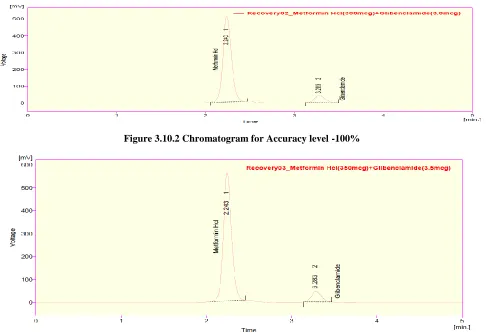
Figure 3.10.2 Chromatogram for Accuracy level -100%
Figure 3.10.3 Chromatograms for Accuracy level -150%
Table 3.10.1 Standard area of Metformin HCl
Conc(µg/ml) Peak Area
150 1598.165
200 2141.807
250 2777.099
300 3218.275
350 3680.663
Table 3.10.2 accuracy study of Metformin HCl
Conc (µg/ml) Peak Area
1.5 109.89
2 167.979
2.5 233.116
3 308.562
Table 3.10.3 standard area of Glibenclamide
Pure Drug Conc (µg/ml)
Formulation Conc(µg/ml)
%Recovery of pure drug area Average of area results
50% 250 200 100.49% 2708.906 2690.426 251.23
50% 250 200 2683.091
50% 250 200 2679.282
100% 300 250
100.83%
3323.625
3360.118 302.48
100% 300 250 3401.711
100% 300 250 3355.017
150% 350 300
98.75%
3692.432
3707.607 345.41
150% 350 300 3685.647
150% 350 300 3744.607
Table 3.10.4 Accuracy of Glibenclamide
PureDrug
Conc (µg/ml) Formulation Conc(µg/ml)
% Recovery of pure drug Area Average of area Results mcg
50% 2.7 2.5
100.90% 214.43
211.861 2.52
50% 2.7 2.5
21.312
50% 2.7 2.5 208.861
100% 3.2 3.0
98.63%
278.133
275.917 2.96
100% 3.2 3,0 273.698
100% 3.2 3.0 275.921
150% 3.7 3.5
98.57%
379.477
367.629 3.57
150% 3,7 3.5 361.001
150% 3.7 3.5 362.629
Pure Drug
Conc (µg/ml) Formulation Conc(µg/ml)
% Recovery of pure drug Area Average of area
Results mcg
50% 2.7 2.5
100.90% 214.43 211.861
2.52
50% 2.7 2.5
21.312
50% 2.7 2.5 208.861
100% 3.2 3.0
98.63%
278.133 275.917
2.96
100% 3.2 3,0 273.698
100% 3.2 3.0 275.921
150% 3.7 3.5
98.57%
379.477
367.629 3.57
150% 3,7 3.5 361.001
150% 3.7 3.5 362.629
Limit of Detection and Limit of Quantitation
The limit of detection and limit of quantitation of the present method were established based on
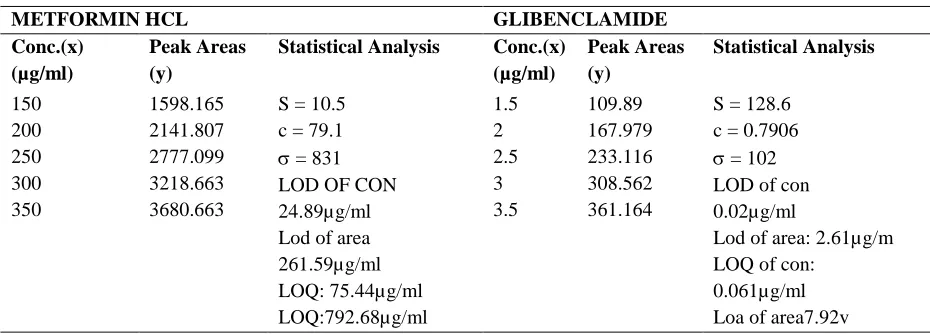
Table 3.11.1 LOD and LOQ Data of Metformin Hcl and Glibenclamide
METFORMIN HCL GLIBENCLAMIDE
Conc.(x) (µg/ml)
Peak Areas (y)
Statistical Analysis Conc.(x) (µg/ml)
Peak Areas (y)
Statistical Analysis
150 1598.165 S = 10.5
c = 79.1
= 831 LOD OF CON 24.89µg/ml Lod of area 261.59µg/ml LOQ: 75.44µg/ml LOQ:792.68µg/ml
1.5 109.89 S = 128.6
c = 0.7906
= 102
LOD of con 0.02µg/ml
Lod of area: 2.61µg/m LOQ of con:
0.061µg/ml Loa of area7.92v
200 2141.807 2 167.979
250 2777.099 2.5 233.116
300 3218.663 3 308.562
350 3680.663 3.5 361.164
The lowest possible concentrations of Metformin HCl and Glibenclamide that can be detected by the present method were found to be 62.834µg/ml and 0.18.638µg/ml respectively and that can be Quantitated were found to be 190.409µg/ml and 56.4813µg/ml respectively.
Robustness
The robustness of an analytical method is a measure of its capacity to remain unaffected by small but deliberate variations in method parameters and provides an indication of its reliability during normal usage. Robustness was done by changing the mobile phase (±1ml), flow rate (±1%), changing the wavelength (±5nm). All the system suitability parameters must be met as per the method.
Procedure
The standard solution was prepared as per the proposed assay method and was injected into HPLC system by changing chromatographic conditions. The actual mobile phase ratio (75:25) and the standard solution was injected and also injected at 74:26 and 76:24. The retention time and peak area of chromatograms was measured and %RSD was calculated. The actual flow rate was 1ml/min and the standard solution was injected and also injected at flow rate 0.9ml/min and 1.1ml/min. The retention time and peak area of chromatograms was measured and %RSD was calculated. The actual wavelength was 256nm and the standard solution was injected and also injected at wavelength 249nm and 259nm.The retention time and peak area of chromatograms was measured and %RSD was calculated [13].
Figure 3.12.2 Robustness (1.2ml) Metformin HCl & Glibenclamide
Figure 3.12.3 Robustness (208nm) Metformin HCl & Glibenclamide
Figure 3.12.4 Robustness (212nm) Metformin HCl & Glibenclamide
Table 3.12.1 Robustness Peak results for Metformin HCl
S.No. Parameter Condition Rt System suitability results
Peak Area USP tailing USP Plate Count
1 Flow rate by ± 1% 0.8ml 2.80 3367.409 1.281 28554
1.2ml 1.87 2256.523 1.167 24002
2 Wavelength of analysis ± 5nm 208nm 2.233 2711.187 1.227 25878
Table 3.12.2 Robustness Peak results for Glibenclamide S. No. Parameter
Condition
Rt System suitability results
Peak Area USP tailing USP Plate Count
1 Flow rate by ± 1% 0.8 ml 4.107 261.38 1.324 38066
1.2 ml 2.743 186.11 1.241 32466
2 Wavelength of analysis ± 5nm 208nm 3.270 209.94 1.258 36922
212nm 3.280 216.09 1.290 35267
Ruggedness
Ruggedness is a measure of reproducibility of test results under the variation in conditions normally expected from laboratory to laboratory, from column to column and from analyst to analyst. All the system suitability parameters should be met as per the method.
Procedure
The sample solution was prepared as per the proposed assay method and injected into HPLC
system. The same solution was injected into same HPLC system using another column to check column variability. The same solution was injected into another system to check system variability. The sample solution was prepared by another analyst as per assay method and injected into first HPLC system to check analyst variability. The retention time and peak area of all chromatograms was measured, %assay and RSD was calculated [13].
Figure: 3.13.1 Sample (01) Metformin HCl and Glibenclamide for Ruggedness
Figure: 3.13.3 Sample 02 Metformin HCl & Glibenclamide for Ruggedness
Table: 3.13.1 Sample & Standard Chromatogram values of Metformin HCl for Ruggedness
S.No.
Analyst-1 Analyst-2
Rt Area Rt Area
1 2.240 2713.213 2.240 2723.213 2 2.247 2725.243 2.247 2728.829 AVG 2.244 2719.228 2.244 2726.021
STD _ 14.367 _ 14.525
%RSD _ 0.526 _ 0.532
Figure: 3.13.4 Standard 02Metformin HCl and Glibenclamide for Ruggedness
Table. 3.13.2 Standard & Sample Chromatogram values of Glibenclamide for Ruggedness
S.No.
Analyst-1 Analyst-2
Rt Area Rt Area
1 3.283 214.437 3.303 215.430
2 3.289 217.491 3.301 218.496
AVG 3.286 215.964 3.203 216.963
STD _ 3.307 _ 3.321 %RSD _ 1.51 _ 1.50
Estimation of Stability of Drug Solutions
Stability was estimated with standard (at 100% level) and sample solutions. The standard and sample solutions were injected after their preparation and the peak area values were recorded. After 24 hours, the solutions were prepared in the similar way and were injected thrice (in order to minimize errors) along with the solutions of the
initial day and the peak areas were recorded. The same procedure was repeated at an interval of 24 hours until there was a significant change (due to degradation) in the peak area values. The fresh solutions were prepared in order to eliminate the effect of the environmental conditions on the stability study [13].
Figure 3.14.1 Chromatogram Recorded at 48th hour
SUMMARY& CONCLUSION
The solubility of the drugs was determined. The scanning of drugs for wavelength in UV region was carried out and wavelength was selected by using UV-Visible detector for the measurement of active ingredients in the proposed method. In HPLC method, the conditions were optimized to obtain an adequate elution of compounds. Initially, various mobile phase compositions were tried to separate the titled ingredients. Mobile phase, column selection, wavelength selection was based on peak parameters (height, tailing factor, theoretical plates, capacity or symmetry factor) and run time. The mobile phase with pH 3.0 buffer, Methanol in isocratic program and a flow rate of 0.1 ml /min was used. The optimum wavelength for detection was 256nm and a run time of 20min.
The HPLC method used for the estimation of Metformin HCl and Glibenclamide from tablets was validated in terms of system suitability, accuracy, precision, linearity, filter validation, solution stability, robustness and ruggedness.
Hence the proposed method was found to be rapid, accurate, precise, specific, robust and economical. The mobile phase is simple to prepare and economical. The method shows non-interference of formulation excipients in the estimation. This method is also having an advantage that the retention time of both the drugs is below 4 min and both the drugs can be assayed with the short time. Thus the method is not time consuming and can be used in laboratories for the routine analysis of combination drugs.
REFERENCES
[1]. Bailey CJ, Day C. Metformin: its botanical background. Practical Diabetes International. 2004; 21 (3):115–7. [2]. Lord JM, Flight IHK, Norman RJ. Metformin in polycystic ovary syndrome: systematic review and
[3]. Aburuz S, Millership J, McElnay J,The development and validation of liquid chromatography method for the simultaneous determination of Metformin and Glipizide, Gliclazide, Glibenclamide or Glibenclamide in plasma.J Chromatogr B AnalytTechnol Biomed Life Sci, 817, 2007, 277-286.
[4]. Angelico F, Burattin M, Alessandri C, Del Ben M, Lirussi F. Drugs improving insulin resistance for non-alcoholic fatty liver disease and/or non-non-alcoholic steatohepatitis. Cochrane Database Syst Rev. 24(1), 2007. [5]. Socha P, Horvath A, Vajro P, Dziechciarz P, Dhawan A, Szajewska H. Pharmacological interventions for
nonalcoholic fatty liver disease in adults and in children: a systematic review. J Pediatr Gastroenterol Nutr. 48(5), 2009, 587–96.
[6]. Holman RR, Paul SK, Bethel MA, Matthews DR, Neil HA. 10-year follow-up of intensive glucose control in type 2 diabetes. N Engl J Med. 359(15), 2008, 1577–89.
[7]. Bolen S, Yeh HC, Cardiovascular outcomes in trials of oral diabetes medications: a systematic review. Arch Intern Med. 168(19), 2008, 2070–80.
[8]. Maharani U. Chapter 27: Diabetes Mellitus & Hypoglycemia. In: Papadakis MA, McPhee SJ. CURRENT
Medical Diagnosis and Treatment 2010. 49th ed. McGraw-Hill Medical. ISBN 0-07-162444-9, 2009, 1092–93.
[9]. Bolen S, Feldman L, Vassy J, et al. Systematic review: comparative effectiveness and safety of oral medications for type 2 diabetes mellitus. Ann Intern Med. 147(6), 2007, 386–99.
[10].Abdel-Hamid ME, Suleiman MS, el-Sayed YM, Najib NM, Hasan MM A rapid high performance liquid chromatography assay of Glibenclamide in serum. Journal of Clinical pharmaceutical theory. 14, 2009, 181-188.
[11].Rajendran SD, Philip BK, Gopinath R, Suresh B ,RPHPLC method for the estimation of Glibenclamide in human serum. Indian Journal of Pharmaceutical Science 69, 2007, 796- 799.
[12].Vasudevan M, Ravi J, Ravisankar S, Suresh Vasudevan B, Ion– pair liquid chromatography technique for the estimation of Metformin in its multicomponent dosage forms. Journal of Pharmaceutical Biomedical Analysis 25, 2001, 77-84.