IJPAR |Vol.7 | Issue 3 | July - Sep -2018 Journal Home page: www.ijpar.com
Research article Open Access
Quantitative LC-MS/MS method development and validation for the
estimation of neratinib: application to bioavailability study in healthy
rabbits
Lakshmi Kanth M *
1, Raj Kamal B
21
Research Scholar, Mewar University, Chittorgarh, Rajasthan, India.
2
Research Supervisor, Mewar University, Chittorgarh, Rajasthan, India.
*Corresponding Author: M. Lakshmi KanthEmail: [email protected]
ABSTRACT
A sensitive, simple and liquid chromatography – tandem mass spectrometry (LC- MS/MS) method was developed and validated for the fast quantification of Neratinib (NRTB) in human plasma. The developed method was successfully applied to bioavailability study in healthy rabbits. The analyte and Crizotinib (CZNB) internal standard (IS) were separated from 200 mL of plasma sample by opting the protein precipitation as an extraction method with methanol. Chromatographic resolution was resolved with phenominex C18(50mm×4.6 mm, 4 mm) analytical
nonpolar column and a mobile phase mixture of 10mM ammonium acetate, acetonitrile and methanol in the ratio of 20:30:50. Mobile phase flow from the column was fixed at 0.8 ml/min. The overall analysis time is promising compared to other reported procedures for Neratinib. From in vivo studies NRTB was shown Tmax of 6.05±0.027 and
mean Cmax, AUC0t andAUC0 for test formulation is 295.83±39.066, 856.70 ± 153.16 and 1652.447 ± 205.06
respectively. The developed and validated research method was successfully applied in bioavailability studies in healthy rabbits.
Keywords:
Neratinib, Anti-Cancer agent, LC-MS/MS, In-vivo bioavailability studies, Accuracy and Matrix effect.INTRODUCTION
Neratinib chemically designated as (2E) -N-[4- ({3-chloro-4-[(pyridin-2-yl) methoxy] phenyl} amino) -3- cyano-7-ethoxyquinolin-6-yl]-4-(dimethyl amino) but-2-enamide. NRTB is a tyrosine kinase inhibitor and is a drug of choice which exhibits anti-tumor action against Epidermal Growth Factor Receptor (EGFR), Human
Epidermal Growth Factor Receptor (HER) -2 and HER-4 positive carcinomas. NRTB binds to EGFR, HER2 and HER4 and irreversibly inhibits these receptors. This prevents auto-phosphorylation of tyrosine residues on the receptor and reduces oncogenic signaling through the mitogen-activated protein kinase and Akt pathways [1-4].
NRTB and its major active metabolites M3, M6 and M7 have a Tmax of 2-8hrs. Administration of the drug with a high fat meal will increases Cmax by
1.7-fold and the total exposure by 2.20-fold. On administration with standard meal will increases Cmax by 1.2-fold and total exposure by 1.1-fold.
Administration of NRTB with gastric acid reducers like proton pump inhibitors will decreases Cmax by
71% and total exposure by 65%. NRTB is mainly undergoes metabolism in body via CYP3A4. It is also metabolized by flavin-containing monooxygenase to a lesser extent. The systemic
exposures of Neratinib's active metabolites M3, M6, M7, and M11 are 15%, 33%, 22%, and 4%. The mean half-life of elimination ranges from 7-17 h following a single dose[5-8].
Literature survey on NRTB drug reveals that only few quantification methods for the analysis of Neratinib in dosage forms. The analytical methods such as LC-MS/MS [9-10] and spectroscopic [11] methods were reported methods. No method was reported on bioavailability studies on healthy rabbits with low retention time.
Figure-1: Structure of Neratinib
MATERIALS AND METHODS
Chemicals and reagents
Neratinib and Crizotinib (IS) were gift samples (reference standards) from MSN labs, Hyderabad, Telangana, India. HPLC grade acetonitrile (ACN) and Methanol were obtained from J.T.Baker, Hyderabad. Reagent grade ammonium acetate was procured from Merk Pvt. Ltd., Mumbai, India. Water used for the total analysis work was collected from water purification systems (Milli-Q) installed in the laboratory. The animal studies on healthy rabbits was approved by Institutional Ethical committee no:VCP/IAEC/2016-49.
Instrumentation
The Shimadzu LC- 20ADvp (Shimadzu, Japan) HPLC system with an auto sampler was coupled with Applied Biosystem-Sciex API-4000 Tandem-mass spectrometer. Shimadzu LC-20AD, Japan module used for the solvent delivery system. All the chromatographic data was integrated by Analyst software (version: 1.4.2: Applied Biosystems).
Standard
stock,
quality
control
and
calibration standard samples preparation
Liquid chromatographic conditions
Chromatographic separation was achieved on a RP- phenominex C18 (50mm×4.6mm, 4mm) with
10mM ammonium acetate, ACN and methanol in the ratio of 20:30:50 as a mobile phase. Chromatograms were resolved by an isocratic elution with a flow rate of 0.80 ml/min at 400C. NRTB and CZNB were eluted in the total run time of 2.0 minutes. Column oven temperature and auto sampler temperature was set to 40°C and 5°C respectively.
Mass instrument conditions
Mass instrument parameters were optimized as nebulizer gas 25 psi(nitrogen); source temperature 6000C; curtain gas 30psi (Nitrogen); heater gas 35 psi (Nitrogen); CAD gas 8(Nitrogen); ionspray(IS) voltage 5000V; entrance potential 12V; source flow rate 0.6mL/min without split; declustering potential l50V and collision energy(CE) 15V for both the NRTB and IS, dwell time 200 ms and collision cell exit potential-13V the for the NRTB and collision cell exit potential-12 V for IS. A Turbo ion spray interface (TIS) operated in positive ionization mode was used for the quantitative detection. Parent and product ion detection were carried out in the multiple-reaction monitoring mode (MRM), by monitoring the transition pairs of m transitions of m/z 557/512 for NRTB and 450/260 for CZNB.
In vivo bioavailability studies
Six Male healthy Rabbits weighing about 2.5 to 3 kg were selected for the pharmacokinetic study. Twelve hours before the drug administration, food was withdrawn from the rabbits until 24 hr post-dosing, while, water was available for rabbits throughout the study. The 1.3mg/kg were administered to rabbits. 0.6 mL of blood samples were collected from marginal ear vein of rabbits before dosing (zero time) at the time intervals of 0.15, 0.50, 0.75, 1.00, 1.50, 2.00, 2.50, 3.50, 6.00 and 12.00 hours. Resulting solution was subjected to centrifugation at 4500 rpm for 15 min and separated plasma was transferred into labelled polypropylene tubes at -200C. The protocol of animal study was approved by the institutional
animal ethics committee (IAEC NO:
P62/VCP/IAEC/2017/10/DBP/AE12/Rabbits).
Sample Preparation Method
To 400µl of plasma, 100µl of Crizotinib (1µg/ml) was added and vortexed. To the sample 400 µl methanol was added followed by centrifugation at 3000 rpm/min on a cooling centrifuge for 15-20 min at 50c. The organic portion was dried in lyophiliser and to the residue 250µl of mobile phase was added and transfer appropriate volume of samples into pre-labeled Auto sampler vials, and inject into LC-ESI-MS/MS system.
Validation
The quantitative analysis of Neratinib in plasma was fully validated according to the Guideline on Bioanalytical Method Validation in Pharmaceutical Development in Japan by testing accuracy, precision, linearity, range and selectivity, lower limit of quantification (LLOQ), recovery, and matrix effect [12-14].
Pharmacokinetic Study
The pharmacokinetic parameters were calculated using Single dosage by PK- Solver tool from the data of plasma drug concentration - time data by non-compartmental statistical method. The Cmax (maximum plasma concentration) and Tmax
(time to maximum plasma concentration) were obtained directly from the observed concentration-time profiles. Linear trapezoidal method was applied to determine the AUC0-t. The AUC0-∞ was
estimated up to the last measurable concentration and the terminal elimination rate constant (Ke). The Ke value was determined from the slope of the terminal exponential phase of the plasma of the linear regression method, The terminal elimination half-life (t1/2), was then calculated as 0.693/Ke 15.
RESULTS AND DISCUSSION
Results of method validation
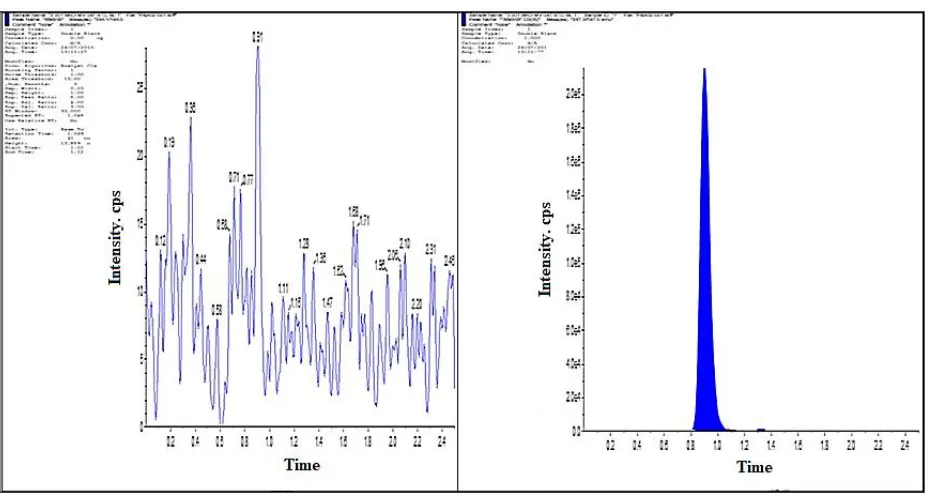
Fig 2: Chromatogram of blank plasma sample
Fig 4: Plasma spiked with NRTB at LLOQ and IS
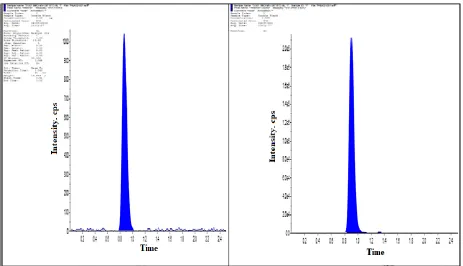
Fig 5: Representative chromatogram of extracted rabbit plasma sample
Linearity
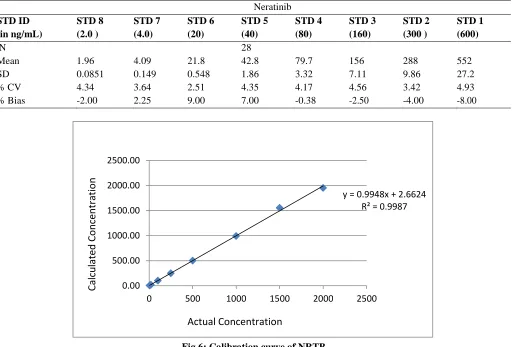
Linearity of the method was performed by plotting the calibration curve between spiked concentrations versus peak area ratios of Neratinib to CZNB and the best fit line was calculated.
be y = 0.994x + 2.662 and with coefficient of correction (r2) = 0.998. The precision (%CV)
observed for the calibration curve standards was found to be ≤ 3.73 for Neratinib (Table 1).
Table 1: Linearity standards of Neratinib Neratinib STD ID (in ng/mL) STD 8 (2.0 ) STD 7 (4.0) STD 6 (20) STD 5 (40) STD 4 (80) STD 3 (160) STD 2 (300 ) STD 1 (600)
N 28
Mean 1.96 4.09 21.8 42.8 79.7 156 288 552
SD 0.0851 0.149 0.548 1.86 3.32 7.11 9.86 27.2
% CV 4.34 3.64 2.51 4.35 4.17 4.56 3.42 4.93
% Bias -2.00 2.25 9.00 7.00 -0.38 -2.50 -4.00 -8.00
Fig 6: Calibration curve of NRTB
Recovery
Recovery studies were performed by comparing the peak response of the NRTB (extracting the sample with protein precipitation with methanol) with peak response of control level NRTB. The
percentage mean recoveries for Neratinib in HQC (480 ng/ml), MQC (240 ng/ml) and LQC(4 ng/ml) were 110.7%, 112.1% and 109.5% respectively. (Table-2).
Table 2: Percentage mean recovery of NRTB Replicate
no.
HQC MQC LQC
Extracted Peak Area Ratio Un-extracted Peak Area Ratio Extracted Peak Area Ratio Un-extracted Peak Area Ratio Extracted Peak Area Ratio Un-extracted Peak Area Ratio
1 2.176 2.160 1.133 1.118 0.027 0.027
2 2.176 2.135 1.110 1.103 0.029 0.029
3 2.186 2.119 1.111 1.115 0.032 0.033
4 2.118 2.211 1.122 1.113 0.031 0.030
5 2.127 2.140 1.090 1.086 0.027 0.027
y = 0.9948x + 2.6624 R² = 0.9987
0.00 500.00 1000.00 1500.00 2000.00 2500.00
0 500 1000 1500 2000 2500
Mean 2.1566 2.1530 1.1132 1.1070 0.0292 0.0292
SD 0.03156 0.03557 0.01599 0.01302 0.00228 0.00249
% CV 1.46 1.65 1.44 1.18 7.81 8.53
% Mean Recovery
110.7 112.1 109.5
% Overall Recovery
112.8
% Overall CV
0.3
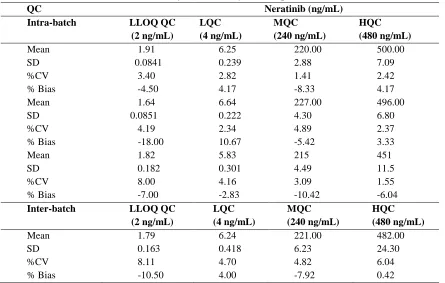
Intraday and Inter-day Precision
Precision and accuracy were analyzed in the form of intraday and interday. Intraday precision and accuracy was analyzed by infusing QC standards (4, 240 and 480ng/ml) and LLOQ (2ng/ml) in five replicates a day randomly. Inter-day precision and accuracy was estimated from the analysis of each quality control standards (4, 240 and 480 ng/ml) and LLOQ Quality Control standards (2.0ng/ml) once on each of 5 different days. The within and between batch %CV s for
low, medium and high concentrations should be within 15% except LLOQ QC for which the %CV should not exceed by more than 20%. The intraday and inter-day precision of the analytical method was determined by observing the %CV values. The obtained values were found between 1.31 - 10% for the QC samples (2, 4, 240 and 480ng/ml). All the values were within the acceptance limits of precision (15%). The results were tabulated in the Table 3.
Table 3: Intra-day and inter-day QC-samples for NRTB
QC Neratinib (ng/mL)
Intra-batch LLOQ QC
(2 ng/mL)
LQC (4 ng/mL)
MQC (240 ng/mL)
HQC (480 ng/mL)
Mean 1.91 6.25 220.00 500.00
SD 0.0841 0.239 2.88 7.09
%CV 3.40 2.82 1.41 2.42
% Bias -4.50 4.17 -8.33 4.17
Mean 1.64 6.64 227.00 496.00
SD 0.0851 0.222 4.30 6.80
%CV 4.19 2.34 4.89 2.37
% Bias -18.00 10.67 -5.42 3.33
Mean 1.82 5.83 215 451
SD 0.182 0.301 4.49 11.5
%CV 8.00 4.16 3.09 1.55
% Bias -7.00 -2.83 -10.42 -6.04
Inter-batch LLOQ QC
(2 ng/mL)
LQC (4 ng/mL)
MQC (240 ng/mL)
HQC (480 ng/mL)
Mean 1.79 6.24 221.00 482.00
SD 0.163 0.418 6.23 24.30
%CV 8.11 4.70 4.82 6.04
% Bias -10.50 4.00 -7.92 0.42
Matrix effect
Six blank plasma samples of six different lots were extracted in triplicate and spiked at LQC, HQC level and finally compared with same concentrations in the alternate infusions. The % CV
Table 4: Matrix effect with six different plasma lots
QC ID LQC HQC
Actual conc. 4 (ng/mL) (area ratio) 480 (ng/mL) (area ratio)
1 0.027 1.689
2 0.029 1.758
3 0.027 1.645
4 0.029 1.863
5 0.031 1.863
6 0.028 1.869
Mean 0.0245 1.877
3
± SD 0.00215 0.035
4
% CV 5.56 1.89
Carry-Over
Carry-over was analyzed by estimating a blank sample following the highest calibration standard concentration in 6 replicates. The peak response of blank sample obtained after the HQC should not be > 20% of the drug response of the LLOQ and also not be > 5% of the response of CZNB. Carry-over was considered acceptable.
Specificity
A 5.0ng/ml solution was infused into the column under optimized HPLC chromatographic conditions to show the clear separation of Neratinib from endogenous impurities and other impurities of plasma. The specificity of the method was checked for the interference from plasma. The peak area of interference peak should be <20% from the peak area of LLOQ and should be <5% from the mean IS
peak area. The concentration of LLOQ should not deviate >20% from nominal concentration (NC).
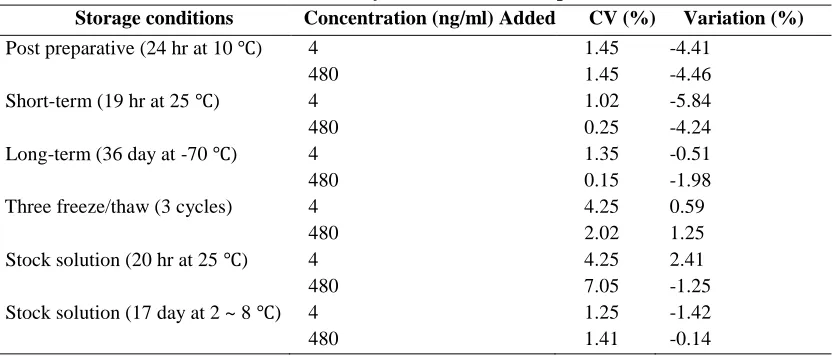
Stability studies
Stability studies were performed at different conditions according to the FDA guideline. The stability conditions were post preparative (24 hr at 10 ℃), Short-term (19 hr at 25 ℃), Long-term (36 day at -70 ℃), Stock solution stability and freeze/thaw (3 cycles) stability conditions. The stability studies results were shown that there was no significant degradation of NRTB occurred during the chromatographic technique, extraction and also sample storage of NRTB plasma samples at different storage conditions. Stability data were shown in the table 5.
Table 5. Stability of NRTB in human plasma
Storage conditions Concentration (ng/ml) Added CV (%) Variation (%)
Post preparative (24 hr at 10 ℃) 4 480
1.45 1.45
-4.41 -4.46 Short-term (19 hr at 25 ℃) 4
480
1.02 0.25
-5.84 -4.24 Long-term (36 day at -70 ℃) 4
480
1.35 0.15
-0.51 -1.98 Three freeze/thaw (3 cycles) 4
480
4.25 2.02
0.59 1.25 Stock solution (20 hr at 25 ℃) 4
480
4.25 7.05
2.41 -1.25 Stock solution (17 day at 2 ~ 8 ℃) 4
480
1.25 1.41
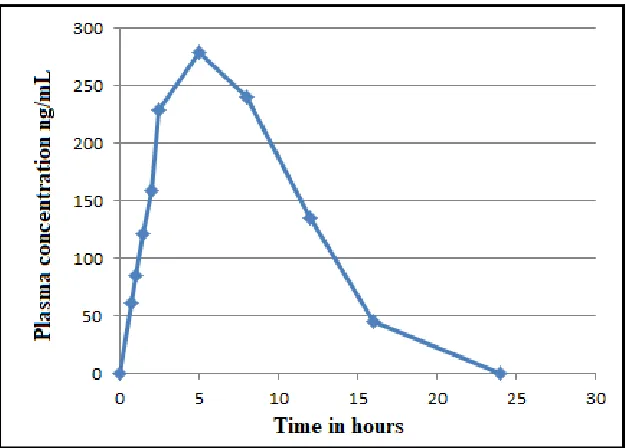
Pharmacokinetic studies
The validated research method was used in the analysis of NRTB in the plasma samples to study pharmacokinetics of single oral dose of 300 μg/1.8kg body weight (equivalent to 4mg capsule) in six healthy rabbits. Graph was plotted by taking plasma concentration of NRTB on Y-axis and time
on X-axis, the data was shown in figure 6. This graph was plotted by considering the data between 0 to 24 hours. NRTB shown Tmax of 6.05±0.027 and
mean Cmax, AUC0t and AUC0 for Test
formulation is 295.83±39.066, 856.70 ± 153.16 and 1652.447 ± 205.06 respectively. The results were presented in Table 5 and Table 6.
Table 5: Calculated concentrations of plasma in rabbits at different time intervals Calculated concentrations (ng/ml)
Time points (hours)
R- 1 R- 2 R- 3 R- 4 R- 5 R- 6 Avg SD
0 0 0 0 0 0 0 0 0
0.75 48 64 71 33 65 86 61.17 18.45
1.0 67 89 98 59 84 111 84.67 19.29
1.5 95 122 144 109 112 144 121.00 19.80
2 138 165 183 123 155 187 158.50 25.09
2.5 227 234 251 161 244 256 228.83 34.90
5 284 277 298 214 301 299 278.83 33.16
8 168 321 198 228 185 343 240.50 73.87
12 106 146 154 111 123 168 134.67 25.03
16 29 48 62 18 46 70 45.50 19.53
24 0 0 0 0 0 0 0 0
Where R indicates Rabbit
Table 6: Calculated mean values of PK parameters for test animals
Parameter Unit Avg value
(n=6)
SD
Lambda_z 1/h 0.48731 0.13558
t1/2 H 3.00741 0.37908
Tmax H 6.05 0.27386
Cmax ng/ml 295.833 39.0662
Tlag h 0 0
Clast_obs/Cmax 0.14926 0.05223
AUC 0-t ng/ml*h 856.706 153.167
AUC 0-inf_obs ng/ml*h 1652.447 205.069
AUC 0-t/0-inf_obs 0.89669 0.04644
AUMC 0-inf_obs ng/ml*h^2 3053.83 936.775
MRT 0-inf_obs h 3.11926 0.36743
Vz/F_obs (mg)/(ng/ml) 0.00296 0.00055
Cl/F_obs (mg)/(ng/ml)/h 0.00141 0.00031
CONCLUSION
The present research method has been developed and validated using CZNB as IS in the human plasma. The drug concentration is directly proportional to the peak response in the concentration range of 5 - 2000 ng/mL. The selectivity, precision, sensitivity and accuracy found with this method make it suitable for the routine analysis of NRTB in the laboratories. This method is vety easy and fast to preform analysis
when compare with existed method.
Chromatographic separation was achieved on a RP- phenominex C18 (50mm×4.6mm, 4mm) with 10mM
ammonium acetate, ACN and methanol in the ratio of 20:30:50 as a mobile phase. Chromatograms were resolved by an isocratic elution with a flow rate of 0.80 ml/min at 400C. The overall analysis time is promising compared to other reported procedures for Neratinib. The developed and validated research method was successfully applied in bioavailability studies in healthy rabbits. NRTB shown Tmax of 6.05±0.027 and mean Cmax, AUC0t
and AUC0 for Test formulation is
295.83±39.066, 856.70 ± 153.16 and 1652.447 ± 205.06 respectively.
REFERENCES
[1]. Neratinib. AdisInsight. Retrieved 22, 2017.
[2]. Definition of neratinib - National Cancer Institute Drug Dictionary. Retrieved 2008, 12-01.
[3]. Neratinib tablets label (PDF). FDA. July 2017. Retrieved 6 February2018. For label updates see, FDA index page for NDA 208051
[4]. Gandhi L, et al. MA04.02 Neratinib ± Temsirolimus in HER2-mutant lung cancers: an international, randomized phase II study. Journal of Thoracic Oncology, 12(1), 2016, S358–9.
[5]. Baselga J, Coleman RE, Cortés J, Janni W. "Advances in the management of HER2-positive early breast cancer". Critical reviews in oncology/hematology. 119, 2017, 113- 122.
[6]. Minami Y, Shimamura T, Shah K, et al.. "The major lung cancer-derived mutants of ERBB2 are oncogenic and are associated with sensitivity to the irreversible EGFR/ERBB2 inhibitor HKI-272". Oncogene. 26(34), 2007, 5023-7.
[7]. Singh, J; Petter, RC; Baillie, TA; Whitty, A. "The resurgence of covalent drugs". Nature Reviews. Drug Discovery. 10(4), 2011, 307-17.
[9]. TA Wani et al. Ultra Performance Liquid Chromatography Tandem Mass Spectrometric Method Development and Validation for Determination of Neratinib in Human Plasma. South African Journal of Chemistry, 68, 2015. [10]. Brian Kiesel et al. LC-MS/MS assay for the quantitation of the tyrosine kinase inhibitor neratinib in human
plasma. Journal of pharmaceutical and biomedical analysis, 134, 2017, 130–136.
[11]. H.M. Maher et al. An eco-friendly direct spectrofluorimetric method for the determination of irreversible tyrosine kinase inhibitors, neratinib and pelitinib: application to stability studies. Luminescence, 32, 2017, 149– 158.
[12]. ICH guidelines for validation of analytical procedures: text and methodology. Q2(R1) ICH, Geneva; 2005, 1-14.
[13]. US Food and Drug Administration, Center for Drug Evaluation and Research (CDER). Guidance for industry, Bioanalytical Method Validation. 2001. http://www.fda.gov/ downloads/ Drugs/ Guidances/ucm070107.pdf. [14]. European Medicines Agency, Guideline on bioanalytical method validation. 2011.
http://www.ema.europa.eu/docs/en_GB/document_library/Scientific_guideline/2011/08/WC500109686.pdf. [15]. Shashidhar Reddy D and Prakash Rao2 and Devaraj VC. A Highly Sensitive LC-Ms/Ms Method for