66
International Journal of Advances in Engineering Research
TEST TO FAILURE STUDY OF PHOTOVOLTAIC
MODULE USING EL TECHNIQUE
Saurabh Kumar1,Gaurav Kumar2
1CMJ University,Shillong, India, 2N.I.T, Kurukshetra, India
ABSTRACT
Now a days, reliability of Solar Panels has become main concern for the Module Manufactures. To understand the effect of severe atmospheric conditions on PV Modules, we have done the study of effect of Accelerated Environmental Tests on PV modules Environmental test is a series of accelerated tests that simulates outdoor test conditions and helps in estimating module lifetime, determining failure rates and identifying failure mechanisms. Electroluminescence (EL) is an imaging technique used to determine C-Si cell level defects (such as micro cracks and regions of low diffusion length). Under rigorous climatic conditions, the module power degrades. Using EL technique, a correlation between module power degradation post environmental tests and defects observed in cells can be established. This study will help in analyzing the possible cell level defects that can occur in outdoor conditions and lead to power degradation.
INTRODUCTION
To improve the reliability and thus lifetime of modules, it is extremely critical to analyze the effects of environment on the performance of modules and understand the exact causes of module degradation. Electroluminescence (EL) imaging is fast becoming an important non-destructive technique to diagnose the cell level defects in the module. It has been shown by Fuyunki et al that the electroluminescence intensity of multi- Si cell under forward bias is directly proportional to the minority carrier diffusion length [1]. Hence a dark areain an EL image signifies an electrically inactive area. EL test generates a defect map of each cell of the module which can be used to evaluate the degradation of cells.
EXPERIMENTAL
Electroluminescence (EL) set-up
67
International Journal of Advances in Engineering Research
below ambient and has a resolution of 3300 x 2500 pixels. The data acquisition time is in the range of 1.5 to 2.5 seconds. The experimental set-up is illustrated in figure 1Fig.1: EL Experimental Set up.
Environmental Tests
Damp Heat Test
• Two modules subjected to damp heat test.
• Both modules tested up to 3000 hrs of damp heat and characterized (light IV, insulation, visual & EL) after each batch of 1000 hrs.
Thermal Cycle Test
Three Modules were subjected to TC test
The Modules have been tested up to 600 TC cycles.
EL Data at EL machine & IV data at Sun Simulator have been recorded up to TC600.
68
International Journal of Advances in Engineering Research
Fig.2: Experimental approach of Test to Failure Study
RESULTS
Damp Heat Test Electrical Parameters
• Up to DH2000, no appreciable change (less than 1%) in power observed.
• From 2000 to 3000 hrs, power degraded rapidly and substantial power loss (more than 4%) observed in both the samples.
• Power degraded rapidly thereafter and crossed failure mark (more than 20% degradation) after 3300 hrs.
• No appreciable change in Isc. FF reduction is mainly contributing to loss in power. The Trend of change of Electrical Parameters is shown in figure 3.
69
International Journal of Advances in Engineering Research
Back sheet cracking
• Leaching out of plasticizers liquid additives in prolonged exposure to hot-humid conditions.
• Development of small pores in back sheet leading to moisture penetration into internal layers. Moisture causing hydrolysis (degradation) of PET layer and penetrating inside module active area.
Cell Degradation
• Moisture ingress resulting in chemical reaction between cell contacts (front or back) and additives in encapsulant leading to ribbon & interconnect detachment and BSF layer degradation.
• Cell matrix tape is aggravating the reaction leading to more degradation. • Degradation leading to increase in series resistance.
EL Inspection:
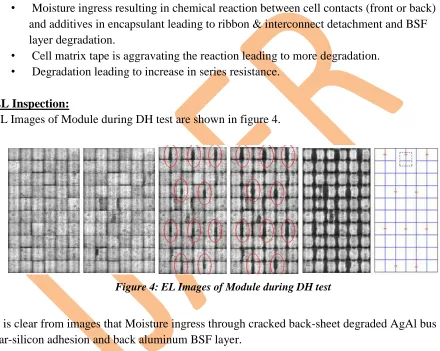
EL Images of Module during DH test are shown in figure 4.
Figure 4: EL Images of Module during DH test
It is clear from images that Moisture ingress through cracked back-sheet degraded AgAl bus bar-silicon adhesion and back aluminum BSF layer.
Thermal Cycle Test Electrical parameter
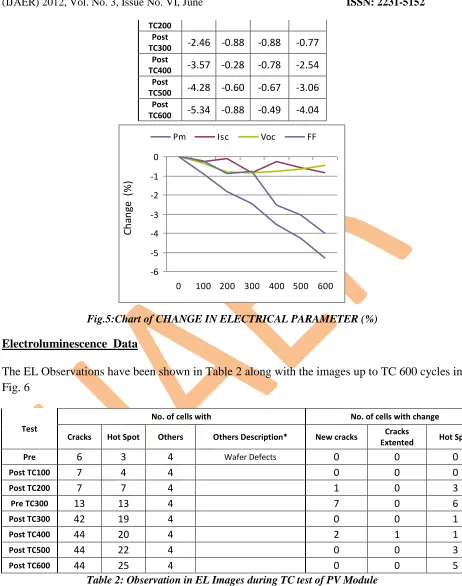
Change in electrical Parameters is shown in Table 1 and the graphic chart has been shown in figure.5
Table.1: Change in electrical Parameters during Thermal Cycle Test
TEST Pm Isc Voc FF
Pre Test 0 0 0 0
Post
70
International Journal of Advances in Engineering Research
TC200 Post
TC300 -2.46 -0.88 -0.88 -0.77 Post
TC400 -3.57 -0.28 -0.78 -2.54 Post
TC500 -4.28 -0.60 -0.67 -3.06 Post
TC600 -5.34 -0.88 -0.49 -4.04
-6 -5 -4 -3 -2 -1 0
0 100 200 300 400 500 600
Pm Isc Voc FF
C h an ge ( % )
Fig.5:Chart of CHANGE IN ELECTRICAL PARAMETER (%)
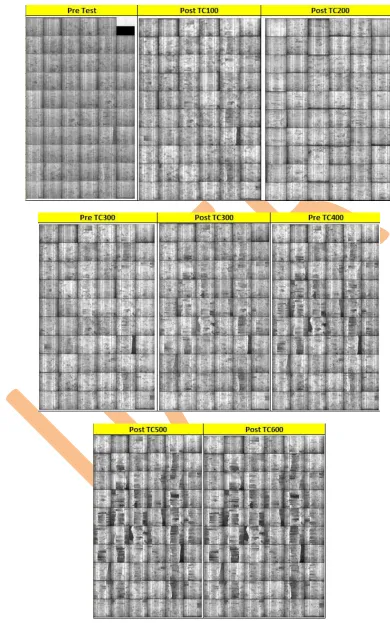
Electroluminescence Data
The EL Observations have been shown in Table 2 along with the images up to TC 600 cycles in Fig. 6
Test
No. of cells with No. of cells with change
Cracks Hot Spot Others Others Description* New cracks Cracks
Extented Hot Spot
Pre 6 3 4 Wafer Defects 0 0 0
Post TC100 7 4 4 0 0 0
Post TC200 7 7 4 1 0 3
Pre TC300 13 13 4 7 0 6
Post TC300 42 19 4 0 0 1
Post TC400 44 20 4 2 1 1
Post TC500 44 22 4 0 0 3
Post TC600 44 25 4 0 0 5
71
International Journal of Advances in Engineering Research
72
International Journal of Advances in Engineering Research
Observations:
Post TC300, large no. of visual defects (cracks and hot spots) observed but that didn't lead to substantial power loss.
Nearly constant degradation in power observed after each batch of 100 thermal cycles. Micro cracks and other defects do not seen to be substantially affecting module's performance.
Power degradation is mainly driven by loss in fill factor.
Power loss crossed 5% mark post TC600.
CONCLUSION
At the end of TC 600 & DH 3300 Test we have concluded that Damp heat test didn’t lead to appreciable power loss. The PV Panel resulted in less than 1% power loss post DH2000 test, which is more or less negligible. Also, the test didn’t lead to many change in cell defects. This implies that DH1000 test doesn’t put any kind of stresses on the module. This makes sense as there are no variations in environmental conditions during DH1000 test and thus there is no scope of any kind of physical stresses on the module.
In case of Thermal Cycle test, till TC200 test, a constant reduction in power has been observed at regular intevals in all the samples subjected to thermal cycling test. However, very little change in cell level defects (micro-cracks) observed. Thus, changes in cell micro-cracks do not seem to contributing much in power degradation. The major factor is the increase in series resistance which could be due to degradation of metal-semiconductor bond. Post TC250, reasonable reduction in power observed mainly in sample 1 and 2 both of which developed large no. of micro cracks and other defects . However, majority of these defects are caused by improper handling rather than by stresses developed during the test. This is quite serious issue and affects the project a lot. Thus some solution or method needs to be developed to stop such undesirable conditions.
REFERENCES
[1] P. Grunow et al. “Electroluminescence as diagnostictool for PV modules” Symposium
Photovoltaische Solarenergie, Kloster Banz, Staffelstein (2007)
[2] Paul Grunow et al. “Influence of micro cracks in multi-crystalline silicon solar cells on the