Topological Parameter Based QSAR Study of Anti HIV
Mannitol Derivatives: A Theoretical Formulation
A. K. R. Khan1, Richa Mishra1 and Krishna Srivastava2
1Department of Chemistry,
Shri Ramswaroop Memorial Group of Professional Colleges Lucknow, U. P., INDIA.
2Department of Chemistry,
Shri Ramswaroop Memorial University, Lucknow, U. P., INDIA. email:[email protected], [email protected]
(Received on: August 8, Accepted: August 11, 2017)
ABSTRACT
In this article, a Quantitative structure Activity Relationships (QSAR) for thirty five derivatives of anti-HIV protease inhibitor mannitol is presented. These derivatives are divided into training and testing set. This study is mainly based on topological parameter among which five parameters have been used in training compounds, which provide better results. The calculation of parameters were performed by CAChe pro software using Project leader and the quality of the predictions will be adjudged by correlation coefficient and cross validation coefficient and other statistical parameters.
rCV2=0.333271 r2=0.540097 SE=0.2175 SEE=0.2950 t=4.5973 p=0.0001
This study clearly indicates that there is direct relation between molar refractivity, molecular polarizibility and observed activity. So we have used molar refractivity and molecular polarizibility on testing set of compounds. The best model is rCV2=0.435809 r2=0.57997 SE=0.2085 SEE=0.2585 t=4.793 p=0.0001 and
these two parameter give direct relationship with observed activities as in training set of compounds. On the basis of this study it is indicated that molar refractivity and molecular polarizability are best descriptors for estimating required activity on a series of anti-HIV protease inhibitor mannitol derivatives.
Keywords: QSAR, Mannitol, Molecular polarzibility, Molar refractivity.
INTRODUCTION
immune system making people with AIDS much more likely to get infections, including opportunistic infections and tumors that do not affect people with working immune systems. This susceptibility gets worse as the disease continues.
AIDS is the ultimate clinical consequence of infection with HIV, which is a retrovirus that primarily infects vital organs of the human immune system such as CD4+ T cells (a subset of T cells), macrophages and dendritic cells. It directly and indirectly destroys CD4+ T cells4. Acquired immune deficiency syndrome is most fatal disorder for which no complete and successful chemotherapy has been developed so far. Recently, QSAR has gained importance in the field of pharmacological sciences5. Quantitative structures Activity Relationships (QSAR) are predictive tools for a preliminary evaluation of the activity of chemical compounds by using computer-aided models. The Hohenberg and Khon theorm based DFT6-8 provide a major boost to the computational chemistry. The performance of DFT method in description of structural, energetic and magnetic molecular properties has been reviewed quite substantially in recent time. DFT methods are in general capable of generating a variety of isolated molecular properties9-13. QSAR techniques increase the probability of success and reduce time and cost involvement in drug discovery process14-15. In this article, a Quantitative structure Activity Relationships (QSAR) for thirty five derivatives of anti-HIV protease inhibitor mannitol16 is presented which are further divided into two set training and testing set. This study is mainly based on topological parameter and the quality of the predictions will be adjudged by correlation coefficient and cross validation coefficient and other statistical parameters. The parameters or the combination of parameter providing the best result will be recognized and employed for prediction purpose. This will be helpful in predicting the activity of any new derivative of required activity.
EXPERIMENTAL
We have based our QSAR study on a series of anti-HIV protease inhibitor mannitol derivatives on the following reactivity indices (topological parameter):
1. Log P
2. Shape Index Order II
3. Solvent Accessible surface Area 4. Molecular Polarizibility
5. Molar Refractivity
The evaluation of these parameters is given as below:
Water/Octanol Partition coefficient (Log P) (17)
ion wat. un
octanol oct./wat
solute
solute
log
logp
(1)Kier's shape indices: { n (n = 2)}[18-21]
These indices compare the molecule graph with "minimal" and "maximal" graphs, where the meaning of "minimal" and "maximal" depends on the order n. This is intended to capture different aspects of the molecular shape.
Order 2:
The descriptor 2 encodes the branching. P, Pmin, and Pmax now denote the number of paths of length 2 in the corresponding graphs. The maximal graph is taken to be the star graph in which all atoms are adjacent to a common atom. Thus, Pmax = (N - 1) (N - 2)/2. The linear graph is again taken as the minimal graph, so Pmin = N - 2. Equation (1) thus yields:
𝐾2 = (𝑁 − 1)(𝑁 − 2)2/𝑃2 (2)
Solvent Accessible surface area
The accessible surface area (ASA) is the surface area of a biomolecule (protein, DNA, etc.) that is accessible to a solvent. It is usually quoted in square angstrom (a standard unit of measurement in molecular biology). ASA was first described by Lee & Richards in 1971 is sometimes called the Lee-Richards molecular surface22. ASA is typically calculated using the 'rolling ball' algorithm developed by Shrake & Rupley in 1973.23 This algorithm uses a sphere (of solvent) of a particular radius to 'probe' the surface of the molecule. The choice of the 'probe radius' does have an effect on the observed surface area, as using a smaller probe radius detects more surface details and therefore reports a larger surface. A typical value is 1.4Å, which approximates the radius of a water molecule. Another factor that affects the results is the definition of the VDW radii of the atoms in the molecule under study. For example, the molecule may often lack hydrogen atoms which are implicit in the structure. The hydrogen atoms may be implicitly included in the atomic radii of the 'heavy' atoms, with a measure called the 'group radii'.
Molar refractivity: [24]
The molar refractivity is a constitutive-additive property that is calculated by the Lorenz-Lorentz formula:
𝑀𝑅 =𝑛2−1
𝑛2+2= 𝑀
𝜌 (3)
Polarizability:[24]
The electronic polarizability (ᾳ) is defined as the ratio of the induced dipole moment P of an atom to the electric field E that produces this dipole moment.
P =α x E (4)
Generally, polarizability increases as volume occupied by electrons increases.
RESULT AND DISCUSSION
The parent skeleton of anti-HIV protease inhibitor mannitol is presented in Figure 1.
O O
O O
OH
OH
X
X Y
Y
Figure 1. Parent skeleton of Anti-HIV protease inhibitor Mannitol
The data set of thirty five derivative of anti-HIV protease inhibitor mannitol is divided into training and testing set using random sampling technique for the analysis. The compound of the two sets is included in Table 1 and 3, along with their observed activities. Set A contain twenty training compounds and Set B contain fifteen testing compounds. Although a number of topological parameters are known only five parameters among them have been used in training compounds, which provide better results. The calculation of parameters was performed by CAChe pro software using Project leader, For QSAR prediction of anti-HIV protease inhibitor mannitol we have performed the MLR technique on molecules of training set as shown in table 2. After regression analysis a few suitable model were obtained among which best one is selectedon the basis of correlation coefficient, standard error, standard error of estimation, t-value and p-value, the predicted activity are placed in Table 2.
rCV2=0.333271 r2=0.540097 SE=0.2175 SEE=0.2950 t=4.5973 p=0.0001
A small no. of topological descriptor (Log P, shape index order II, solvent accessible surface area, molecular polarizibility, molar refractivity) proposed were used to established a QSAR Model also establish a relationship between these parameters with observed activity.
A close look of Table 2 indicates that there is direct relation between molar refractivity, molecular polarizibility and observed activity. When observed activity increases, molar refractivity and molecular polarizibility decreases, but there is no sequential rise or fall.
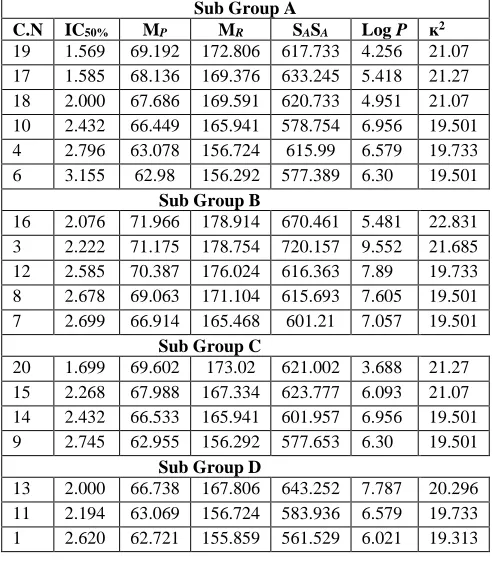
In order to provide sequential relationship, Table 2 is divided into four subgroups (Table 5). Subgroup A contains Comp.no.19, 17, 18,10,4 and 6. Subgroup B contains Comp. no. 16, 3,12,8 and 7. Subgroup C contains Comp. no.20, 15, 14 and 9. Subgroup D contains Comp. no. 13, 11 and 1. Compound no. 2 and 5 do not follow this sequential trend. There is no relation between other topological parameter like log P, shape index order 2 and solvent assessable surface area and observed activity.
Additional validation was performed on testing data set, so we have used these two topological parameter viz. molar refractivity and molecular polarizibility on testing set of compound. The values of topological parameter are placed in Table 4. The QSAR model has been developed by molecular polarizibility and molar refractivity, which has good regression result and predicted activity are placed in Table 4.
PIC50%=0.0154957 MP -0.0858849 MR +7.45841
rCV2=0.435809 r2=0.57997 SE=0.2085 SEE=0.2585 t=4.793 p=0.0001
Furthermore, a close observation of this table indicates that there is direct relation between molar refractivity, molecular polarizibility and observed activity. When observed activity increases, molar refractivity and molecular polarizibility decreases, but there is no sequential rise or fall. In order to provide sequential relationship, table is divided into two subgroups (Table 6). Subgroup A contains Comp. No 25, 31, 27,29,33,34 and 35, (except in the case molecular polarizibility Comp.no.27). Subgroup B contains Comp. no.30, 32 and 24, Compound no. 23, 22, 21, 26 and 28 do not follow this sequential trend.
From the above discussion it indicates that, in testing set there is same relation between molar refractivity & molecular polarizibility with observed activity as in training set of compounds. So we can conclude that topological parameter viz. molar refractivity and molecular polarizibility can better describe the required activity of same series of anti-HIV protease inhibitor mannitol derivatives.
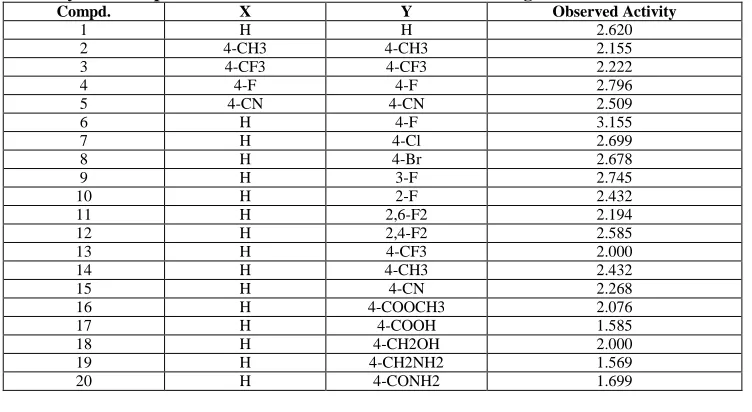
Table 1: Twenty anti HIV protease inhibitor mannitol derivative of training set with their observed activity
Compd. X Y Observed Activity
1 H H 2.620
2 4-CH3 4-CH3 2.155
3 4-CF3 4-CF3 2.222
4 4-F 4-F 2.796
5 4-CN 4-CN 2.509
6 H 4-F 3.155
7 H 4-Cl 2.699
8 H 4-Br 2.678
9 H 3-F 2.745
10 H 2-F 2.432
11 H 2,6-F2 2.194
12 H 2,4-F2 2.585
13 H 4-CF3 2.000
14 H 4-CH3 2.432
15 H 4-CN 2.268
16 H 4-COOCH3 2.076
17 H 4-COOH 1.585
18 H 4-CH2OH 2.000
19 H 4-CH2NH2 1.569
Table 2: Values of topological parameter, predicted activity and observed activity of training set compound
C.N Log P ĸ2 S
ASA MP MR IC50% PIC50%
1 6.021 19.313 561.529 62.721 155.859 2.620 2.718 2 7.89 19.733 639.544 70.453 176.024 2.155 2.271 3 9.552 21.685 720.157 71.175 178.754 2.222 2.29 4 6.579 19.733 615.99 63.078 156.724 2.796 2.318 5 6.165 22.831 667.078 73.119 178.81 2.509 2.152 6 6.3 19.501 577.389 62.98 156.292 3.155 2.626 7 7.057 19.501 601.21 66.914 165.468 2.699 2.463 8 7.605 19.501 615.693 69.063 171.104 2.678 2.394 9 6.3 19.501 577.653 62.955 156.292 2.745 2.626 10 6.956 19.501 578.754 66.449 165.941 2.432 2.748 11 6.579 19.733 583.936 63.069 156.724 2.194 2.667 12 7.89 19.733 616.363 70.387 176.024 2.585 2.543 13 7.787 20.296 643.252 66.738 167.806 2.000 2.394 14 6.956 19.501 601.957 66.533 165.941 2.432 2.473 15 6.093 21.07 623.777 67.988 167.334 2.268 2.27 16 5.481 22.831 670.461 71.966 178.914 2.076 1.972 17 5.418 21.27 633.245 68.136 169.376 1.585 2.014 18 4.951 21.07 620.733 67.686 169.591 2.000 2.066 19 4.256 21.07 617.733 69.192 172.806 1.569 1.817 20 3.688 21.27 621.002 69.602 173.02 1.699 1.599
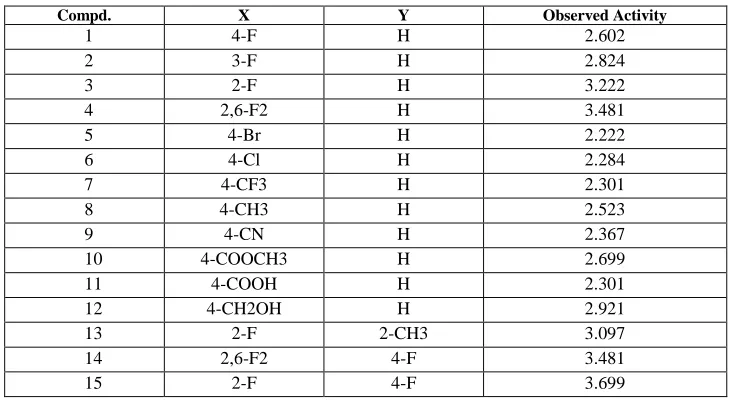
Table 3: Fifteen anti HIV protease inhibitor mannitol derivative of testing set with their observed activity
Compd. X Y Observed Activity
1 4-F H 2.602
2 3-F H 2.824
3 2-F H 3.222
4 2,6-F2 H 3.481
5 4-Br H 2.222
6 4-Cl H 2.284
7 4-CF3 H 2.301
8 4-CH3 H 2.523
9 4-CN H 2.367
10 4-COOCH3 H 2.699
11 4-COOH H 2.301
12 4-CH2OH H 2.921
13 2-F 2-CH3 3.097
14 2,6-F2 4-F 3.481
Table 4: Values of topological parameter, predicted activity and observed activity of testing set compound
C.N MP MR PIC50% IC50%
1 62.942 156.292 2.889 2.602
2 63.022 156.292 2.872 2.824
3 62.778 156.292 2.929 3.222
4 62.907 156.724 3.284 3.481
5 69.152 171.104 2.105 2.222
6 66.888 165.468 2.462 2.284
7 66.923 167.806 2.872 2.301
8 66.579 165.941 2.429 2.523
9 68.139 167.334 2.455 2.367
10 72.083 178.914 2.486 2.699
11 68.308 169.376 2.556 2.301
12 67.741 169.491 2.541 2.921
13 66.521 166.374 2.133 3.097
14 63.154 157.157 3.408 3.481
15 63.009 156.724 3.167 3.699
Table 5: Relationship between reactive indices and observed of activity of training set compound
Sub Group A
C.N IC50% MP MR SASA Log P ĸ2
19 1.569 69.192 172.806 617.733 4.256 21.07 17 1.585 68.136 169.376 633.245 5.418 21.27 18 2.000 67.686 169.591 620.733 4.951 21.07 10 2.432 66.449 165.941 578.754 6.956 19.501 4 2.796 63.078 156.724 615.99 6.579 19.733 6 3.155 62.98 156.292 577.389 6.30 19.501
Sub Group B
16 2.076 71.966 178.914 670.461 5.481 22.831 3 2.222 71.175 178.754 720.157 9.552 21.685 12 2.585 70.387 176.024 616.363 7.89 19.733 8 2.678 69.063 171.104 615.693 7.605 19.501 7 2.699 66.914 165.468 601.21 7.057 19.501
Sub Group C
20 1.699 69.602 173.02 621.002 3.688 21.27 15 2.268 67.988 167.334 623.777 6.093 21.07 14 2.432 66.533 165.941 601.957 6.956 19.501 9 2.745 62.955 156.292 577.653 6.30 19.501
Sub Group D
Table 6: Relationship between reactive indices and observed activity of testing set compound
Sub group A
C.N IC50% MR MP
25 2.222 171.104 69.152
31 2.301 169.376 68.308
27 2.301 167.806 66.923
29 2.367 167.334 68.139
33 3.097 166.374 66.521
34 3.481 157.157 63.154
35 3.699 156.724 63.009
Sub Group B
30 2.699 178.914 72.083
32 2.921 169.491 67.741
24 3.481 156.724 62.907
CONCLUSION
The above study reveals that there is a direct relation between molar refractivity, molecular polarizibility and observed activities and these can better describe the required activity of anti-HIV protease inhibitor mannitol derivatives.
REFERENCES
1. Sepkowitz KA. "AIDS—the first 20 years". N. Engl. J. Med.,344 (23): 1764–72, (2001). 2. Weiss RA."How does HIV cause AIDS?”, Science, 260 (5112): 1273–9, (1993).
3. Cecil, Russell. Textbook of Medicine. Philadelphia: Saunders. pp.1523-1799. (1988). 4. Alimonti J.B, Ball T.B, Fowke K.R "Mechanisms of CD4+ T lymphocyte cell death in
human immunodeficiency virus infection and AIDS". J. Gen. Virol., 84 (7):1649-1661, (2003). 5. Smeyers, Y. G., L. Bouniam, N. J. Smeyers, A. Ezzamarty, A. Hernandez-Laguna, A., and C. I.Sainz-Diaz,” Quantum mechanical and QSAR study of some α–aryl propionic acids as anti-inflammatory agents”, Eur. J. Med. Chem.,33,103, (1998).
6. Parr R. G., and W. Yang, “Density Functional Theory of Atoms and Molecules”, Oxford University Press, New York, (1989).
7. Kohn, W., A. D. Becke, and R. G. Parr,” Density functional theory of electronic structure”
J. Phys. Chem., 100: 12974, (1996).
8. Hohenberg, P., and W. Kohn, “Inhomogeneous electron gas” Phys. Rev., 136:B864, (1964). 9. Ayers, P. W., and R. G. Parr,” Variation principals for describing chemical reaction: The
fukai function and chemical hardness revisited” J. Am. Chem. Soc., 122: (2000).
10. De Proft, F., J. M. L. Martin, and P. Geerlings, “On the performance of DFT for describing atomic population dipole moment and infrared intensites”, Chem. Phys Lett., 250: 393, (1996).
Chemistry; Seminario, J., Ed.; Elsveir; Amsterdam.; Vol- 4 (Recent Developments in Density Functional Theory), p773, (1996).
12. De Proft, F., J. M. L. Martin, and P. Geerlings, “Calculation of molecular electrostatic potentials and fukai function using density functional method “, Chem. Phys Lett., 256: 400, (1996).
13. De Proft, F., and P. Geerlings, “Calculation of ionization energies, electron affinities, electronegativites and hardness using Density functional methods”, J. Chem Phys.,106: 3270, (1997).
14. Hansch, C., P. G. Sammes, and J. B.Taylor,” The Rational Design; mechanistic study and therapeutic application of chemical compounds” Computers and the medicinal chemist; in: Comprehensive Medicinal Chemistry, vol. 4, Eds. Pergamon Press, Oxford, pp. 33–58, (1990).
15. Franke, R., “Theoretical Drug Design Methods”, Elsevier, Amsterdam, (1984).
16. Bouzide, A.; Sauve´, G.; Se´vigny, G.; Yelle, J. Bioorg. Med. Chem. Lett., 13,3601 (2003). 17. From Wikipedia, the free encyclopedia on Internet.
18. Balaban A.T., Chemical Physics Letters, 89,5, 399 (1982). 19. Petitjean M., J. Chem. Inf. Comput. Sci., 32, 331 (1992). 20. Lee B., Richards F.M., J. Mol. Biol., 55(3), 379 (1971).
21. Clark T., A Handbook of Computational Chemistry, John Wiley and Sons, New York, (1985)
22. Linta, D. H., Garg. R., Hansch, C. Chem. Rev., 104, 3751 (2004). 23. Balaban A.T., Theoretica Chimica Acta, 53, 355 (1979).