The purpose of this study is to explore the role of sex differences and personality in vulnerability to depression. Sex differences in personality and some clinical variables are described. We also assess the value of the variables that revealed significant sex differences as predictors of vulnerability to depression. In a group of adult participants (N = 112), 50% males and 50% females (mean age = 41.30; SD = 15.09; range 17- 67), we studied sex differences in the three-factor personality model, using the Eysenck Personality Questionnaire, Form A (EPQ-A; Eysenck & Eysenck, 1975), and in the Five-Factor Personality Model, with the NEO Personality Inventory (NEO-PI; Costa & McCrae, 1985). The following clinical scales were used: the Beck Depression Inventory (BDI; Beck, Rush, Shaw, & Emery, 1979), the Schizotypy Questionnaire (STQ; Claridge & Broks, 1984; Spanish version, Carrillo & Rojo, 1999), the THARL Scales (Dua, 1989, 1990; Spanish version, Dua & Carrillo, 1994) and the Adjustment Inventory (Bell, 1937; Spanish version, Cerdá, 1980). Subsequently, simple linear regression analysis, with BDI scores as criterion, were performed to estimate the value of the variables as predictors of vulnerability to depression. The results indicate that a series of personality variables cause women to be more vulnerable to depression than men and that these variables could be explained by a negative emotion main factor. Results are discussed within the framework of the psychological behaviorism theory of depression. Keywords: depression in women, personality, vulnerability, sex differences, behaviorism theory of depression
En este trabajo se examinó el papel de las diferencias del sexo y de la personalidad en la vulnerabilidad a la depresión. Se describen las diferencias entre sexos en personalidad y en algunas variables clínicas para, posteriormente, analizar el papal de las variables que muestran diferencias estadísticamente significativas entre los sexos, como predictoras de la vulnerabilidad a la depresión. Para cumplir con este objetivo, se exploraron extensamente esas diferencias en dos grandes modelos de la personalidad y en algunas escalas clínicas. Nuestros datos se obtuvieron de un grupo de adultos (N = 112), 50% hombres y 50% mujeres (media de edad = 41.30; SD = 15.09; rango 17- 67). Se estudiaron las diferencias entre mujeres y hombres respecto al modelo de 3 factores, utilizando el Eysenck Personality Questionnaire, Form A (EPQ; Eysenck & Eysenck, 1975; versión española de TEA, 1986), y el modelo de 5 factores (NEO Personality Inventory -NEO-PI; Costa & McCrae, 1985). Se aplicaron también algunas escalas clínicas: Depression Inventory (BDI; Beck et al., 1979), Schizotypy Questionnaire (STQ; Claridge & Broks, 1984; versión española de Carrillo y Rojo, 1999), THARL scales (Dua, 1989, 1990; versión española de Dua y Carrillo, 1994), y The Adjustment Inventory (Bell, 1937; versión española: Cuestionario de adaptación para adultos, Cerdá, 1980). Tras estudiar las diferencias según el sexo respecto a estos factores, se estimó su valor de vulnerabilidad a la depresión mediante análisis de regresión lineal simple, siendo la escala BDI de Beck el criterio de depresión. Los resultados mostraron que existe un conjunto de variables que hacen a las mujeres más vulnerables a la depresión que a los hombres. Estas variables podrían explicarse a partir de un factor principal de emocionalidad negativa. Se discuten los resultados en el contexto de la teoría del conductismo psicológico de la depresión. Palabras clave: depresión en la mujer, personalidad, vulnerabilidad, diferencias según el sexo, teoría conductual de la depresión
Women and Vulnerability to Depression:
Some Personality and Clinical Factors
Jesús M. Carrillo
1, Nieves Rojo
1and Arthur W. Staats
21University Complutense of Madrid 2University of Hawaii
Correspondence concerning this article should be addressed to J.M. Carrillo, Departamento de Personalidad, Evaluación y Psicología Clínica, Facultad de Psicología, Universidad Complutense de Madrid, Campus Somosaguas, 28223 Madrid (Spain). E-mail: [email protected]
According to the National Institute of Mental Health (NIMH) –Bethesda, Maryland- in 1980 an average of 10.2% of the general population had depressive symptoms; of these, 70% were women and 30% were men. One in ten women can expect to suffer from serious depression in their lifetime (Kaplan 1986). In psychiatric facilities in the United States, the average, across all age groups, is 205.5 women (compared to 138 men) treated for depression per 100,000 people in the general population (Nolen-Hoeksema, 1990). Twice as many women than men present depressive symptoms (McGrath, Keita, Strickland, & Russo, 1991). The APA’s latest report on women and depression (2002) states that 19 million Americans suffer from depression yearly and that women are twice as likely as men to experience a major depressive episode. Women are susceptible to suffer from depression at any age. Their depression can be linked to life events such as puberty, pregnancy, menopause, substance abuse, quality of relationships, life events, and cognitive styles. These figures might also be higher because, unfortunately, depression is under-diagnosed and under-treated by primary health care and other practitioners.
According to the 2001 World Health Organization (WHO) report, depression is the most common disease suffered by women when compared with other diseases. In the WHO’s Global Burden of Disease Indexes, the point prevalence of unipolar depressive episodes is 1.9% for men and 3.2% for women; 5% of men and 9.5% of women experience a depressive episode in a 12-month period.
In Spain, Aragonès et al. (2001), conducted a study which intended to find the prevalence and characteristics of depressive disorders in patients receiving primary care. They found a 14.7% weighed prevalence for major depression and 4.6% for dysthymia, (a 19.3% prevalence for both), in a sample of 350 patients aged between 18 and 70.
Severe impairment in social and physical functioning can be derived from major depression. Depression is also a precipitating factor for suicide and has been associated with higher medical costs, more frequent care and increased morbidity and mortality (Katon & Sullivan, 1990).
Brems (1995) indicated three main groups or factors that could make women more vulnerable to depression than men:
biological, social, and psychosocial. The biological factors
include: genes, reproductive-related events that clearly differentiate women and men such as premenstrual syndrome, menopause, climateric, and postpartum syndromes. The social factors include: socioeconomic condition, social roles and social support, as well as the effects of discrimination. Finally, psychosocial factors are comprised of socialization and personality development, interpersonal violence, sexual harassment, rape, spousal abuse, and a history of childhood sexual abuse. These groups could be used to outline risk factors that make women more vulnerable to depression than men.
In this study, we focused on psychological factors, and we attempted, more concretely, to detect which personality
variables make women more vulnerable to depression. Gender difference has not been thoroughly studied across personality models. We also attempted to evaluate the depression-vulnerability value of these variables. The significance of these aims is conceptualized in Staats’ psychological behaviorism personality theory (PB) and in his depression theory (Staats, 1996, 2003; Staats & Heiby, 1985) which, uniquely, includes a theory of psychological tests as well as theories of psychological disorders including depression. In sum, personality is considered to consist of learned repertoires of behavior that are divided into three areas: language-cognitive, emotional-motivational, and sensory-motor. Specific responses are the basic units of behavior; traits are composed of repertoires of related responses. Although not elaborated with this purpose, psychological tests measure these basic repertoires. As examples, intelligence tests measure aspects of the language-cognitive repertoire, developmental tests measure aspects of the sensory-motor repertoire, and interest tests measure aspects of the emotional-motivational repertoire (Staats, 1996, 2003).
In Staats’ theory, depression is defined in terms of the individual’s emotional state, which is composed of the emotional responses, positive and negative, which the individual experiences as a result of his or her circumstances in life. The positive and negative emotional responses follow the Principle of Additivity of Emotions (see Staats, 1996). For instance, two individuals with the same traits may encounter different life circumstances, so that one may experience many more negative-emotion-eliciting stimuli than the other. Differences will also occur because of the way individuals have learned to respond emotionally to life stimuli. Thus, a person who has learned to respond in an emotionally negative way to more stimuli will probably experience more negative emotional responses, that is, more depression. Conversely, a person who has learned to respond in an emotionally positive way to more stimuli will experience—all things being equal— more positive emotional responses, that is, less depression. These expectations are derived from the Principle of Additivity of Emotions cited above.
The more negative the resultant sum, the more depressed the individual becomes. The Beck Depression Inventory
(BDI) (Beck et al., 1979), has been devised to provide
measures of depression.
more negative emotional responses than an individual who has not learned such emotional responses.
The individual’s emotional state will also be determined by the life circumstances the individual encounters. The THARL Scales (Dua, 1989, 1990) include items that measure the extent to which the individual’s life circumstances have presented the individual with emotion-eliciting stimuli. For example, items ask the individual to indicate the extent to which he or she has had positive or negative emotional experiences in the past month regarding important life stimuli—such as family members, colleagues, friends, health, and his/ her economic situation.
In sum, the trait of extensiveness of emotional responding
to life stimuli, both of a positive and negative nature, will
be a determining factor in depression. Moreover, the extent to which a person experiences depression will also be a function of how many life stimuli the person encounters that elicit positive as well as negative emotional responses. The aim of this study is twofold: first, to explore whether there is a nomological network of dimensions and specific traits in some of the main personality models and clinical variables that differentiate personality as a function of sex; and second, to examine whether these sex differences in the personality and clinical variables employed can predict depression. We hypothesize that personality tests, insofar as they measure the individual’s emotional characteristics, and the individual’s emotional life circumstances, will be predictive of depression. It is also hypothesized that there are sex differences with respect to both emotional personality characteristics and emotional life circumstances.
Method
Participants
A group drawn from a nonclinical population (N = 112), 50% males and 50% females (mean age = 41.30, SD = 15.09, range 17- 67; M = 42.66, SD = 14.48, range 18-66, for men, and M = 39.95, SD = 15.69, range 17-67, for women) took part in the present study. The age difference between the two groups was not statistically significant, F (1, 110) = 0.9, p = .34. Participants were recruited using a “snowball” technique, in which a group of psychology undergraduates from the Complutense University of Madrid, after being briefed, gave the test to four people from their circle of friends, with some restrictions in order to maintain a balance of sex and the age distribution. The participants obtained credits for their cooperation.
Instruments
Two types of instruments were employed in this study: broad personality dimension measures and clinical measures. To measure personality, we used the Eysenck Personality
Questionnaire, Form A (EPQ-A; Eysenck & Eysenck, 1975) and the NEO Personality Inventory (NEO-PI; Costa & McCrae, 1985). For clinical measurements, we used the Beck Depression Inventory (BDI; Beck, Rush, Shaw, & Emery, 1979), the Schizotypy Questionnaire (STQ; Claridge & Broks, 1984), the THARL Scales (Dua, 1989, 1990; Dua & Carrillo’s Spanish version, 1994), and the Adjustment Inventory (Bell 1974; Cerdá’s Spanish version, 1980).
Broad Personality Dimension Measures
Eysenck Personality Questionnaire, Form A (EPQ-A;
Eysenck & Eysenck, 1975). This questionnaire measures three major dimensions of normal adult personality: Neuroticism, Extraversion, and Psychoticism. The Spanish version of the EPQ-A (TEA, 1986) shows adequate indexes
of reliability. The internal consistency acoefficients for a sample of Spanish women (N= 595) were: Neuroticism = .83, Extraversion = .82, Psychoticism = .70, and the Lie Scale = .77; for a sample of Spanish men (n = 435), they were: Neuroticism = .85, Extraversion = .82, Psychoticism = .71, and the Lie Scale = .79.
NEO Personality Inventory (NEO-PI; Costa & McCrae,
1985). This inventory provides measures of five major personality dimensions: Neuroticism, Extraversion, Openness to Experience, Agreeableness, and Conscientiousness. Six 8-item facet scales measure more specific traits within each of the first three factors. Silva, Avia, Sanz, Martínez-Arias, Graña, and Sánchez-Bernardos (1994) analyzed the structure and some psychometric properties of the NEO-PI Spanish version used in this study. Internal consistency (Cronbach’s
experiences, in the areas of anxiety, self-consciousness, vulnerability, and hostility, and thus should be predictive of the person’s susceptibility to depression.
Clinical measures
Beck Depression Inventory (BDI; Beck, Rush, Shaw, &
Emery, 1979). This is a 21-item self-report scale, designed to assess the severity of depressive symptoms. This instrument is widely used and documented in literature, in samples from North America (Beck, Steer, & Garbin, 1988) and Spain (Vázquez & Sanz, 1991), and appears to be reliable and valid for assessing depression. Vázquez and Sanz (1997) reported BDI internal consistency data in a general population (N = 445; a= .83). They also indicated that, in this sample, upon comparing the BDI item content with depression criteria from the Diagnostic and Statistical
Manual of Mental Disorders, 4thedition (DMS-IV; American
Psychiatric Association, 1994), the BDI also had satisfactory content validity. Vázquez and Sanz (1997) obtained a mean score of 7.53 (SD = 6.75, range 0-39); in our sample the mean was 7.97 (SD = 7.84, range 0-35).
Schizotypy Questionnaire (STQ; Claridge & Broks, 1984;
Carrillo & Rojo’s Spanish version, 1999). This questionnaire assesses psychotic traits in the normal population. It consists of two scales: the Schizotypal Personality Scale (STA), reflecting diagnostic criteria for schizotypal personality disorder according to the DSM-IV (American Psychiatric Association, 1994), and the Borderline Personality Scale (STB), which reflects diagnostic criteria for borderline personality disorder. The STQ appears to be a reliable and valid measure of psychotic characteristics. Jackson and Claridge (1991) established test-retest reliability for the STQ in a normal adult sample after a long span of four years. The STA and STB scales provided respective test-retest reliability coefficients of .64 and .61 (N = 228). Claridge and Broks (1984), in a validity analysis, reported that the STA and STB scales correlated significantly with an early form of the Eysenck P Scale that had more psychotic content than other versions. Jackson and Claridge (1991) compared STA and STB means in normal and clinical samples, and both factors significantly differentiated the two groups, the clinical scores being higher than the normal scores. In our sample, we obtained: M = 15.03, SD = 6.65, range 0-31, and M = 5.51, SD = 3.76, range 0-16, for the STA and the STB, respectively.
THARL Scales (Dua, 1989, 1990; Dua & Carrillo’s
Spanish version, 1994). The THARL Scales contain four subscales: positive emotions from thoughts, positive emotions from real life experiences, negative emotions (or distress) from thoughts, and negative emotions from real life experiences. The scale presents 14 items and the participants are requested to indicate, on a scale ranging from 0-100, the degree to which their thoughts or real life experiences cause positive affects and negative affects. The 14 items are: yourself, family, relatives, friends, other people you
know, strangers, colleagues, subordinates, superiors, others at work, work in general, people in general, surroundings in general, and the world in general. In preliminary studies, the four subscales of the THARL had reliability coefficients ranging from .69 to .78 (Dua, 1989). Cuadra (2003) presented very acceptable internal consistency indexes (Cronbach’s a) for the four THARL scales (Spanish version, Dua, & Carrillo, 1994). For positive emotions from thoughts
a= 0.82, for positive emotions from real life experiences
a= .86, for negative emotions (or distress) from thoughts
a= .92, and for negative emotions from real life experiences
a= .92. The aconsistency indexes were higher for the negative affect scales.
In validity studies using the Adjective Check-List (Mackay, Cox, Burrows, & Lazzerini, 1978) for the assessment of stress, the two THARL distress subscales correlated positively with measures of stress (Dua, 1989; Rappa, 1987). In this study, we used the Spanish version of this scale (Dua & Carrillo, 1994). In our group we obtained means of 37.21 (SD = 17.91, range 5.2-80.5) and 39.62 (SD = 17.54, range 6.4-83.) for positive emotions from thoughts and from real life experiences, respectively; and means of 24.55 (SD = 12.86, range 5.0- 61.7) and 26.41 (SD = 14.74 range 5.0-81.9) for negative emotions from thoughts and from real life experiences, respectively.
The Adjustment Inventory (Bell, 1974; Cerdá’s Spanish
version: Cuestionario de Adaptación para Adultos, 1980). This questionnaire yields five measures of adjustment in family, health, social, emotional, and professional contexts. It also provides a score of total adjustment. High scores in the adjustment scales indicate maladjustment, whereas low scores indicate healthy adjustment.
In this study we took into account only the family, health, social and emotional scales. We obtained the following data for our sample: Family Adjustment, M = 8.05, SD = 5.7, range 0-26; Health Adjustment, M = 7.70, SD = 5.37, range 0-24; Social Adjustment, M = 11.72, SD = 6.71, range 1-28; and Emotional Adjustment: M = 11.09, SD = 7.11, range 0-27.
Procedure
Participants filled in all the measurement instruments anonymously, in random order and in two sessions.
Data Analysis
Results
First, one factor ANOVA’s were carried out to examine whether there were sex differences in the following broad personality dimension measures: Neuroticism, Extraversion, and Psychoticism, as measured by the EPQ-A; Neuroticism, Extraversion, Openness to Experience, Agreeableness, and Conscientiousness, as measured by the NEO-PI; and the facets from the first three NEO-PI factors. So, in these analyses, “sex” was considered to be the factor and the other measures cited above were used as dependent variables. Similar statistical analyses were carried out on the following clinical measures: Schizotypal Personality and Borderline Personality, as measured by the STQ; Positive Emotions from Thoughts, Positive Emotions from Real Life Experiences, Negative Emotions from Thoughts, and Negative Emotions from Real Life Experiences, as measured by the THARL Scales; and Family Adjustment, Health Adjustment,
and Emotional Adjustment, as measured by the Adjustment Inventory. A significance level of p = .05 was used for all analyses. With regard to the variables that revealed statistically significant sex differences, we carried out a simple linear regression analyses using the total sample, the sample of men and the sample of women with each of these variables as a predictor, in order to assess their depression value (BDI). Tables 1a and 1b show the results of these analyses with respect to the EPQ-A personality measures.
EPQ-A Variables
The ANOVA performed on the EPQ-A domain revealed statistically significant sex differences in Neuroticism, F (1, 110) = 29.25, p < .001. Therefore, it seems that women score higher in Neuroticism than do men. Neuroticism (see Table 1b) also seems to have high potential as a positive predictor of depression, R2 = .295, F(1, 110) = 45.96, p < .001.
Table 1a
Means, Standard Deviations and F-values for Sex Differences in the EPQ-A Personality Factors
Variables Sex M SD F p Levene’s Test p
Men 10.11 5.8
Neuroticism 29.25 .000 0.410 .523
Women 15.55 5.48
Men 12.43 4.08
Extraversion 0.03 .856 0.051 .822
Women 12.29 4.23
Men 2.68 2.35
Psychoticism 3.03 .085 6.055 .015
Women 1.98 1.85
Note. N = 112 (56 men, 56 women).
Table 1b
Simple Linear Regression Analyses for the EPQ-A Scales Predicting BDI Scores
Predictor Variables Groups R Adjusted R2 F p
Total .543 .288 45.96 .000
Neuroticism Men .431 .171 12.32 .001
Women .501 .237 18.13 .000
Total .143 .009 2.00 .160
Extraversion Men .032 –.017 0.56 .814
Women .200 .022 2.257 .139
Total .293 .078 10.34 .002
Psychoticism Men .421 .162 11.64 .001
Women .390 .136 9.66 .003
With respect to Psychoticism, we observed a tendency for men to score higher than women, F(1, 110) = 3.03, p =
.085. Levene’s test for the homogeneity of variance (Levene,
1960) was 6.055, p = .015. According to Eysenck’s Psychoticism, statistically significant differences between the sexes do not exist (F(1, 110)= 3.03, p = .085). Nevertheless, Levene’s test showed that homogeneity of variance did not exist (F = 6.055, p = .015). Thus the above mentioned absence of differences between sexes is not totally reliable and requires further research.
Eysenck’s Psychoticism was present in the above mentioned problems and was also a positive predictor of depression, despite the fact that the variance accounted for is very low, R2= .085, F(1, 110) = 10.34, p = .002.
NEO-PI Variables
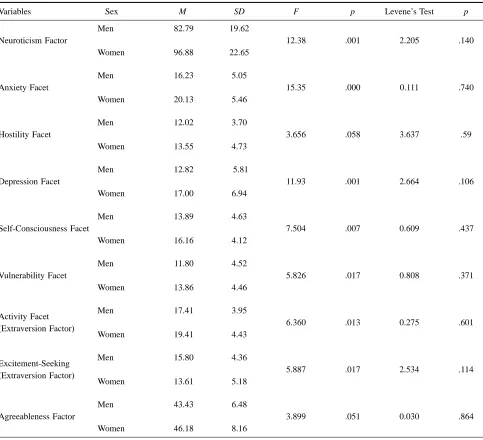
Results of the analyses of the personality measures of the NEO-PI factors and facets are shown in Tables 2a and 2b. Table 2a displays the ANOVA for detecting statistically significant sex differences, and Table 2b shows the results of the simple linear regression analyses, with the NEO-PI factors and facets as predictors and the BDI as the dependent variable. In the Spanish 1995 version used, only facets for Neuroticism, Extraversion, and Openness to Experience are included.
Women scored higher than men in Neuroticism, and this difference was statistically significant, F(1, 110) = 12.38, p
< .001. Neuroticism is, at the same time, very important as
Table 2a
Means, Standard Deviations and F-values for Sex Differences in the NEO-PI Personality Factors and Facets
Variables Sex M SD F p Levene’s Test p
Men 82.79 19.62
Neuroticism Factor 12.38 .001 2.205 .140
Women 96.88 22.65
Men 16.23 5.05
Anxiety Facet 15.35 .000 0.111 .740
Women 20.13 5.46
Men 12.02 3.70
Hostility Facet 3.656 .058 3.637 .59
Women 13.55 4.73
Men 12.82 5.81
Depression Facet 11.93 .001 2.664 .106
Women 17.00 6.94
Men 13.89 4.63
Self-Consciousness Facet 7.504 .007 0.609 .437
Women 16.16 4.12
Men 11.80 4.52
Vulnerability Facet 5.826 .017 0.808 .371
Women 13.86 4.46
Men 17.41 3.95
Activity Facet
6.360 .013 0.275 .601 (Extraversion Factor)
Women 19.41 4.43
Men 15.80 4.36
Excitement-Seeking
5.887 .017 2.534 .114 (Extraversion Factor)
Women 13.61 5.18
Men 43.43 6.48
Agreeableness Factor 3.899 .051 0.030 .864
Women 46.18 8.16
a positive predictor of depression, R2= .373, F(1, 110) =
65.51, p < .001. (see Table 2b).
Of the six facets of Neuroticism, four revealed statistically significant sex differences: Anxiety, F(1, 110) = 15.35, p < .001; Depression F(1, 110) = 11.93, p < .001; Self-Consciousness F(1, 110) = 7.504, p = .007; and Vulnerability F(1, 110) = 5.826, p = .017. The facet of Hostility showed a trend toward statistical significance, F (1, 110) = 3.656, p = .058. In all of these facets, women scored higher than men. These facets (see Table 2b) were also positive predictors of depression: Anxiety, R2 = .257,
F (1, 110) = 38.12, p < .001; Depression, R2= .386, F(1,
110) = 69.01, p < .001; Self-Consciousness, R2 = .286, F(1,
110) = 44.15, p < .001; Vulnerability, R2 = 0.207, F(1, 110)
= 28.63, p < .001; and Hostility, R2 = .192, F(1, 110) =
26.16, p < .001. The only Neuroticism facet that did not show statistically significant sex differences was Impulsiveness.
With regard to Extraversion, two facets from this factor revealed statistically significant sex differences: Activity,
F(1, 110) = 6.360, p = .013 and Excitement-Seeking, F(1,
110) = 5.887, p = .017. In this case, women scored higher in Activity, but this facet did not reach statistical significance as a predictor of depression, R2= .028, F(11, 110) = 13.12,
Table 2b
Simple Linear Regression Analyses for the NEO-PI Factors and Facets that Revealed Statistically Significant Sex Differences Predicting BDI-Scores
Predictor Variables Groups R Adjusted R2 F p
Total .611 .368 65.41 .000
Neuroticism Factor/ Facets Men .445 .183 13.34 .001
Women .639 .398 37.33 .000
Total .507 .251 38.12 .000
Anxiety Men .260 .050 3.91 .053
Women .556 .296 24.16 .000
Total .438 .185 26.16 .000
Hostility Men .289 .067 4.93 .031
Women .468 .204 15.12 .000
Total .621 .380 69.01 .000
Depression Men .573 .316 26.40 .000
Women .590 .316 28.87 .000
Total .535 .280 44.15 .000
Self-Consciousness Men .473 .209 15.56 .000
Women .550 .290 23.45 .000
Total .454 .199 28.63 .000
Vulnerability Men .133 –.001 0.97 .329
Women .602 .350 30.68 .000
Total .166 .019 13.12 .800
Activity Facet
Men .183 .016 1.88 .180
(Extraversion Factor)
Women .244 .042 3.41 .070
Total .196 .030 4.42 .038
Excitement-Seeking
Men .157 .007 1.36 .248
(Extraversion Factor)
Women .122 –.003 .81 .370
Total .033 –.008 0.122 .727
Agreeable-Ness Factor Men .063 –.015 .213 .646
Women .124 –.003 .84 .362
p = .08. In Excitement-Seeking, men’s scores were higher
than women’s, but this facet appears to be a negative predictor of depression, R2 = .039, F (1, 110) = 4.42, p = .038.
Finally, women’s scores were higher than men’s in Agreeableness, F(1, 110) = 3.899, p = 0.051, but this factor was not statistically significant for predicting depression (R2
= .001, F(1, 110) = 0.122, p = .727).
Taking into account the simple linear regression analyses, Vulnerability did not predict depression in the men’s group while in the women’s and in the total groups, it did.
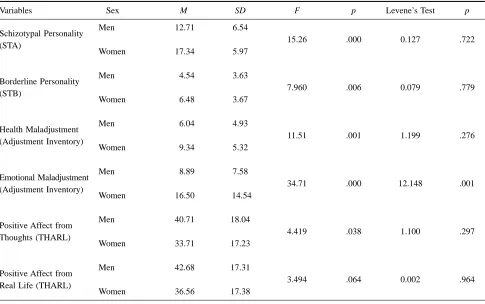
Clinical Variables
Table 3a and 3b show the results of the analysis of the clinical measures. Six of them revealed statistically significant sex differences. In the Schizotypy Questionnaire, a statistically significant sex difference was observed in the Schizotypal Personality (STA), with women scoring higher than men, F(1, 110) = 15.26, p < .001. Schizotypal Personality is a strong predictor of depression, R2= .277,
F(1, 110) = 42.08, p < .001. Borderline Personality revealed
similar sex differences, F(1, 110) = 7.960, p = .006 and also predicted depression, R2 = .286, F(1, 110) = 44.14, p
< .001). In the Adjustment Inventory, women also scored
significantly higher than men in Health Maladjustment, F (1, 110) = 11.51, p <.001, which also predicted depression,
R2 = .152, F(1, 110) = 19.54, p < .001. In Emotional
Maladjustment, women also scored higher than men, F( 1, 110) = 34.71, p < .001, although in this variable the null hypothesis of the homogeneity of variances was rejected (Levene’s test, F(1, 109) = 12.148, p < .001). Among the clinical scales, Emotional Maladjustment was one of the best predictors of depression, R2= .390, F(1, 110) = 69.75,
p < .001. In the THARL, men scored higher than women
in Positive Affect from Thoughts, F(1, 110) = 4.419, p =
.038, and this factor predicted depression: R2= .128, F(1,
110) = 17.25, p < .001. Positive Affect from Real Life showed a trend for men to score higher than women, but this did not reach statistical significance, F(1, 110) = 3.494,
p = .064. This variable was an acceptable predictor of
depression: R2= .141, F(1, 110) = 18.04, p < .001.
According to simple linear regression analyses, Health Maladjustment (Adjustment Inventory) and Real Life Positive Affect (THARL) did not predict depression in the men’s group while in the women’s and in the total groups, it did.
Table 3a
Means, Standard Deviations and F-values for Sex Differences in the Clinical Measures Schizotypal Personality (STA), Borderline Personality (STB), Health Maladjustment, Emotional Maladjustment, Positive Affect from Thoughts (THARL), and Positive Affect from Real Life (THARL)
Variables Sex M SD F p Levene’s Test p
Men 12.71 6.54
Schizotypal Personality
15.26 .000 0.127 .722 (STA)
Women 17.34 5.97
Men 4.54 3.63
Borderline Personality
7.960 .006 0.079 .779 (STB)
Women 6.48 3.67
Men 6.04 4.93
Health Maladjustment
11.51 .001 1.199 .276 (Adjustment Inventory)
Women 9.34 5.32
Men 8.89 7.58
Emotional Maladjustment
34.71 .000 12.148 .001 (Adjustment Inventory)
Women 16.50 14.54
Men 40.71 18.04
Positive Affect from
4.419 .038 1.100 .297 Thoughts (THARL)
Women 33.71 17.23
Men 42.68 17.31
Positive Affect from
3.494 .064 0.002 .964 Real Life (THARL)
Women 36.56 17.38
Discussion
In accordance with our expectations, the results mapped a nomological network of differences in personality and clinical variables as a function of sex. Furthermore, practically all of the personality dimensions and clinical variables in which statistically significant sex differences were found, were also good predictors of depression. These findings suggest that such differences in personality and clinical variables may make women significantly more vulnerable to depression than men.
A question arises in the context of these findings: How are the personality factors that differentiate the sexes involved as determinants of depression? Is there a conceptual framework within which to interpret the findings? The psychological behaviorism theory of personality (Staats, 1996, 2003) was employed as the framework of this study. To illustrate, let us consider the NEO-PI Neuroticism facets (with the exception of Impulsiveness) to measure the extent to which the individual has a negative emotional response to life stimuli, part of the emotional-motivational trait (repertoire). For example, when items in the Anxiety facet are analyzed, we see that they measure negative emotional
responses to certain types of life stimuli. “I get upset easily” is an example of an item from this facet which clearly illustrates how the scale measures a recurrent negative emotional response. The same is true for the Self-Consciousness, Vulnerability, and Hostility facets of the NEO-PI. Each of them measures learned negative emotions to certain types of life stimuli. An example of an item from the Self-Consciousness facet is, “I rarely feel uneasy when I am with people.” A “false” answer indicates that this person describes him or herself as having an uneasy feeling (a negative emotional response) to people. Ordinarily this response to the item indicates that the person experiences a lot of negative emotion responding. An example of an item from the Vulnerability facet is, “I am sufficiently stable emotionally.” A “false” answer indicates that the person experiences inappropriate emotions frequently, and hence negative emotions. And finally, an example of an item from the Hostility facet is, “I am frequently annoyed by the way people treat me.” A “true” answer to this item also describes a person who frequently experiences a negative emotional response.
So, these NEO-PI facets measure parts of an individuals’ emotional-motivational trait (repertoire); but why do the Table 3b
Simple Linear Regression Analyses for the Clinical Measures Schizotypal Personality (STA), Borderline Personality (STB), Health Maladjustment, Emotional Maladjustment, Positive Affect from Thoughts (THARL), and Positive Affect from Real Life (THARL) that Revealed Statistically Significant Sex Differences Predicting BDI-Scores
Predictor Variables Groups R R2 Adjusted R2 F p
Total .526 .277 .270 42.08 .000
Schizotypal Personality (STA) Men .491 .241 .227 17.18 .000
Women .481 .231 .217 16.21 .000
Total .535 .286 .280 44.14 .000
Borderline Personality (STB) Men .418 .175 .159 11.44 .001
Women .560 .314 .301 24.73 .000
Total .390 .152 .144 19.54 .000
Health Maladjustment
Men .070 .005 –.014 .259 .613
(Adjustment Inventory)
Women .466 .217 .202 14.95 .000
Total .625 .390 .385 69.75 .000
Emotional Maladjustment
Men .447 .200 .185 13.22 .001
(Adjustment Inventory)
Women .607 .368 .357 31.50 .000
Total .368 .136 .128 17.25 .000
Thoughts Positive
Men .290 .084 .067 4.97 .030
Affect (THARL)
Women .371 .137 .121 8.60 .005
Total .375 .141 .133 18.04 .000
Real Life Positive
Men .245 .060 .043 3.46 .068
Affect (THARL)
Women .415 .172 .157 11.23 .001
facets predict depression, and distinguish the sexes? The psychological behaviorism theory of depression, briefly described in the introduction, is that an individual’s level of depression is a result of the sum of negative and positive emotional responses to life stimuli. Hence, with regard to the NEO-PI, increasing scores in the areas of anxiety, self-consciousness, vulnerability, and hostility are indicative of increased experiences of negative emotional response. Increased negative emotional responses means an increase in both life experience of depression as well as higher scores on tests of depression. Our results support this expectation.
With regard to the STQ, according to Claridge (1984) and Stone (1980), Schizotypal Personality and Borderline Personality are related to schizophrenic and affective disorders, respectively. It is suggested that people with schizophrenia experience more life situations that elicit negative emotions than normal people; the same applies to people with affective disorders.
Regarding the Adjustment Inventory, Health Adjustment and Emotional Adjustment were also relevant markers of sex differences, with women scoring higher than men in these variables, and both variables being fairly good predictors of depression. In both cases, high scores on these scales indicate that the individual is experiencing a high quantity of negative emotional responses—for example, in worrying over health matters—and hence more depression. In contrast, in the THARL scales, men scored higher than women on Positive Affect from Thoughts and Positive Affect from Real Life. That means that men experience a larger quantity of life stimuli which elicit positive emotional responses. Once again, men have the advantage, since more positive emotions yield a better “emotional summation,” which means less depression. These results give general support to the psychological behaviorism principle of the additivity of emotions.
In conclusion, these findings help to explain why women present with more depression than men, and in doing so, aid the understanding of depression in general. We suggest that woman suffer more from depression because they have learned negative emotional responses to more life stimuli than men, which represents a personality trait difference. Moreover, they face more life situations that elicit negative emotions. More evidence is called for with respect to both of these factors. What circumstances make women learn negative emotions to a greater extent than men? And what is it about life that presents women with more situations that elicit negative emotions? There is a large set of social, economic, and cultural factors as well as educational practices that provide men with more opportunities to experience life situations that elicit positive emotions, as compared to women. For instance, according to the 1995 Spanish wages survey structure (Instituto Nacional de Estadística), the average salary for women is 30 % lower than for men.
This theory of sex differences in depression might be in accordance with other approaches, such as those by Brems (1995), Staats (1996, 2003), Carrillo Rojo, and Staats (1996), or Bonilla and Martínez-Benlloch (2000), who have called attention to sex differences in early education. As Claridge (1984) stated in relation to schizotypal characteristics, sex differences may reflect functional differences in hemispheric organization, but in our opinion this biological aspect can be considered a covariate, and not a determinant. We believe that learning can be the determinant of many differences between the sexes. It is important to gain further knowledge of these possibilities, since this could contribute to the prevention of certain experiences that produce depression, as well as to the treatment of depression in women once it has appeared.
References
American Psychiatric Association (1994). Diagnostic and statistical manual of mental disorders (4thed.). Washington, DC: Author.
American Psychological Association (2002). Summit on women and depression: Proceedings and recommendations. Washington, DC: Author.
Aragonés, E., Gutiérrez, M.A., Pino, M., Lucena, C., Cervera, J., & Garreta, I. (2001). Prevalencia y características de la depresión mayor y la distimia en atención primaria. Atención Primaria, 27, 623-628.
Avia, M.D., Sanz, J., Sánchez-Bernardos, M.L., Martínez-Arias, M.R., Silva, F., & Graña, J.L. (1995).The Five-Factor Model II: Relations of the NEO-PI with other personality variables. Personality and Individual Differences, 19, 81-96.
Beck, A.T., Rush, A.J., Shaw, B.F., & Emery, G. (1979). Cognitive therapy of depression. New York: Guilford Press.
Beck, A.T., Steer, R.A., & Garbin, M.G. (1988). Psychometric properties of the Beck Depression Inventory: Twenty-five years of evaluation. Clinical Psychology Review 8, 77-100. Bell, H.M. (1974). The Adjustment Inventory (3rded.). Stanford,
CA: Stanford University Press. (Cerdá’s Spanish version: Cuestionario de adaptación para adultos. Barcelona: Herder, 1980).
Bonilla, A., & Martínez-Benlloch, I. (2000). Identidades, transformación de modelos sociales y su incidencia en el ámbito educativo. In J. Fernández (Ed.), Intervención en los ámbitos de la sexología y de la generología (pp. 135-172). Madrid: Pirámide.
Brems, C. (1995). Women and depression: A comprehensive analysis. In E.E. Beckham & W.R. Leber (Eds.), Handbook of depression (pp. 539-587). New York: Guilford Press. Carrillo, J.M., & Rojo, N. (1999). Personalidad y salud:
neuroticismo y psicoticismo como predictores de salud física. Clínica y Salud, 10, 23-37.
Claridge, G., & Broks, P. (1984). Schizotypy and hemisphere function-I. Theoretical considerations and the measurement of schizotypy. Personality and Individual Differences, 5, 633-648. Costa, P.T., Jr., & McCrae, R.R. (1985). The NEO Personality
Inventory manual. Odessa, FL: Psychological Assessment Resources.
Cuadra, S. (2003). El papel de las emociones positivas y negativas en la predicción de la depresión. Unpublished doctoral dissertation, University Complutense de Madrid, Madrid. Dua, J.K. (1989). A scale to measure stress and distress. In J.L.
Sheppard (Ed.), Advances in behavioral medicine (Vol. 6, pp. 111-125). Sydney: Cumberland College of Health Sciences. Dua, J.K. (1990). Assessment of positive and negative affect as a
result of thoughts and real life experiences. Behaviour Change, 7, 62-65.
Dua, J.K., & Carrillo, J.M. (1994). Escala de pensamientos y experiencias de la vida real: determinando la relación entre afecto y salud. Análisis y Modificación de Conducta. 20, 213-226.
Eysenck, H.J., & Eysenck, S.B.G. (1975). EPQ-Personality Questionnaire for children (EPQ-J) and adults (EPQ-A). London: Hodder and Stoughton. (Spanish version: EPQ-Cuestionario de personalidad para niños (EPJ) y adultos (EPQ-A). Madrid: TEA, 1986).
Jackson, M., & Claridge, G. (1991). Reliability and validity of a Psychotic Traits Questionnaire (PTQ). British Journal of Clinical Psychology, 30, 311-323.
Kaplan, A. (1986). The “self-in-relation”: Implication for depression in women. Psychotherapy, 23, 234-242.
Katon, W., & Sullivan, M.D. (1990). Depression and chronic mental illness. Clinical Psychiatry, 51, 3-14.
Levene, H. (1960). Robust tests for equality of variances. In I. Olkins (Ed.), Contributions to probability and statistics. Stanford, CA: Stanford University Press.
McGrath, E., Keita, G.P., Strickland, B.R., & Russo, N.F. (1991). Women and depression. Washington, DC: American Psychological Association.
Mackay, C.J., Cox, T., Burrows, G.C., & Lazzerini, A.J. (1978). An inventory for the measurement of self-reported stress and arousal. British Journal of Social and Clinical Psychology, 17, 283-284.
Nolen-Hoeksema, S. (1990). Sex differences in depression. Stanford, CA: Stanford University Press.
Rappa, S. (1987). Self-esteem, assertiveness, and stress as a function of distress. Unpublished master’s thesis, University of New England, Armidale, New South Wales.
Silva, F., Avia, M.D., Sanz, J., Martínez-Arias, M.R., Graña, J.L., & Sánchez-Bernardos, M.L. (1994).The Five Factor Model I. Contribution to the structure of the NEO-PI. Personality and Individual Differences, 17, 741-753.
Staats, A.W. (1996). Behavior and personality: Psychological behaviorism. New York: Springer-Verlag.
Staats, A.W. (2003). A psychological behaviorism theory of personality. In T. Millon & M.J. Lerner (Eds.), Handbook of psychology: Vol 5. Personality and social psychology (pp.135-158). Hoboken, NJ: Wiley.
Staats, A.W., & Heiby, E.M. (1985). Paradigmatic behaviorism’s theory of depression: Unified, explanatory, and heuristic. In S. Reiss & R. Bootzin (Eds.), Theoretical issues in behavior therapy (pp. 279-330). New York: Academic Press. Stone, M.H. (1980). The borderline syndromes. New York:
McGraw-Hill.
Vázquez, C., & Sanz, J. (1991, September). Fiabilidad y validez factorial de la versión española del Inventario de Depresión de Beck. Paper presented at the Third Congress of Psychological Assessment, Barcelona, Spain.
Vázquez, C., & Sanz, J. (1997). Fiabilidad y valores normativos de la versión española del inventario para la depresión de Beck de 1978. Clínica y Salud, 8, 403-422.