B
ENJAMIN
J.
SCHERLAG, Ph.D.
From
the Division of Cardiology, Department
of
Internal Medicine,
Mount
Sinai Medical Center,
Miami Beach, Florida, and the
Department of Medicine,
University of Miami
School
of Medicine
,
Coral Gables, Florida
The technique for electrode catheter recording of consistent and stable His bundle activity presently used in the clinical laboratory was initially developed as an investigational tool ( 10, 11). In the clinical laboratory, the His bundle electrogram, in conjunc-tion with the surface electrocardiogram-a technique that has been termed His bundle-electrocardiography by Castellanos (2)-has provided a more accurate means of localizing the site of conduction abnormal-ity in patients with various forms of heart block. In addition, this technique has been utilized to study various physiological and pharmacological interven-tions (6, 12), arrhythmias (7), and the Wolff-Park-inson-White syndrome (3, 4).
Unfortunately, published reports have con-tained a variety of terms applied to the various intervals representing conduction through the atrio-ventricular transmission system. Moreover, the procedures for quantitating critical conduction mea-surements made with the use of His bundle-electro-cardiography have relied heavily upon the shape of a recorded deflection during the P-R segment and its temporal relationships to atrial or ventricular activity. Jn view of the numerous reports using His bundle recordings that are presently appearing in the literature, a critical evaluation of the His bundle electrogram and some of its applications seems appropriate.
Figure 1 shows an anterior-posterior view of the heart and the position of an electrode catheter during the recording of His bundle electrograms.
. * Presented by Dr. Scherlag at the Symposium on Car-diac Arrhythmias, June 8, 1972, at Virginia Beach, Virginia.
;.lea~e send requests for reprints to: Dr. B. Scherlag, Mount
1na1 Medical Center, 4300 Alton Road Miami Beach
Flor-ida 33140. ' '
Mcv QUARTERLY 9(1): 15-21. 1973
[n general, the His bundle electrogram is recorded by the use of a standard bipolar pacing catheter with ring electrodes 5 mm or 10 mm apart. The catheter is introduced from the femoral vein into the right heart and stabilized at the A-V ring at the base of the posterior tricuspid leaflet.
In figure 2A, electrograms from the high right atrium and from the His bundle area are shown with simultaneously recorded ECG leads. As opposed to standard electrocardiographic recordings which are usually made with relatively wide frequency response settings, that is, 0.1 to 200 Hz, the His bundle electrogram is commonly recorded with nar-rower band width limits to accentuate rapid defl ec-tions and attenuate slower waves, that is, 40 to 200 or 40 to 500 Hz. For this illustration, another bipolar catheter in the right atrium near the sinus node recorded atrial activity at the onset of the P wave. The His bundle electrogram, in conjunction with the three standard ECG leads, allows a division of the P-R interval into three components. The first is the P-A interval. This is the time from the earliest onset of the P wave ( atrial activation in the area of the sinus node), as seen in any of the surface electrocardiograms, to the onset of atrial activity in the area of the A-V junction, as seen in the His bundle electrogram. This interval is taken as a m ea-sure of a representative portion of intra-atrial con-duction, specifically the conduction time from the area of the sinus node to the area of the A-V node during normal sinus rhythm.
The A-H interval is the time from the begin-ning of the A wave to the onset of His bundle activ-ity. This interval is taken as a measure of A-V nodal conduction. In our initial study, the term P-H in-terval was used as a measure of A-V nodal
16
A
L-1
L-2
BE
(SA)(Hb)
B
L-1
P-R 120 msec P-A 35 msec A-H 53 msec
'
H-V 3 msec
I
-V, I I I
A H
I
:
/A7 :
v
I
,__...., _
_,,. __ "'\VJ
_r;, __}\
'
.,.-_,_ _ _..,._,.,....,~
...
--...,1,,_.,!\
_j
..!/\
---
·
-• 1 V - V -
V\j
V~
-
r~·i~~r
-... ~~~~500 msec~~~~----i pI l A H I
V
.25-126-BJS
- - l - ~
---·~
J .
l
)
IL-
2
IJ
i
PI-R 3i msec :J
aVR
~
; -
~---J
v
--t-
Pl.SA 132m,e,
I ~1 .
I : p
BE __
L
:I ~-
SA Pl :(SA)
~
,
1
r---r---""f>l"---.A,..._
Stimulus-t--(Hb)
duc-tion time (P-A = 35 msec); A-V nodal conduction time (A-H = 53 msec); and His-Purkinje system conduction time (H-V = 32 msec). B. Pacing at a faster rate than the sinus rate, from the recording electrodes (stimulus, Hb), produces an unchanged QRS complex in all leads with a pacer impulse (Pl) to R wave interval (Pf-R) of 31 msec, directly comparable to the previously measured H-V time, 32 msec (panel A). Pacing the His bundle from the aortic root allowed retrograde activation of the atrium (PI-SA = 132 msec). The interval between time lines equals I second. (Reproduced by permission of The American Heart Association, fnc., from B. J. Scherlag,
et al., "His Bundle Electrogram," Circulation 46:602, 1972.)
duction. Unfortunately, this term has persisted
although we now use the term A-H interval since
it represents a more accurate measure of tran
s-mission through the A-V node. Ordinarily, the A wave of the His bundle electrogram represents local
atrial activity in the immediate v1c1mty of the A-V node and therefore, eliminates the intra-atrial con
-duction between the sinus node and the low right
atrium. In addition, the A-H interval allows a com-parison of A-V nodal conduction during both sinus
A.
Sinus Rhythm
.
L-1
HR 94mlnP- A 10 msec
Hb
A- H 50 HI H- V 30 HI
----ill,~
.
.
r
A V A V
D.
Atrial Pacing
L-1
av
Pl-A 2!!msec A-H-65 I H-V. 30
r1r
n
r
n
HR 208/min
C.
Atrial Pacing
PI.-A 23 msec
I A-H ~5
v;u,
I_.;
;
~
1.-.;;u,
'\t H1J~30
'
\
i
Pl-A 24 A- H 75-150 H- V 30
/ , / · Blocked I / /
.~ \,..J,~
1....-L
W
·
\-i
~Ly.,
\
~J
,
I
I
,
.
.
r .. 1~ 1. A 'V ,A •
I,
I
I I,I
•
AVI AVL AVf 'VI VI VI V4 VIrt
:
'
'
~;i,,1I
. •··- . · . ..
.
.
....
.
...
- - ~A v A
- - v
j
,-.---... 11-...
"'""!;1,~?---1&,
BE
~
~
p.p 110 . . . .
·--·
P-11
--·
110 . . . .A·N ,n ....
·~-·
A
L-1
N·V...
·-L-2
a
VF
8H Pacing
A
Pl A Pl A
BE
IIAI- --.,"9-_ ... __, _ _ ..-\,,__ _ _ _ .,._ _ _ ,,___ .. _ " ' - - - - ~ ... _ _B
L-1
L-2
a
VF
"-" toO
....
"
•••c
....
.... 110 ••••
eoo
"
•20
"
..
"
rv
Fig. 3- Case W.A. Twelve standard ECG leads (top) show first degree block with right bundle branch block and left axis deviation.
A. Simultaneous recordings of bipolar electrogram (BE) from the area of the A-V junction and standard ECG leads L-1, L-2, and
AVF, during normal sinus rhythm. The A-H time varies between 150 and 175 msec, with variations in P-P interval. The H-V time of 95 msec remained constant. B. Simultaneous recordings of bipolar electrogram (BE) from the right atrium (RA) with standard
ECG leads L-1, L-2, and AVF, during BH pacing at a rate of 100 per minute (Pl-Pf = 600 msec). PI-R interval of 95 msec is the
same as the H-V time during normal sinus rhythm and the shape of the QRS complex remained unaltered throughout. (Reproduced by permission of The American Heart Association, Inc. from 0. S. Narula, et al. "Pervenous Pacing of the Specialized Conducting System in Man: His Bundle and A-V Nodal Stimulation." Circ11/atio11 41 :77, 1970.)
rhythm and atrial pacing because the atrial deflection used in the measurement is not ordinarily altered by the pacing site ( fig. 3). This is in contrast to the P-H measurement which cannot be accurately
compared during spontaneous rhythm and atrial
pacing since the pacer impulse is not usually applied in the area of the sinus node ( compare figs. 3A and
The H-V interval is the time required for the impulse to traverse the His-Purkinje system, that is, from the onset of His bundle activity to the earliest onset of regular ventricular muscle activity as seen on any of the ECG leads or the His bundle electrogram. The term H-Q interval has been used to describe the conduction time through the His-Purkin je system in several reports. We prefer the term H-V on the basis of the fact that a Q wave may not be present in the ventricular deflection utilized for the measurement. In addition, we have stressed the use of at least three standard ECG leads to accurately determine the time of earliest ventricular activation. The use of only one ECG lead allows the possibility that the onset of ven-tricular activation is isoelectric in that lead. This would indicate an H-V measurement which is falsely prolonged.
Since the precise anatomic location of the re-cording electrodes on a catheter cannot be ascer-tained by fluoroscopy, a recorded deflection within the P-R segment must be verified as truly represe nt-ing His bundle activity. Several criteria must be met to validate the recording as emanating from the His bundle and not from the atrium, A-V node, or the proximal bundle branches. The independence of a presumed His bundle deflection from atrial activity can be most easily obtained by right atrial pacing or induced premature atrial beats. This procedure uniformly produces a prolongation of the interval from atrial activity to the His bundle deflection (fig.
3). At rapid atrial paced rates, Wenckebach cycles can be elicited with progressive prolongation of the A-H interval and dropped beats indicating block proximal to the site of the recorded His bundle deflection.
Perhaps the most direct means of demonstrat-ing the specificity of the His bundle deflection is the use of stimulation from the recording electrode catheter. In our clinical laboratories, standard safe-guard procedures routinely utilized during tempo-rary transvenous ventricular pacing are employed during His bundle pacing. Under these circum-stances, we have found His bundle pacing no more difficult or hazardous than pacing in any other portion of the right or left ventricle. Pacing of the His bundle produces capture of the ventricles with the same QRS morphology in all ECG leads as that seen during sinus rhythm or atrial pacing ( fig. 2B). This indicates that the point of stimulation was proximal to the right or left bundle branch and must
therefore be located in the His bundle or A-V node. Note also that the interval from the pacer impulse to the onset of ventricular activity is the same as the interval from the recorded His bundle potential to ventricular activation during sinus rhythm or paced atrial rhythm. If this interval is constant over a wide range of heart rates, a pacing site in the A-V node can be eliminated since con-duction velocity in any part of the A-V node de-creases with increasing rate. On the other hand, conduction in the His-Purkinje system is virtua1ly unaffected by heart rate. We have found that these criteria for validating the His bundle potential by His hundle pacing apply equally as well in patients with normal A-V conduction as in those patients exhibiting severe disease of the His-Purkinje sys-tem (9).
Figure 4 shows tracings from a patient exhib-iting right bundle branch block with left axis devia-tion, and an H-V time which was markedly pro-longed, 95 msec. An abnormal QRS complex was simultaneously recorded in leads I, II, and A VF.
His bundle pacing reproduced the H-V time of 95 msec as well as the same QRS configuration seen in all three ECG leads during sinus rhythm.
In figure 5, this same patient showed alter-nating bilateral bundle branch block during the
study, but there were periods of left bundle branch block again with the characteristic QRS complex in all three leads, and now an H-V time of 90 msec.
Pacing from the His bundle at this time reproduced the same QRS configuration and duration in all three leads as seen during sinus rhythm. Note also that the time from the stimulus to the onset of the earliest ventricular activity is the same with this bundle branch block pattern as the measured H-V time seen during sinus rhythm.
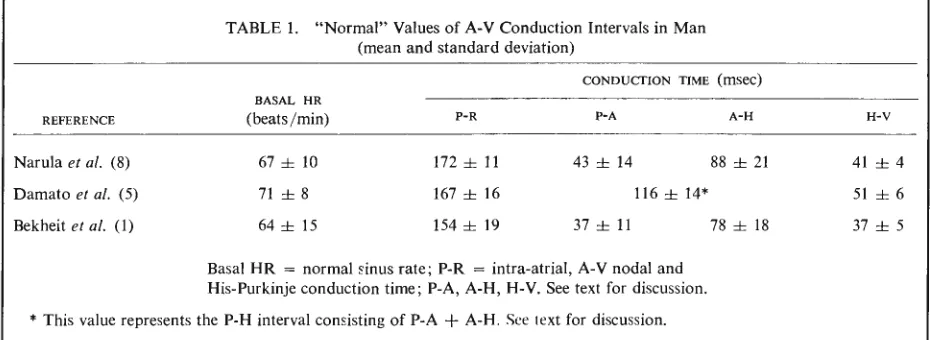
At this point, the matter of normal and ab-normal H-V time should be mentioned. Normal values for A-V conduction have been battered about somewhat in the recent literature; therefore, we have scrutinized three published studies in which recordings from the His bundle have been obtained from 51 adult patients with so-called normal A-V conduction, that is, a P-R interval of 200 msec or less. Table I is a statistical analysis of the values from these various studies. It can be seen that the values in the study by Narula et al. (8) as well as
20
v Pl A
BH A BH
BE
p.p1150 fflHC 640 mHc
P-R 290 fflHC
A·H 180 fflHC
A
L-1
H-V 90 maf!'C 90 fflHCL-2
a
VF
BH Pacing
BEtRA---
"
B
L-1
L-2
a
VF
1421
Fig. 4- Case W.A. Twelve standard ECG leads (top) from the same patient as in figure 3, whose pattern changed during study from right bundle branch block to left bundle branch block. A. Simultaneous bipolar electrograms (BE) recorded from the area of the A-V junction and standard ECG leads L-1, L-2, and AVF. The A-H time at P-P interval of 850 msec was 180 msec. The induced (Pl) premature atrial systole (A) at P-P interval of 640 msec either blocked and was followed by an A-V junctional escape beat or
conducted with an extremely prolonged A-H time. The H-V time of 90 msec was constant throughout. B. Bundle of His pacing at a rate of 100 per minute (PI-PI = 600 msec). The PI-R interval of 90 msec is equal to the H-V time during normal sinus rhythm. The
shape of the QRS complex remains unaltered throughout. (Reproduced by permission of The American Heart Association, Inc. from 0. S. Narula, et al. "Pervenous Pacing of the Specialized Conducting System in Man: His Bundle and A-V Nodal Stimulation."
Circulatio11 41 :77, 1970.)
for heart rate P-R, P-A, A-H intervals in all three studies show good agreement. The lower and upper limits for the H-V interval, that is ±2 standard
deviations, in the last two studies are also in close accord, giving a range of 33 to 49 msec and 27 to 4 7 msec, respectively. In the study by Damato
et al. ( 5), the H-V intervals averaged 51 ± 12 with
a range of 39 to 63 msec. Other laboratories have reported normal values of 35 to 55 msec, and in a
TABLE 1. "Normal" Values of A-V Conduction Intervals in Man (mean and standard deviation)
CONDUCTION TIME (msec) BASAL HR
REFERENCE (beats/min) P-R P-A A-H H-V
Narula et al. (8) 67 ± 10 172 ± 11 43 ± 14 88 ± 21 41 ± 4
51 ± 6
37 ± 5
Damato et al. (5) 71 ± 8 167 ± 16 116 ± 14*
Bekheit et al. (I) 64 ± 15 154 ± 19 37 ± 11 78 ± 18
Basal HR = normal sinus rate; P-R = intra-atrial, A-V nodal and
His-Purkinje conduction time; P-A, A-H, H-V. See text for discussion.
* This value represents the P-H interval consisting of P-A
+
A-H. See text for discussion.(Reproduced by permission of The American Heart Association, Inc. from B. J. Scherlag, et al., "His Bundle Electrogram," Circula-tion 46:606, 1972.)
data have been published to substantiate these ranges and average values. It should be emphasized that the determination of normal limits is of more than academic interest. Basic studies as well as recent clinical reports indicate a close association between prolongation of the H-V time and the existence of partial or complete bilateral bundle branch block. Other reports have shown a correspondence between an abbreviated A-H or H-V interval and anomalous A-V conduction.
It is generally considered that His bundle-elec-trocardiography has provided a more direct means for electrophysiological and diagnostic study of various clinical problems. However, these interpre-tations and diagnoses based on His bundle record-ings must stand up to critical quantitative verification of the presumed His bundle deflection. Quantitative determinations of the interpretations based on His bundle-electrocardiographic measurements are crit-ical, and in order to facilitate such determinations, greater standardization of measurements and termi-nology is required.
Author's note: We thank Mrs. Marie Ellis for
her dedicated assistance in the preparation of this
manuscript.
REFERENCES
1. BEKHEIT, S., MURTAGH, J. G., MORTON, P., et al.
Mea-surements of sinus impulse conduction from the
electro-gram of bundle of His. Brit. Heart/. 33:719, 1971.
2. CASTELLANOS, A., CASTILLO, c., LEMBERG, L., et al. His
bundle-electrocardiography: A programmed introduc-tion. Chest 57: 350, 1970.
3. CASTELLANOS, A., CHAPUNOFF, E., CASTILLO,
c.,
et al.His bundle electrograms in 2 cases of
Wolff-Parkinson-White (pre-excitation) syndrome. Circulation 41: 399,
1970.
4. CASTILLO, C. AND CASTELLANOS, A. His bundle
record-ings in patients with reciprocating tachycardias and
Wolff-Parkinson-White syndrome. Circulation 42 :271,
1970.
5. DAMATO, A. N., LAU, S. H., HELFANT, R. H., et al.
Study of A-V conduction in man using electrode
cath-eter recordings of His bundle activity. Circulation 39:
287, 1969.
6. DAMATO, A. N. AND LAU, S. H. Clinical value of the
electrogram of the conduction system. Prag. in
Cardio-vasc. Dis. 13:119, 1970.
7. LAU, S. H., DAMATO, A. N., BERKOWITZ, W. D., et al.
A study of atrioventricular conduction in atrial fibrilla-tion and flutter in man using His bundle recordings.
Circulation 40:71, 1969.
8. NARULA, 0. S., COHEN, L. S., SAMET, P., et al.
Local-ization of A-V conduction defects in man by recording
of His bundle electrograms. Amer. /. Cordial. 25:228,
1970.
9. NARULA, 0. s., SCHERLAG, 8. J., AND SAMET, P.
Per-venous pacing of the specialized conducting system in
man: His bundle and A-V nodal stimulation.
Circula-tion 41 :77, 1970.
10. SCHERLAG, 8. J., HELFANT, R. H., AND DAMATO, A. N.
Catheterization technique for His bundle stimulation
and recording in the intact dog./. Appl. Physiol. 25:425,
1968.
11. SCHERLAG, 8. J., KosoWSKY, G.D., AND DAMATO, A. N.
Technique for ventricular pacing from the His bundle
of the intact heart./. Appl. Physiol. 22:584, 1967.
12. SCHERLAG, 8. J., NARULA, 0. S., LISTER, J.
w.,
et al.Analysis of atrioventricular conduction by direct