Doctor of Education (EdD) Theses and Dissertations
1-1-2018
Identifying Students at Risk of Dropping out:
Indicators and Thresholds Using ROC Analysis
Susan E. CarlsonThis research is a product of the Doctor of Education (EdD) program at George Fox University.Find out moreabout the program.
This Dissertation is brought to you for free and open access by the Theses and Dissertations at Digital Commons @ George Fox University. It has been accepted for inclusion in Doctor of Education (EdD) by an authorized administrator of Digital Commons @ George Fox University. For more information, please [email protected].
Recommended Citation
Carlson, Susan E., "Identifying Students at Risk of Dropping out: Indicators and Thresholds Using ROC Analysis" (2018).Doctor of Education (EdD). 114.
IDENTIFYING STUDENTS AT RISK OF DROPPING OUT: INDICATORS AND
THRESHOLDS USING ROC ANALYSIS
by
SUSAN E. CARLSON
FACULTY RESEARCH COMMITTEE:
Chair: Dane C. Joseph, Ph.D.
Member: Susanna M. Thornhill, Ph.D.
Member: Linda Samek, Ed.D.
Presented to the Doctoral Department
and College of Education, George Fox University
In partial fulfillment of the requirements for the degree of
Doctor of Education
ABSTRACT
Each year a significant percentage of high school students in the United States do not graduate.
School practitioners need accurate indicators for identifying potential dropouts in order to focus
scarce intervention resources on students most in need. While the process of dropping out is
complex, indicators measured at the end of students’ ninth-grade year provide information
regarding their future graduation outcome. The current study used receiver operating
characteristic (ROC) empirical curves to assess the accuracy of three ninth-grade risk factors,
GPA, credits earned, and over-age status, in predicting the likelihood that students sampled for
the National Center for Education Statistics High School Longitudinal Survey of 2009, dropped
out of high school. The results showed that all three gave better than chance predictions. GPA
had a 74 percent probability of correctly distinguishing between dropouts and graduates. The cut
point of GPA less than 1.7 identified 48 percent of the dropouts, 88 percent of the graduates, and
had a false positive rate of 12 percent. The three indicators provide quantitative data for
identifying students at the end of ninth grade who may benefit from strategies designed to keep
them on track for graduation. School practitioners may want to conduct a similar analysis using
their district data to assess the accuracy of the risk factors for their specific student population.
Keywords: High School Dropout, Receiver Operating Characteristic Curve, Area Under the
ACKNOWLEDGEMENTS
This dissertation, like so many others, rests on the shoulders of those who came before. I
am grateful for the tireless and passionate work of the researchers referenced in these pages.
Their search to understand the dropout problem and the factors associated with early high school
identification of students at risk inspired my own. Thank you to the National Center for
Education Statistics for conducting comprehensive national longitudinal surveys and for making
the collected data available for public use.
Thank you to my dissertation committee for sticking with me though a year-long leave of
absence and welcoming me back with encouragement. Dane, as my dissertation chair, you asked
timely questions, guided me through the technicalities of formatting, and prompted me to
investigate more deeply the missing data issue. I always walk away from our conversations
refreshed and inspired that my work is important. Thank you. Susanna, I am grateful for the
qualitative perspective you brought to my committee. Your comments, questions, and request for
clearer explanations made these pages not only read better but communicate what I was trying to
say. Linda, back when I first met you as my statistics professor, I could not have imagined
applying those principles to my own research. Thank you for being so interested in this project
and taking time away from your busy schedule to support me.
These pages would not have been possible without the consistent support of my husband.
Kris, you opened space in our lives so that I could focus on my research. Thank you for being
fully present as I wrestled with concepts and ran ideas by you in the evenings after a long day at
work. You knew I could do this and made me believe I could too.
Lastly, and most importantly, I acknowledge my Heavenly Father through whom all
supplies the words. Thank you, Lord, for the gifts of a sound mind, curiosity, and persistence.
TABLE OF CONTENTS
ABSTRACT ... ii
ACKNOWLEDGEMENTS ... iii
TABLE OF CONTENTS ... v
LIST OF TABLES ... x
LIST OF FIGURES ... xi
CHAPTER 1 ... 1
Introduction ... 1
Rationale of the Study ... 3
Purpose of Study ... 5
Research Questions ... 7
Significance of the Study ... 7
Key Terms, Delimitations, and Limitations ... 10
Early Warning Indicators. ... 10
Graduates. ... 10
Dropouts. ... 10
GPA... 10
Credits earned. ... 11
Over-age status... 11
Sensitivity. ... 11
Specificity. ... 12
Receiver operating characteristic (ROC) empirical curve. ... 12
Limitations. ... 13
Summary ... 14
CHAPTER 2 ... 16
Literature Review... 16
Conceptual Framework ... 17
The turbulent transition year. ... 19
Early Warning Indicators. ... 21
GPA... 24
Credits earned. ... 26
Over-age status... 27
Predicting Dropout ... 30
Receiver operating characteristic (ROC). ... 31
Assessing accuracy of predictions. ... 33
School and Community Influences ... 38
Push factors. ... 39
Pull factors. ... 41
Summary ... 43
CHAPTER 3 ... 46
Methodology ... 46
Design ... 46
Theoretical framework. ... 47
Sampling & Participants ... 48
Advantages. ... 48
Sampling. ... 49
Appropriate number of participants ... 50
Instrumentation & Administration ... 51
2009 Base Year survey ... 53
2013 Transcript Collection ... 54
Analytic weights ... 55
Data imputation ... 56
Analytics ... 57
Missing values. ... 58
Independent and dependent variables. ... 59
Data download procedures. ... 63
SAS® and ROC analysis ... 64
Limitations ... 68
Role of the Researcher ... 70
Research Ethics ... 71
CHAPTER 4 ... 72
Results ... 72
Data Recoding and Analysis ... 72
Description of the HSLS:09 Sample ... 74
Independent Variables ... 76
Tests for Association... 78
Research Questions ... 83
Research Question 1: How accurately do the ninth-grade indicators of GPA, credits earned, and over-age status predict the likelihood that students from the HSLS:09 dropped out of high school? ... 83
Research Question 2: What are the threshold values for each indicator that optimize three criteria: maximum distance from chance, minimum distance to perfect prediction, and equality of sensitivity and specificity? ... 87
Conclusion ... 92
CHAPTER 5 ... 94
Discussion and Conclusions ... 94
Introduction ... 94
Discussion of Findings ... 95
Dropout. ... 95
Early Warning Indicators predict dropout. ... 97
Receiver operating characteristic curves and threshold values. ... 99
Limitations ... 101
Implications for Practitioners ... 102
Suggestions for Future Analysis ... 103
Conclusions ... 105
References ... 108
APPENDICES ... 123
Appendix B: Human Subjects Research Committee Approval ... 127
LIST OF TABLES
Table 1 Missing Pattern for the Four Variables of Interest ... 73
Table 2 Frequencies of Missing Observations for all Variables in the Analytic Sample ... 73
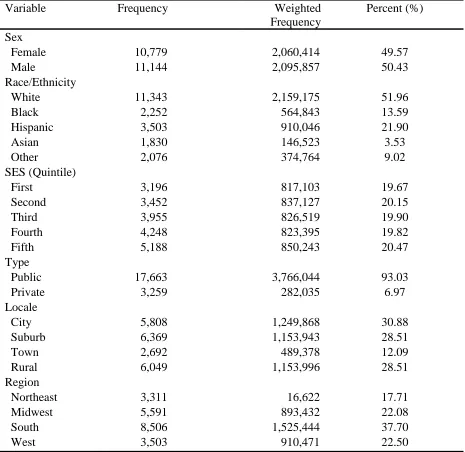
Table 3 Frequencies of Demographic Variables in the Analytic Sample ... 76
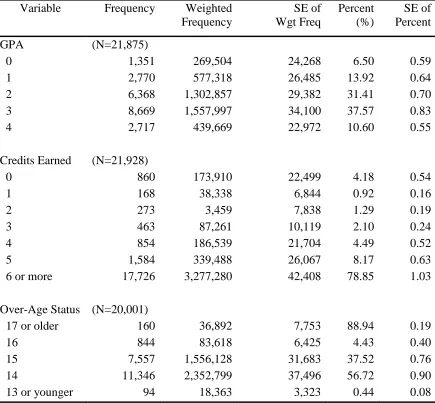
Table 4 Frequencies for Each Category of the Independent Variables ... 77
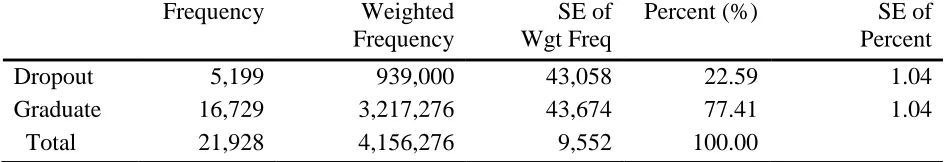
Table 5 Frequencies for Each Category of the Dependent Variable ... 78
Table 6 Bivariate Analysis of GPA by Dropout ... 79
Table 7 Bivariate Analysis of Credits Earned by Dropout ... 80
Table 8 Bivariate Analysis of Overage Status by Dropout ... 81
Table 9 Summary of Bivariate Analysis Tests for Association of Each Indicator by Dropout .... 83
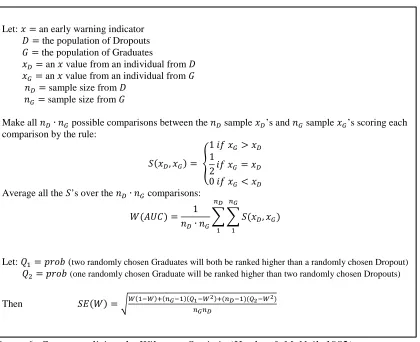
Table 10 Wilcoxon Statistic for Area Under the ROC Empirical Curve for Each Indicator by Dropout ... 87
Table 11 Cut Points for Each Indicator that Optimized the Common Decision Criteria ... 89
LIST OF FIGURES
Figure 1: ROC of All Dropout Flags (Bowers, Sprott, & Taff, 2013, p. 94) ... 4
Figure 2: Example of ROC Empirical Curve ... 13
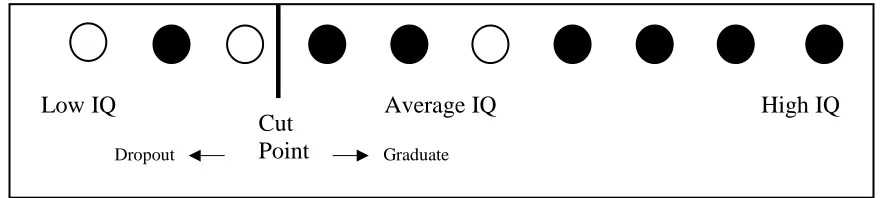
Figure 3: Cut Point for IQ to Classify Dropping Out of High School ... 35
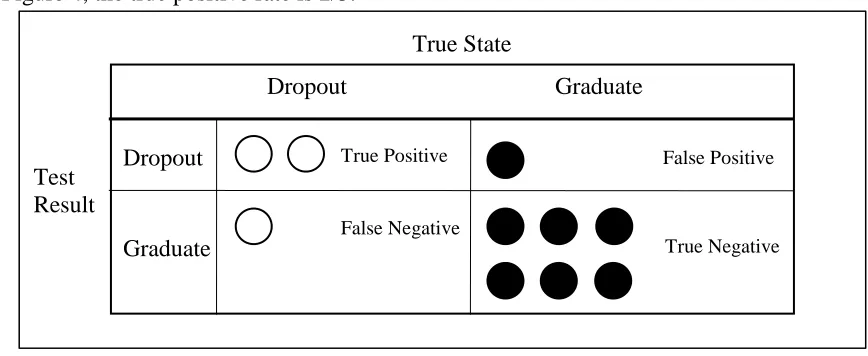
Figure 4: Two-by-two Matrix for the Cut Point in Figure 3 ... 36
Figure 5: ROC Curve of Cut Points One and Two ... 37
Figure 6: Conceptualizing the Wilcoxon Statistic (Hanley & McNeil, 1982) ... 66
Figure 7: GPA by Dropout ROC Empirical Curve ... 84
Figure 8: Credits Earned by Dropout ROC Empirical Curve ... 85
CHAPTER 1
Introduction
Fourteen years ago, our school district, comprised of one comprehensive high school,
realized there was a significant number of students each year teetering on the edge of dropping
out. The district had been experiencing rapid growth due to the influx of high-tech companies
and their affluent employees. Gone were the small-town days when most families worked for the
mill and students grew up together. New schools were built, class sizes expanded and curriculum
was enhanced to meet the expectations of students preparing for prestigious universities. In the
midst of this growth, passionate teachers and concerned parents convinced the district to invest
in struggling students by opening an alternative school in a wing of the main high school. Under
the leadership of the assistant administrator, the small school began educating a group of
students identified as needing intervention. Students with course failures, low credits, behavioral
referrals, high detention hours, and high absenteeism were given the opportunity to attend. The
administrator interviewed each potential student and handpicked the first three teachers. Under
their model of a daily 100-minute academic block schedule, small class sizes, differentiated
instruction and assessment, teacher support, and a caring community, the students thrived. Their
engagement increased and behavior problems decreased. Students passed classes they previously
failed and regained their missing credits. Best of all, students who never thought they would
graduate walked across the stage in June confident in their plans for a brighter future.
Today, the school operates within its own building, which the district designed
specifically for it. The enrollment has grown from 60 to 150 students. The original administrator
still interviews each potential student and handpicks her team of eight certified staff. For two
know, appreciate, and care deeply for students teetering on the edge of dropping out. I used to
ask students to share their stories of why they chose our school. They would tell the same story,
over and over. The students walking our halls just could not make it at the big high school on the
hill. Some, like one student who found herself pregnant at 17, were pushed out. Others were
pulled out by work, family responsibilities, or illness. Some were angry, others withdrawn. Some
fell away due to losing interest in school, falling behind in credits, experimenting with drugs, or
getting in trouble with the law. Others drifted away by missing so much class time it was
impossible for them to recover. Still others were bullied, shamed, teased, or ostracized for being
different. No matter what reasons they shared, all were wounded in some way.
At least that is how we teachers described them during lunch in the staff room. We
always talked about our students, especially the new ones. With new students, our first order of
business was to gain their trust, learn their story, and understand their unique learning needs. So,
we shared what we learned and discussed the best ways to entice the new students to engage in
this very different high school environment. Usually, it did not take long for our school’s family
atmosphere, air of respect, and culture of care to melt the protective walls students erected. Then
the real work of learning would begin.
We teachers also strategized how we could get our students earlier, before their junior or
senior year, before they picked up the burden of failures; before they lost confidence in their
intelligence. How, we asked, could we help students, parents, and teachers identify students
during their freshman year or earlier, and choose them to thrive in our alternative learning
environment? That question became the foundation for my research study. School personnel
indicators that will identify students likely to drop out while not falsely labeling those who will
likely not need intervention to graduate.
Rationale of the Study
This background indicates the beginnings of my quest to identify the most predictive
indicators for students in need of support. A survey of the literature on the topic of high school
dropouts informed me that the research is both extensive and deep. Longitudinal studies identify
factors in early childhood, such as early home environment and quality of early care giving, that
influence students’ later decisions to drop out of high school (Jimerson, Egeland, Sroufe, &
Carlson, 2000). Other studies dive deep into investigating the ways that dropouts differ from
graduates resulting in checklists of factors such as the On-Track indicator used by the
Consortium on Chicago School Research (Allensworth & Easton, 2005). Still others built models
to describe life-course perspectives (Alexander, Entwisle, & Kabbani, 2001), students’
mathematics developmental growth pathways (Muthan, 2004), and student engagement
trajectories (Janosz, Archambault, Morizot, & Pagani, 2008), all of which hint at a causal
relationship between student characteristics and graduation outcomes. While each research study
added to my growing knowledge of predictive indicators, it was difficult to identify what
research might be most useful to us as teachers at the alternative school. Which factors are most
accurate, accessible, and likely to be responsive to intervention? Probabilities and log-odds ratios
are meaningful for academia but fail to offer the detailed information that we can understand and
put into practice.
Then I found Bowers, Sprott, and Taff’s (2013) comprehensive review of 36 research
studies containing 110 indicators of students at-risk of dropping out of high school. They
student-level characteristics that are most accurate, simple to obtain and usable for schools.
Beyond that, their research identified factors that are under the influence of schools rather than
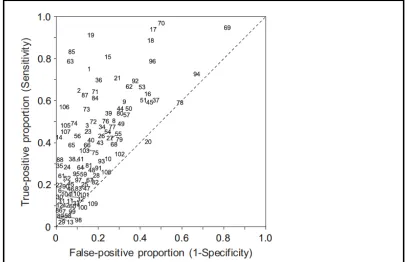
demographics. Using the principles of receiver operating characteristics (ROC) analysis, they
graphed the true-positive proportion (the percentage of dropouts with the flag) against the
false-positive proportion (the percentage of graduates with the flag) of each indicator (see Figure 1).
The relative position of each indicator to the reference point of perfect sensitivity indicated how
accurately the flag identified dropouts without falsely identifying students who later graduated.
In other words, a flag which correctly identified a higher proportion of dropouts without
incorrectly classifying graduates as dropouts occupied a position closer to the upper left corner of
the graph.
Figure 1: ROC of All Dropout Flags (Bowers, Sprott, & Taff, 2013, p. 94)
This review by Bowers et al. (2013) intrigued me for two reasons. First, they were
searching for the type of indicators that could potentially be useful to us teachers at the
alternative school. Second, they used the principles of ROC analysis but stopped short of
conducting a full analysis which would have given threshold values for each indicator. Threshold
values could give information regarding how many failed courses and how low of a grade point
average (GPA) accurately predicts students’ later dropout decisions. This information could help
teachers identify students at the end of their ninth-grade year that are off-course for successful
graduation.
This research study extended Bowers et al. (2013) by examining the top three dropout
flags (GPA, credits earned, and over-age status) that are readily available to school personnel. It
used ROC analysis to report the strength of each flag in predicting dropout. The resulting
empirical ROC curves were used to identify potential threshold values to aid future
decision-makers in allocating intervention resources.
Purpose of Study
The purpose of this study was to examine the accuracy and precision of ninth-grade
indicators in predicting whether students will likely drop out of high school. Building on the
theory that dropping out is a cumulative process of disengagement and withdrawal (Alexander et
al., 2001; Jimerson et al., 2000), and extending the conceptualization of the diagnostic utility of
ninth-grade indicators (Johnson & Semmelroth, 2010; Jordan, Glutting, Ramineni, & Watkins,
2010), this study used GPA, credits earned, and over-age status to predict the likelihood of
students’ future decisions to drop out. Over-age status was defined as the number of years a
student was older than the typical ninth-grade age of 14 years old. Receiver operating
National Center for Education Statistics High School Longitudinal Study (HSLS:09) Base Year
(2009) in predicting dropping out, as indicated in the HSLS:09 High School Transcript (2013)
data. In the HSLS:09, a nationally representative sample of students were surveyed at the end of
ninth grade and transcripts were collected the year following their expected four-year graduation
date (Ingels et al., 2011; Ingels et al., 2015).
In addition, the ROC curves were evaluated for three threshold values based on typical
decision criteria. The threshold values could be used by school staff, providing timely
information in the form of possible cut scores, to identify students at the end of ninth grade who
were likely to drop out. This study conceptualized identification of dropouts as a first step in a
process of guiding all students toward successful graduation. The root causes of students’
decisions to leave high school before earning a diploma are complex. The range of problems and
issues require individualized intervention strategies tailored to the needs of diverse students
(Dynarski & Gleason, 2002). Given the high cost of interventions, this study could give teachers
a tool for allocating limited school resources to students most in need.
While the goal of this study was to produce threshold values significant to a nationally
representative sample, it offers the analysis process as a tool for future research. This study could
be extended by using logistic regression to build a model with all three indicators combined.
ROC analysis could provide threshold values for a model significant to a nationally
representative sample. Additionally, regionally-specific logistic regression models could be
compared with the population model using area under the curve (AUC) analysis. If they differ
significantly it would support previous research that threshold values vary by local context
their student data to produce a specific high yield predictive model (Dynarski & Gleason, 2002)
and threshold values unique to their student population.
Research Questions
1. How accurately do the ninth-grade indicators of GPA, credits earned, and over-age
status predict the likelihood that students from the HSLS:09 dropped out of high
school?
2. What are the threshold values for each indicator that optimize three criteria:
maximum distance from chance, minimum distance to perfect prediction, and equality
of sensitivity and specificity?
Significance of the Study
In the 2014-2015 school year 83 percent of students in the United States graduated with a
high school diploma within four years of starting ninth grade (National Center of Education
Statistics, 2017b). The other seventeen percent of students earned a GED, received a certificate
of completion, were still enrolled, or dropped out. A separate report by the National Center of
Education Statistics (2017a) states that in 2015, 5.9% of 38,491,000 individuals aged 16-24 were
not enrolled in high school and lacked a high school credential. That translates to 2,270,969
persons who entered the workplace without the educational attainment research shows to be
related to successful participation. Students who drop out of high school earn lower-wages
(Rouse, 2007), have diminished health and shorter life-spans (Muennig, 2007), participate in
more criminal activities (Moretti, 2007), and are more likely to live on welfare (Waldfogel,
Garfinkel, & Kelly, 2007) than individuals who graduate.
School personnel need indicators to identify potential dropouts for intervention. For
identify students at-risk and match interventions to students’ characteristics (Dynarski &
Gleason, 2002). “Even the highest quality dropout prevention programs will have little influence
on the dropout problem if risk factors identify the wrong students (i.e., those who would not
otherwise have dropped out)” (Gleason & Dynarski, 2002, p. 25).
While it might seem prudent to identify risk factors that over-capture students likely to
drop out, limited school resources necessitate targeting students in real need of help who will
most benefit from interventions. Thus, school staff need indicators that accurately identify
students likely to drop out while not misidentifying students who would likely graduate. ROC
analysis provides a statistical tool to balance this need for sensitivity and specificity (Zou,
O’Malley, & Mauri, 2007).
This study focused on three indicators, GPA, credits earned, and over-age status, which
meet Bower, Sprott, and Taff’s (2002) criteria of being accurate, simple to obtain, usable by
schools, and under the influence of schools rather than demographics. Research shows that not
only are GPA and credits earned, which is a proxy for course failures, simple to obtain, but they
are also good predictors of graduation outcomes when measured at the end of ninth grade
(Allensworth & Easton, 2007). GPA and credits earned can be positively influenced by such
in-school practices as tutoring and credit recovery. Over-age status is a proxy for grade retention
and is easily measured from students’ birthdates. Research shows that over-age students are more
likely to drop out (MacIver & Messel, 2012). Even though schools cannot influence the prior
grade retention of ninth-grade students nor the age at which they entered kindergarten, they can
create caring and supportive environments in which older students feel accepted rather than
This study sought to provide a tool for identifying students who could possibly benefit
from intervention. It assumed that identification does not necessitate labeling of students. It
assumed that school personnel in general, and teachers in particular will use the tool with
professional discretion and educational care as a first step in a research-based dropout prevention
program. Teachers assess students’ needs continually over the course of a class period. Student
attitudes, behaviors, absences, assignment completion, quality of work, and test scores are a few
indicators teachers utilize to measure students’ educational growth, classroom engagement, and
academic achievement. Teachers use these indicators to select students who may need extra
instruction, targeted conversations, and/or referrals to additional in-school resources. After
selecting students, teachers typically perform other assessments, as informal as conversations or
as formal as additional testing, to determine the validity and extent of students’ needs. None of
the indicators perfectly identify students in need. Some, like students’ attitudes and participation,
are naturally assessed through teachers’ own biases regarding their assumptions of what
constitutes successful student behaviors. ROC analysis of GPA, credits earned, and over-age
status could provide teachers with a quantitative set of indicators offering better-than-chance
accuracy in identifying students who may need intervention.
This research offered an analysis of a recent national data set to the growing body of
ROC education literature. By using ROC curves to analyze the diagnostic strength of three
ninth-grade early warning indicators of the likelihood for students’ future decisions to drop out
of high school, I hoped to provide school staff with a set of easily accessible indicators with high
Key Terms, Delimitations, and Limitations
Early Warning Indicators. These were ninth-grade measures of high school outcomes
(MacIver, 2013). The purpose of the indicators was to identify students in ninth grade who are
showing signs of failure or withdrawal, who are off-track for on-time graduation in four years
(Allensworth, 2013).
Graduates. Utilizing the definition used in the formula to calculate the adjusted cohort
graduation rate (Curran, Reyna, & NGA, 2009; National Center for Education Statistics, 2017b),
this study identified graduates as students who earned their high school diplomas within four
years of ninth grade. In the HSLS:09 these students’ transcripts indicated “Fall 2012-summer
2013 graduate,” and “Pre-fall 2012 graduate.” They received their high school diploma early or
on-time, it was the gold standard (Zou, O’Malley, & Mauri, 2007).
Dropouts. For the purposes of this study dropouts were students who did not earn their
diploma within four years of ninth grade. These were the students in the HSLS:09 whose
transcripts indicated “Dropped out,” “Left other reason,” or “Graduation date unknown.” Since
students who were still enrolled may have later received their certificate of completion, or earned
an alternative certificate, yet did not receive a diploma, they were also considered dropouts for
the purposes of this study. Including these additional categories in drop-out statistics was
consistent with research indicating that some students are pushed out, while others are pulled out
(Doll, Eslami, and Walters, 2013), and still others opt out (Schubert, 2009).
GPA. Students’ GPA was calculated across all credit-bearing courses taken in their
ninth-grade year. Previous research indicates that ninth-grade GPA is a strong predictor of future
on-time graduation (Allensworth & Easton, 2007; Johnson & Semmelroth, 2010; MacIver &
Credits earned.In high school, students earn credits for each class in which they receive
a passing grade. Since failed courses result in unearned credits, credits earned served as a proxy
for course failures. Course failures are directly tied to graduation because students need to
accumulate a minimum number of credits to graduate. Previous research indicates that course
failures and unearned credits give indications of students’ lack of progress toward on-time
graduation (Allensworth & Easton, 2007).
Over-age status. The typical age of students upon entry to ninth grade is 14, therefore,
students age 15 and older are considered over-age. For the purpose of this study, over-age status
served as a proxy for grade retention (Allensworth & Easton, 2007). It was measured in years
and calculated by subtracting students’ birth year from 2009, the year of the survey. According
to MacIver and Messel (2013), this was a conservative representation. It included some students
whose parents may have delayed entry into kindergarten. It excluded some students who may
have been retained. For example, students who entered kindergarten a few months shy of their
fifth birthdays, if retained, would have been a few months shy of 15 when they entered ninth
grade. These retained students would not be captured by the variable over-age status.
Sensitivity. Sensitivity referred to the precision of the early warning indicator to identify
true dropouts. It was the true-positive proportion, the number of true-positives divided by the
total number of actual dropouts (Bowers et al., 2013). For example, among a sample of 10
students for whom their true graduation status was known, three were dropouts and seven were
graduates. If a predictor of GPA = 0.5 correctly identified 2 as dropouts, then the sensitivity was
2/3 or 0.67. Sensitivity represented the probability that a student with GPA less than or equal to
Specificity. Specificity referred to the precision of an early warning indicator to identify
true graduates. It was the true-negative proportion, the number of true-negatives divided by the
total number of graduates (Bowers et al., 2013). Continuing with the example above, if GPA =
0.5 correctly identified 6 of the 7 graduates then the specificity was 6/7 or 0.86. The specificity
represented the probability that a student with GPA greater than 0.5 will be correctly identified
as a graduate (Gönen, 2007).
1-Specificity. This term referred to the error in the predictive value of an early warning
indicator. It was the false-positive proportion, the number of false-positives divided by the total
number of graduates (Bowers et al., 2013). It was also referred to as the false-positive rate
(Gönen, 2007). Continuing with the previous example, if GPA = 0.5 identified one student as a
dropout whose known status was a graduate, then the 1-specificity was 1/7 or 0.14. It was the
probability that a student with GPA less than or equal to 0.5 will be misclassified as dropout. In
this example, there was a 14% probability that GPA will identify a student who has a GPA less
than or equal to 0.5 as a dropout but who will likely graduate.
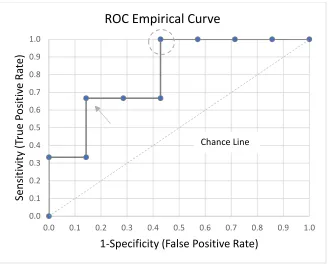
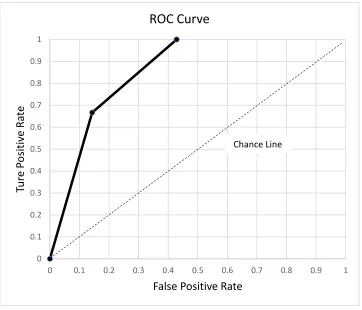
Receiver operating characteristic (ROC) empirical curve. The ROC empirical curve was
drawn on a graph whose axes were 1-specificity (x-axis) and sensitivity (y-axis). It was a graph
of “hits” versus “misses” (Bowers et al., 2013) at each possible cut point. It allowed the
researcher to analyze the tradeoff at each threshold value of the indicator. Continuing with the
above example in which GPA was being analyzed as a predictor variable in a sample of 10
students whose true graduation status was known, ROC analysis began with ranking students by
GPA. Then the 1-specificty and sensitivity was calculated at each threshold value of GPA and
the results were plotted on the ROC graph. Figure 2 contains the plot of 1-specificity and
(false positive rate) of 0.14 and the sensitivity (true positive rate) of 0.67, is designated with an
arrow. A good indicator will produce a curve well above the diagonal chance line. The area
under the curve (AUC) represented the probability of GPA correctly distinguishing dropouts
from graduates. In this example the AUC was 0.86, 86% of the dropouts will have a lower GPA
than graduates. The empirical curve was further analyzed for cut scores that optimized decision
criteria. For example, the cut-score that was farthest from chance is indicated by the dashed
circle in Figure 2.
Figure 2: Example of ROC Empirical Curve
Limitations. There were potential limitations due to two sources of missing data. The
National Center for Education Statistics High School Longitudinal Survey 2009 (HSLS:09)
expended extra effort to realize the nationally-representative sample target of 800 schools (Ingles
et al., 2011). However, of the 1,899 study-eligible schools, 945 refused to participate and
additional 197 schools rescinded their participation after initial agreement. Of the 197 schools,
44 converted to participation after a personal visit from a HSLS:09 representative. The reasons
0.0 0.1 0.2 0.3 0.4 0.5 0.6 0.7 0.8 0.9 1.0
0.0 0.1 0.2 0.3 0.4 0.5 0.6 0.7 0.8 0.9 1.0
Se ns itiv ity (T ru e Po sit iv e R at e)
1-Specificity (False Positive Rate)
ROC Empirical Curve
given for refusing to participate included concerns about the extra work for staff, the loss of
instructional time, and over-testing of students. Forty percent of refusing schools cited time
constraints and being too busy to take on the additional tasks required by the study. Thirty-one
percent gave the general refusal of “Don’t want to participate.” While it was beyond the scope of
this study to analyze these refusal reasons and rates, it is important to note that students from
50% of the eligible schools are not represented in the data. The result of this study were
potentially limited to schools willing to participate in the study.
A second source of missing data came from the time lapse between receiving the
ninth-grade student enrollment lists in early September and the scheduled session for students to
take the survey. One thousand of the study-eligible students on the lists were not enrolled in
school on the day of the student survey session (Ingels et al., 2011). These students were on the
enrollment books but had never attended the school or had left the school prior to the survey
session. This study was potentially limited to ninth-grade students enrolled in school at the time
the student survey was administered.
Summary
Early warning indicators measured at the end of ninth grade offer information useful for
identifying students likely to benefit from dropout intervention strategies. Prior research has
identified GPA, credits earned, and over-age status as indicators that predict the likelihood of
students dropping out of high school. Additionally, these three indicators are readily available to
school personnel and open to the influence of school-base intervention strategies. This study
applied receiver operating characteristic curves on data from the National Center of Education
Statistics High School Longitudinal Survey 2009, to assess the accuracy of the indicators
ROC curves were used to identify threshold values that optimized common decision criteria.
Every day teachers use a variety of assessments to identify students in need of additional
instruction and support. This study offered ROC analysis as an additional tool for teachers to use
CHAPTER 2
Literature Review
Students who decide to leave school before earning a diploma are called dropouts;
however, “… the label never captures the complexity of the biography” (Cameron, 2012, p. xxv).
While each student’s decision is the result of a unique and complex variety of factors and
influences, the first section of this chapter examines the dimensions of the dropout phenomena to
provide a conceptual framework for this research. The critical importance, as described in the
literature, of examining warning signs in students’ transition to high school, typically measured
at the end of their ninth-grade year, is discussed. Then, research regarding the development and
predictive value of early warning indicators in general is reviewed, followed by an individual
examination of GPA, credits earned, and over-age status indicators. This first section builds
support for the central thesis that early warning indicators, specifically GPA, credits earned, and
over-age status, measured at the end of ninth grade offer important information regarding
students’ progress toward on-time graduation four years later.
The second section of this chapter discusses the literature on the technical aspects of
predicting dropout. Current educational research using ROC analysis is reviewed. Then the
utility of ROC curves in assessing the accuracy of predictions is examined. An example of
calculating the ROC is provided as a visual reference.
After support for early warning indicators is built and prediction techniques are
examined, some other factors that influence students’ decisions to leave high school before
earning a diploma are reviewed. Students attend schools and live in communities that exert
that dropout decisions do not rest entirely on students’ academic performance, instead
ninth-grade indicators provide early warning signs of underlying influences.
Conceptual Framework
Students at risk of dropping out of high school often display identifiable warning signs in
ninth grade. These early warning indicators, like red flags, signal potential danger, suggesting a
student might be headed off the path to graduation. Three particular warning signs tied to
students’ academic performance and examined in this research were GPA, credits earned, and
over-age status. They gave evidence of the quality, quantity, and progress of students’ academic
engagement.
Dropping out is defined as a student’s decision to leave high school before completing
the requirements for earning a diploma. Rumberger (2011) discusses three ways to view
dropping out: status, event, and process. Dropping out as a current status means an individual
may be considered a dropout today, but if that student decides to reenroll, his or her status would
change. Dropping out as an event notes the moment in time a student leaves, either formally or
by attendance. Dropping out as a process recognizes the ways a student’s pattern of
non-attendance, academic struggles, social difficulties, and behavioral problems accumulate over
time. Each of these views reveal something important about the phenomenon.
Rumberger’s dimensions of dropping out give a helpful framework for evaluating the
literature. Viewing dropping out as a status leads to research into how the dropout status affects
groups of students. For example, Sterns and Glennie (2006) examined reasons for dropout rates
for high school students across grade level, age, gender, and ethnic groups. They analyzed a
cross-section of data from students who dropped out of North Carolina public schools in
academic, disciplinary, employment, family, moving, and attendance. They found that academic
reasons for dropping out increased by grade level. Older students tended to leave for academic
reasons, whereas younger students tended to leave for disciplinary reasons. African American
males were more likely to be pushed out of school by disciplinary actions, while Latina females
were more likely to be pulled out by family reasons.
Viewing dropping out as an event leads to research into the timing of the dropout
decision. For example, Batin-Pearson et al. (2000) compared five theories predicting students’
early decisions to drop out (before 10th grade). They found that poor academic achievement fully
mediated the other variables of deviance, low school bonding, antisocial peers, sexual
involvement, low parental expectations, a parent’s lack of education, gender, ethnicity, and
socioeconomic status for early dropouts.
Viewing dropping out as a process leads to research into attitudes, behaviors, and
academic performance that precede the decision to quit school. For example, Jimerson et al.,
(2000) analyzed longitudinal data collected on 177 children in Minneapolis. The first data were
collected when the children’s mothers were in their third trimester of pregnancy. The last data
were collected when the children turned 19. They found that parent involvement, problem
behaviors in the first grade, peer competence, problem behaviors when the child was 16, quality
of caregiving, and academic achievements in first grade and at age 16 correctly classified 78
percent of the dropouts and 77 percent of the graduates.
While these three dimensions of dropping out are not mutually exclusive, my research
focused primarily on the view that a student’s decision to drop out of high school is the
culmination of a process. Specifically, it examined academic performance indicators that precede
behaviors, are more open to the influence of school-base practices. For as Rumberger and Lim
(2008) state, the academic indicators offer guidance to schools on how to develop intervention
strategies to get students back on track to graduate.
The turbulent transition year. Although children begin their learning journey at birth,
on the first day of kindergarten, they step onto their academic path to high school graduation.
Knowledge gained, experiences gathered, and social interactions encountered cumulate over
each school year and shape the attitudes, behaviors and achievements students bring to the next.
In this way, each school year provides a snapshot of students’ learning progress along a
trajectory. There are points along this path, according to Neild, Stoner-Eby, and Furstenberg
(2008), where students’ successful completion of high school hangs in the balance and their
educational trajectories can be reshaped. Ninth grade is one such point. Sometimes referred to as
the rocky transition year, ninth-grade experiences present potentially treacherous waters that can
be difficult for students to navigate (Neild, Balfanz, & Herzog, 2007; Neild & Farley, 2004;
Neild, Stoner-Eby, & Furstenberg, 2008).
In the American school system ninth grade marks the beginning of a new system in
which students must earn credits toward graduation. For most, it coincides with the physical
changes of early adolescence, reduction of parental support, and an increase in peer influence
(Neild, 2009). Students accustomed to the structured environment of middle school can
experience ninth-grade shock (Allensworth, 2013) as they transition from eighth grade, where
their teachers and parents held them accountable for attending class and completing assignments,
to ninth grade where they experience increased freedom and responsibility. Allensworth
describes a research study in which she and her team interviewed 52 students attending public
students did not feel that ninth grade coursework was more difficult. Many felt it was easier. In
fact, students indicated they put less effort into their work due to the dramatic decline in
monitoring by their teachers and reduced availability of supports.
Achievement loss in the transition to high school was examined by Alspaugh (1998). He
grouped 16 small town and rural school districts into three groups based on the structure of the
district. The first group had one K-8 elementary school and one high school. The second group
had one each of elementary, middle, and high schools. The third group had two to three
elementary schools, one middle school, and one high school. The results showed significant
achievement loss for students transitioning from fifth to sixth grade (middle school transition)
and transitioning from eighth to ninth grade (high school transition). Additionally, the dropout
rate was significantly different between the districts with no middle school and the districts with
a middle school. Alspaugh suggests that the instability and adjustments required of students
when experiencing school-to-school transitions might be associated with increased dropout rates.
Recent research by Benner, Boyle, and Bakhriari (2017) supports this decline in student
performance and engagement in the transition to ninth grade. They analyzed data from a
longitudinal study of students in two ethnic minority-concentrated schools in a metropolitan area
in the South. They used analysis of variance, repeated measures of covariance, and path analyses
to document individual changes from eighth grade to ninth grade. The results showed that
students’ course grades declined significantly and their feelings of loneliness increased
significantly over the transition period. However, school belonging appeared to play a buffering
role, influencing a positive transition in relation to depressive symptoms, loneliness, school
engagement, and grades. Additionally, Pharris-Ciurej, Hirschman, and Willhoft (2012) examined
who did relatively well in eighth grade failed courses in ninth grade. At the beginning of their
10th grade year, 14 percent were reenrolled in ninth grade and 14 percent had dropped out.
Some students enter ninth grade with skills below grade level. Others do not understand
they must accumulate credits to graduate. Some have difficulty navigating the new school
building with its new social relationships, school practices and routines, and a new teacher each
class period. Add to the mix that freshman level classes tend to be taught by less experienced,
newly-certified teachers. The result creates a turbulent transition for many students (Neild, 2009;
Neild, Stoner-Eby, & Furstenberg, 2008). How well students weather the transition provides
important information regarding their trajectory toward successful high school outcomes.
Regardless of student performance in earlier grades, student work in ninth grade gives the
strongest indication of their graduation outcome (Allensworth & Easton, 2007; Kemple, Segeritz,
& Stephenson, 2013).
Early Warning Indicators. Enroll, attend, progress, graduate, these are the steps on the
path to graduation (Rumberger, 2011). However, not all students follow the path. Some are
pushed out for consequences of bad behavior, pulled out by employment, or fall out through
disengagement (Doll, Eslami, & Walters, 2013). Others drop out because it is a matter of
survival, a teacher encourages them to get their GED, the rules are too strict, or the pull of real
life outside school makes it impossible to stay (Cameron, 2012). Regardless of the causes of or
reasons for dropping out, there are factors associated with students’ academic achievement
(grades), educational persistence, and educational attainment (earning credits and being
promoted to the next grade level) that predict graduation outcomes (Rumberger & Lim, 2008).
These predictors are indicators associated with higher probabilities of dropping out (Carl,
Miller, Luppescu, Gladden, and Easton (1999) first developed the On-Track Indicator to
describe ninth-grade students in a Chicago school district who graduated four years later. After
analyzing student high school records for graduates in the years 1993-1997, they designated
students as On-Track if they received no more than one F in a core course during the year and
had earned enough credits to move to the next grade level on time. They found that being
On-Track correlated significantly with graduation. Later in a study analyzing student records for
six cohorts of students in Chicago public high schools in 1993-2000, Miller, Allensworth, and
Kochanek (2002) found that 78 percent of On-Track students graduated four years later. Only 16
percent of Off-Track students graduated.
In succeeding years the Consortium on Chicago School Research investigated the
predictive strength of the On-Track Indicator as well as other ninth-grade indicators. Allensworth
and Easton (2005) found that students On-Track at the end of their freshman year were four
times more likely to graduate than their Off-Track peers. However, given concerns that the
On-Track Indicator, which is calculated at the end of the ninth-grade year, gives information too
late to be useful, Allensworth and Easton (2007) compared the On-Track Indicator to other
individual indicators (GPA, course failures, absences, and over age) measured at the end of the
first quarter of ninth grade. They found GPA and course failures to be just as predictive as the
On-Track Indicator, correctly identifying graduates versus non-graduates 80 percent of the time.
Specifically, GPA was the most accurate in predicting dropouts. Allensworth (2013) reports that
Chicago Public Schools is using these ninth-grade early warning indicators to develop strategies
to improve student performance and lead more students in making progress toward graduation.
Similar to the research done by the consortium in Chicago, MacIver and Messel (2012)
Schools. Using the term early warning indicators, their predictors included attendance, behavior
problems, and course failures. Specifically, they reported that 92 percent of the dropouts in the
2004-05 cohort had at least one early warning indicator in the ninth grade. In subsequent
research MacIver and Messel (2013) used logistic regression to analyze a sample of 84,000
students in Baltimore City high schools. In addition to attendance, behavior problems, and course
failures, they included over-age for grade, and GPA. Chronic absenteeism and course failures
were stronger predictors than suspensions or demographic variables. Being male and over-age
was a significant predictor of non-graduation when controlling for behavior. All ninth-grade
indicators were stronger predictors than the eighth-grade indicators.
Referencing the work done by the consortium in Chicago, Kemple, Segeritz, and
Stephenson (2013) developed an on-track indicator for a sample of 576,000 students in New
York City Schools. The indicator included total attendance, number of credits, number of failed
courses, and passing at least one end-of-course Regents Exam required for graduation. They
found that credits earned, passing at least one Regents Exam, and attendance gave the best
balance of correctly distinguishing between on-track and off-track students. It correctly identified
82 percent of the on-track students and 76 percent of the off-track students. Similarly, Carl et al.
(2013) developed an indicator for analyzing a sample of 80,000 students in Milwaukee Public
Schools. Looking to find an indicator that would convey information about the academic quality
in addition to the quantity of credits, they defined Total Quality Credits (TQC) as a linear
combination of credits earned and grades. They found that TQC correctly identified 85% of
graduates.
The common threads in each set of indicators examined by these research studies are
this research. Each gives information regarding a dimension of students’ academic performance
and the trajectory of future outcomes.
GPA. Grades are the symbols teachers assign to represent a composite measure of
student performance in a course of study (Brookhart et al., 2016). Teacher-assigned grades in all
courses are averaged and represented by a cumulative GPA. The literature describes grades as
representing more than an assessment of students’ academic knowledge and skills. Grades
contain two components: academic knowledge and classroom achievement (Bowers, 2009).
Grades take into account individual differences such as student effort and interest (Thorsen &
Cliffordson, 2012). They represent how well students have fulfilled an implicit contract between
the teacher and students (Willingham, Pollack, & Lewis, 2002). Grades emerge from an
interactive process of teaching and learning that occurs daily between the teacher, the course
material, and the student (Maué, 2016).
While most teachers view grades as something that students earn, a type of currency, or
compensation for work completed (Brookhart, 1993), they often base their assignment of grades
on a variety of factors. McMillan (2001) analyzed survey responses of 2,293 classroom teachers
in middle and high schools in Virginia. Teachers reported using academic performance,
performance compared to a set scale of percent correct, and specific learning objectives as the
top three factors in determining grades. They also reported using, to some extent, the factors of
student effort, ability level, quality of homework, and the degree of attention and participation.
These teachers viewed grading as part of a larger philosophy of teaching and learning in which
they made accommodations for individual student differences. Grading on effort was seen as a
Effort, attendance, participation, and interest constitute affective classroom behavioral
factors that teachers consider when assessing students and give grades multi-dimensionality. It is
this dimensionality, Bowers (2011) suggests, that accounts for the difference between grades and
test scores. In his analysis of data from the Education Longitudinal Study of 2002, Bowers
compared grades to math and reading standardized test scores. He found that the non-cognitive
classroom behavior dimension accounted for the differences in grades and test scores. The
academic knowledge dimension accounted for the differences in how grades in core subjects
were more closely associated with test scores than grades in noncore subjects. More than
academic knowledge, grades are an assessment of students’ overall performance across a range
of classroom expectations.
While teacher-assigned grades are not a pure assessment of academic knowledge, it
appears that teachers may be adept at assessing a student’s ability to perform at the social
processes of the institution of schooling, in which academic knowledge is just one
component of a much broader array of behaviors required by a student’s community and
school. (Bowers, 2011, p. 153)
Since successful graduation requires both academic knowledge and persistent engagement in the
processes of school, this dimensionality of grades may account for their strong association with
future educational outcomes, such has graduating or dropping out.
Regardless of the variation in teachers’ inclusion and weighting of additional factors in
their calculation of student grades (McMillan, 2001), teacher-assigned grades are strong
predictors of future educational outcomes. Grades predict future academic success (Thorsen,
2014). They predict high school completion (Bowers, 2010) and higher education achievement
wages, welfare, higher education, physical and mental health, and voting. (Borghans, Golsteyn,
Heckman, & Humphries, 2016). Although Allen (2005) argues that grades are invalid
assessments of student achievement because teachers include nonacademic factors, they are valid
as assessment of students’ overall schooling (Bowers, 2011) and as such give a strong indication
as to students’ future academic outcomes.
Credits earned. In American high schools students must earn a minimum number of
credits to graduate. Credits are based on Carnegie Units, in which one unit represents a single
subject taught for one classroom period for five days a week (U.S. Department of Education,
2008). The required minimum number of credits varies by state. California requires a minimum
of 13 credits (local school boards may establish additional requirements); Texas requires 26
(National Center for Education Statistics, 2013a). Earning credits demonstrates students’
progress toward graduation. Failing one course may signal a student’s academic difficulties with
the subject or the teacher, but multiple failed courses may signal a student’s disengagement with
school (Roderick & Camburn, 1999).
Neild, Stoner-Eby, and Furstenberg (2008) analyzed student data from a cohort of
Philadelphia public schools. The results showed 46 percent of the dropouts were listed as 9th or
10th graders despite the fact that they had been enrolled in school for several years. The majority
were behind in credits; 88 percent had earned no more than three credits during their time in high
school. Logistic regression analysis results showed that a 20-percentage point increase in the
number of failed courses (the equivalent of one extra failed course in semester) would increase
the odds of dropping out by 40 percent. Roderick and Camburn (1999) analyzed data from
students in Chicago Public schools. Their results showed the estimated probability of failing at
level in reading and mathematics. Interestingly, they report that course failure did not appear to
be limited to only those students who entered high school with low skills, the estimated
probability of failing at least one course in ninth grade was 0.31 for a student who entered with
grade-level skills.
Course failures accounted for the greatest difference of 10 percentage points between
graduates and non-graduates in Robison, Jaggers, Rhodes, Blackmon, and Church’s (2017)
analysis of student data from the Louisiana Department of Education. In Allensworth and
Easton’s (2007) analysis of sample of Chicago Public High Schools, 53 percent of the students
failed at least one course in their freshman year and fall semester course failures correctly
identified 76 percent of dropouts. Pharris-Ciurej, Hirschman, and Willhoft (2012) report that
more than a third of the sample of ninth graders began their second semester with a GPA less
than 2.0, which indicated failing or almost failing one or more classes. When students fail
courses, they do not earn credits. Thus, credits earned and courses failed can be conceptualized
as two sides of the same dimension: students’ freshman year educational attainment. Both
indicate whether or not students have passed enough of their classes to earn enough credits to
keep them on the path to graduation.
Over-age status. Being over-age is a term used to describe students who are older than
their classmates. Students can be over-age in ninth grade for a variety of reasons. They may have
entered Kindergarten older than their peers or they may have repeated an elementary or middle
school grade level. While most parents enroll their students in Kindergarten at age five, some
choose to delay schooling for their children. The prevalence of academic redshirting, or the
delaying of entrance to Kindergarten, was four to five percent nationwide in 2006, Bassok and
redshirting varied across gender, race and SES, with the likelihood of redshirting being higher
among children whose birthdays fell in the months closest to the cutoff date, and among
higher-SES families. The data suggests that the parents’ decision to redshirt might be driven by
concerns over their child’s physical development rather than their cognitive or behavioral
development.
Students unable to keep up with the rapid pace of calendar-driven schooling, who
perform poorly in school, are often required to repeat a grade level in an effort to give them more
time to master the curriculum (Martin, 2011). In 2015, 2.2 percent of the students in the U.S.
were retained, or enrolled in the same grade level as the previous year (National Center of
Education Statistics, 2015). While grade retention was designed to improve student learning by
giving students additional time to catch up to grade level, Tingle, Schoeneberger, and Algozzine
(2012), in their analysis of 125,000 students in the Southeast, found that year one and year two
achievement of retained students was consistently below that of their promoted peers. Moller,
Stearns, Blau, and Land (2006) in their analysis of the National Education Longitudinal Study
1988-1992 found that retention predicts students’ academic trajectories. Students retained prior
to eighth grade had initial math and reading achievement scores five points below their promoted
peers and experienced fewer gains in achievement. Retention accounted for 23 percent of the
variation in achievement and growth between the two groups of students. Grade retention at any
stage of schooling elevates the risk of dropping out (Alexander, Entwisle, & Kabbani, 2001).
Grade retention is associated with negative effects on students. Students as early as third
grade rated retention in their top five stressful life events; for sixth-grade students, it was rated as
the top stressor (Anderson, Jimerson, & Whipple, 2005). Jimerson and Ferguson (2007) found
who were recommended for retention but were promoted. Grade retention was a significant
negative predictor of academic self-concept, academic motivation, academic engagement,
general self-esteem, and homework completion in Martin’s (2011) analysis of data from a
sample of 3,261 students in grades 7 thru 12 in Australian schools. He examined the relationship
between grade retention and academic and nonacademic measures. Grade retention was a
significant positive predictor of maladaptive motivation and weeks absent from school.
Regardless of the reason for being one or more years older than their grade-level
classmates, over-age students are more likely to drop out of school (Allensworth & Easton, 2007;
Lee & Burkam, 2003; MacIver & Messel, 2012; Roderick 1994). Each additional year older a
student is upon entering ninth grade doubles that student’s odds of dropping out (Neild,
Stoner-Eby, & Furstenberg, 2008). Sterns and Glennie (2006) found that 25 percent of dropouts with
ninth grade standing were age 17 or older in a sample of North Carolina schools. Older students
tended to get pulled out of high school by employment opportunities (Stearns & Glennie, 2006).
Students entering ninth grade are entering a new social environment in which being older than
their peers becomes more evident and important. Fifteen-year-old freshmen will be 19 if they
graduate on time. If they take an extra year, they will be 20, the same age as their peers who will
have completed two years of college or work experience (Neild, Balfanz, & Herzog, 2007).
According to Roderick (1994) they may feel like failures and negatively self-conscious as they
compare themselves with their peers. “…[B]eing over-age for grade, no matter when a youth was
retained, has an impact on attitudes toward, and experiences in, school that may not be reflected
in grades or attendance” (Roderick, 1994, p. 742). This impact of being over-age on students’
attitudes toward school may add to the strength of over-age status in predicting future graduation
In conclusion, identifiable warning signs displayed during students’ turbulent transition
year to high school offer early indicators of graduation trajectories. GPA, credits earned and
over-age status are three indicators that predict the likelihood that students will dropout.
Academic achievement and classroom performance, as represented by teacher-assigned grades,
give an indication of students who are on-track to graduate. Passing classes and earning credits
indicate students’ progress toward their graduation goal. Being over-age for their grade level
may provide additional information of students’ past academic achievements. The predictive
strength of these three indicators was analyzed in this study using ROC analysis. By using
predictor variables, I hoped to provide to school personnel information regarding the severity of
risk for students being off-track to graduation or to show that students are off-track in some areas
but on-track in others (Kemple, Segeritz, & Stephenson, 2013).
Predicting Dropout
Accurate indicators correctly identify students at-risk of dropping out while not
misidentifying as potential dropouts those students who will graduate. Scarce school resources
drive the need for screening tools that target students most in need of interventions. Considering
the potential for self-fulling prophesy, the work to accurately label students as at-risk must be
done with as high a level of confidence as possible. One way to conceptualize early warning
indicators is as diagnostic tests for dropping out. Similar to how medical personnel screen
patients for the presence of a particular disease, GPA, credits earned, and over-age status could
be viewed as diagnostic tests with the potential to predict the likelihood of dropout for students.
When using early warning indicators to screen for possible at-risk students, school personnel
Receiver operating characteristic (ROC). ROC analysis in educational research is
relatively new. It is typically found in medical research where it is used to assess the accuracy of
diagnostic tests. Since diagnostic tests are predictions of whether a patient has or does not have a
disease, a ROC curve provides a statistical assessment of the accuracy of the prediction (Gönen,
2007). The curve gives a visual representation of the tradeoff between true positives and false
positives at all values of the diagnostic test, thus giving medical decision makers a tool to set
optimal threshold values (Fawcett, 2006).
Recently a few education researchers have conceptualized early warning indicators as
diagnostic tests of student outcomes and have applied ROC analysis to assess the predictive
value of both the individual predictors and logistic regression models of multiple predictors.
Fewer researchers have extended the ROC analysis to determine optimal threshold values for the
indicators. Munoz-Repiso and Tejedor (2012), McCluckie (2014), and Vivo and Franco (2008)
employed ROC analysis to analyze the accuracy of first-year university student indicators.
Munoz-Repiso used the area under the curve (AUC) to compare the strength of each indicator in
predicting technology use. McCluckie, and Vivo and Franco used ROC curves to establish
cut-scores for indicators predicting students’ future academic success.
Liao, Yao, Chien, Cheng, and Hsieh (2014) and Jordan, et al. (2010) used ROC analysis
on pre-school and kindergarten indicators. Liao et al. evaluated the ROC curve for optimal scores
on a checklist used to predict developmental delays in preschool children in Taipei City. Instead
of assessing the accuracy of a single cut point, ROC analysis allowed Liao et al. to provide a
decision validity index on multiple cut scores. Jordan et al. assessed the accuracy of a
grade. They also used ROC establish diagnostic cut scores for predicting students likely to show
mathematic weakness in third grade.
Of particular interest are the studies conducted by Nicholls, Wolfe, Besterfield-Sacre, and
Shuman (2010), Stuit et al. (2016), and Johnson and Semmelroth (2010). Similar to my research,
Nicholls et al. analyzed a complex data set to evaluate eighth-grade predictors of future
educational outcomes. Using data from the National Educational Longitudinal Study of 1988
(NELS:88), they built two statistical models and then used ROC analysis to compare their
predictive accuracy. They defined an integrated modeling approach that combined logistic
regression, survival analysis, and sensitivity analysis in a step-wise progression. Starting with
logistic regression, the outcome of one step was used as the input for the next step. They
hypothesized that this integrated modeling approach would produce more accurate predictions
than any single standard statistical approach. They began with 76 potential eight-grade variables
and built a logistic regression model on the 22 significant predictors of a student’s future
attainment of Science, Technology, Engineering, or Mathematics (STEM) university degrees.
Next, they put the logistic regression model through the subsequent steps to produce an
integrated model. Using ROC analysis to compare the two models, Nicholls et al. found that the
logistic regression model alone produced more accurate and beneficial results than the integrated
approach. They concluded the logistic regression model’s strength was due to the comprehensive
nature of the complex data set, the large number of records, and the care taken in selecting and
coding the variables.
In contrast, Stuit et al. (2016) and Johnson and Semmelroth (2010) used ROC analysis on
regional samples. Stuit et al. used data from two cohorts of eighth- and ninth-grade students in