Int. J. Adv. Res. Sci. Technol. Volume 4, Issue 3, 2015, pp.361-366.
International Journal of Advanced Research in
Science and Technology
journal homepage: www.ijarst.com
ISSN 2319 – 1783 (Print) ISSN 2320 – 1126 (Online)
Structural and electrical evolution of Barium Cerate catalyst for CO oxidation
Madjid ARAB*
Université de TOULON, IM2NP - UMR CNRS 7334, BP 20132, 83957, La Garde, France *Corresponding Author’s Email: [email protected]
A R T I C L E I N F O A B S T R A C T
Article history: Received Accepted Available online
20 Apr. 2015 30 Apr. 2015 01 May. 2015
Barium cerate BaCeO3 is obtained by a coprecipitation method. The
crystallized samples are characterized by X-ray diffraction and electron microscopy. The structural and thermodynamic analyses revealed several transitions as a function of temperature according to the phase transformation. The electrical properties are studied using electrical impedance spectroscopy as a function of temperature. The Nyquist representations are semi-circles, characteristic of electron and ionic conduction. A series of electrical transitions are observed, which are in good agreement with structural transitions. The catalytic properties of these powdered materials in presence of air and 2500 ppm of carbon monoxide gas flows are studied by Fourier Transform Infrared spectroscopy (FTIR). The catalytic activity given rise to the total oxidation reaction and has been determined from the CO2 FTIR absorption band intensities. This activity
reaches the complete transformation at 400°. The conversion rate of CO into CO2 is analyzed as a function of temperature and reaction time.
© 2015 International Journal of Advanced Research in Science and Technology (IJARST). All rights reserved. Keywords:
Perovskite, Structure, Conduction, Catalyst, Oxidation, Carbon monoxide
.
Introduction:
In the general framework of innovating
microsystems for catalytic sensors, we try to develop studies on perovskite based materials susceptible to
present multifunctional properties. Perovskite
compounds or derivatives have been widely studied due to their ample application and diverse properties (dielectric, optic, catalytic …). One specific interest of such studies should be to establish correlations between catalytic interactions and other properties. In order to study and optimize these properties, many researchers are seeking new methodologies to develop these oxides.
Among these perovskites, BaCeO3 (BCO) ceramics
and related type compounds were intensively studied because of their potential applications, e.g. for fuel cell and electrocatalysis technologies[1-4]. They were regarded as very promising candidates as solid electrolytes in electrochemical devices such as solid oxide fuel cells (SOFCs) and catalytic gas sensors [5-7]. These perovskites type structures were highly interesting mainly because of their high ionic conductivity and surface reactivity. More recently, we
found that BaCeO3 exhibited heterogeneous
photocatalytic activities for water splitting [8-11].
Many studies have focused on the structure, defect chemistry, conductivity, and the processing of
BaCeO3compounds [12-13]. Modified barium cerate
materials were also investigated as proton conductors in humidified reducing atmosphere at intermediate temperature: these perovskite type materials were also considered as promising electrolytes for SOFCs [14-18]. The microstructure and the presence of carbon dioxide in the ambient atmosphere were also considered as potential parameters that could condition the conductivity mechanisms [19]. These oxide materials were also found to present high interest as catalysts for oxidation reaction because of their high capacity of oxygen conduction.
Recently solid gas interaction analyses between BCO and methane CH4 diluted in air flows were
published [20-21]. However, in our knowledge, there are very few studies relating to the interactions between BaCeO3 and carbon monoxide CO.
The goal of this study is to effectively synthesize a well crystallize BCO powders with a stoichiometric composition and to understand their phase evolution process, which may be helpful on the further to the catalytic and electrical characterization.
Int. J. Adv. Res. Sci. Technol. Volume 4, Issue 3, 2015, pp.361-366.
microscopy imaging. The electrical properties are studied using electrical impedance spectroscopy as a function of temperature. The catalytic properties BCO powder with air- carbon monoxide flows are studied as a function of temperature and reaction time, making use of infrared spectroscopy (FTIR).
Experimental setup:
Synthesis method:
BCO powders were synthesized from the sol gel route based on the complex method combining acid EDTA and citrate solutions. Barium and cerium citrate solutions were dissolved in de-ionized water. The molar proportions of EDTA acid, total metal ions and solution of ammonium hydroxide were 1:1.5:1. As a first step, the EDTA acid was dissolved in the solution of ammonium hydroxide and heated at 40°C with stirring for thirty minutes. As a second step, the solution of mixed barium and cerium ions was added in the form of citrate dissolved in water. Finally, citric acid was added and the temperature of the solution was fixed at 80°C. The stirring was maintained until the gel formation. After the gel formation, the sample was preheated at 230 °C for 3h to form a primary powder. Finally, this precursor powder was treated at 1000°C under air for 5h to obtain the final BCO powder. This temperature (1000 °C) was optimized from thermal analyses. The as prepared primary powder was submitted to thermal and thermogravimetric analyses using a SETARAM TG/DTA 92 equipment. The thermal decomposition was studied under air, in the temperature range of 25– 1200 °C and with a heating/cooling rate of 5 °C.min−1.
Structural analyses:
A single perovskite type phase was identified by classical X-ray diffraction analyses (experimental conditions: θ-2θ angle configuration, CuK radiation, D5000 Siemens-Bruker ray diffractometer). The X-ray patterns were compared with the files from Joint Committee on Powder Standards (JCPDS). The microstructure of grains was studied by Scanning and Transmission Electron Microscopy (SEM and TEM). The local composition was determined making use of EDX analysis.
Catalytic analyses:
To study the catalytic properties, a specific homemade system was used [22]: in this approach, gas mixtures (air-CO) are injected from a gas distribution platform in a cylindrical reactor in which powdered cylindrical walls of BCO are placed between two inert separators. These walls are porous and are not compacted. The gas flow (2500 ppm CO in air) crosses with a fixed speed (10 ml/min) through the separators and the sample. Before each analysis, blank experiments using neutral atmospheres and reactor cell without BCO sample were systematically carried out. Then, the gases transformed or not by the catalyst sample, are directed to a cylindrical FTIR analyzer cell
to be subjected to FTIR analysis. The intensities of CO2
and CO absorption bands (surfaces of bands) are analyzed every 30 seconds. The intensity variation of CO2 bands are used to determine the catalytic efficiency
evolutions as a function of time and temperature.
Electrical analyses:
The conductivity measurements were determined making use of Electrical Impedance Spectroscopy (EIS) under air, in the temperature range 300 to 900 °C. The SOLATRON SI 1260 AC impedance analyzer was used in the frequency range of 1 to 106 Hz. The polycrystalline BCO samples were cylindrical pellets (thickness e), initially compacted under a pressure of 5 kbars, then placed between two cylindrical platinum electrodes (surface S). Nyquist representations (the impedance Z = Z’ + jZ” being represented in the plane (-Z”, Z’)) delivered the extrapolated resistance value R of the samples (by extrapolation of semi-circles). The apparent conductivity of the samples was calculated using the formula: σ=e/(R.S) where R is the extrapolated resistance.
Results and discussion:
Structural characterization:
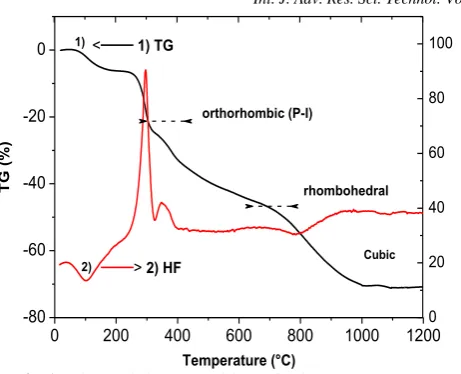
The thermal decomposition obtained from DTA and TGA analyzes showed several stages, i.e Figure 1. The first step corresponds to a weight loss of about 10%. This mainly resulted from desorption of the adsorbed water in the primary powders. Subsequently, the highest exothermic peak (DTA) appeared at around 250–300 °C in the DTA curve, corresponding to a further weight loss of 20%. This was mainly due to the decomposition of organic compounds, nitrates and ammoniac associated with oxidation of CO molecules into CO2. A second exothermic peak appeared close to
350 °C: it should probably correspond with nitrate departure associated with formation of primary phases. From 400 to 1000 °C additional weight loss is observed, corresponding to successive transitions up to 1000 °C, at which the system stabilizes. These transitions might be related to the well-known structural changes of BCO as reported in the literature [23-24]. As temperature increases, the BCO phase exhibits successive electrical modifications associated with structural transitions: as temperature increases the BCO lattices should be successively orthorhombic P, orthorhombic I, rhombohedral and finally cubic.
Int. J. Adv. Res. Sci. Technol. Volume 4, Issue 3, 2015, pp.361-366.
0 200 400 600 800 1000 1200
-80 -60 -40 -20 0
0 20 40 60 80 100 < 1) TG
T
G (
%)
Temperature (°C) 1)
2)
orthorhombic (P-I)
rhombohedral HF
(
µ
V
)
> 2) HF Cubic
Fig.1: Thermal decomposition of primary precursor from TG/DTA analyses.
To determine the structural characteristics of the as prepared powder, Rietveld refinement method was used with the software DBWS Tools 2.16. The modified Pseudo-Voigt function, containing Lorentzian and Gaussian contributions [25] was selected to fit the diffraction profiles.
10 20 30 40 50 60 70 80 90
-1000 -500 0 500 1000 1500 2000 2500 3000 3500
0 500 1000 1500 2000
C
o
u
n
ts
(
a
.u
)
2(degree)
1) Exp 2) The
2)
3)
(40
4)
(21
5)
(23
3)
(00
4)
(21
3)
(22
0)
3) Exp - The
(00
2)
1)
Fig.2: X-ray diffraction patterns and rietveld refinement of BaCeO3 powder
The estimated size was done on many recorded images which give a dispersive of the particles dimension. The mean size from these TEM analyses should be: DTEM=300 ±100 nm (the deviation of ±100
nm takes into account the size distribution).
Table 1: Structural and profile parameters for orthorhombic BaCeO3from Rietveld analysis.
Structural and Profile Parameters
a b c V
6.233 Ǻ 6.212 Ǻ 8.774 Ǻ 339.811
Density (µ in g.cm-3) 6.363
FWHM parameters (U,V,W) U = 0.1388 ; V = -0.0336 ; W = 0.0317
Atom coordinates X Y Z
Ba -.0054 .0180 .2500
Ce .0000 .5000 .0000
O1 .185 .783 .2500
O2 -.2588 .2655 .0432
R factors Rp = 13.2 % Rwp = 17.3% Rexp = 11.7%
In Table 1 the structural refined parameters are reported. The BCO orthorhombic lattice results from a distortion of a perovskite cubic sublattice. The microstructures were closely examined by TEM (insert fig.3b): the characteristic crystals presented mean linear dimensions of 200 nm with regular pentagonal geometric shapes.
Taking into account to the structural modification, at the end of refinement calculations, we used the Williamson– Hall (W–H) approach [26,27] to extract size effect noted Dhkl, depending on crystal direction,
and distortion effect ε(hkl) (due to structural defects),
also depending of crystal direction. The W-H approach is limited to the strongest values of Bragg peak intensities. The result given rise to a mean crystallite size DXRD = 240 ± 100 nm and a mean distortion
εXRD = 0.003±0.0005.
Figure 3.a presents SEM image of the BCO sample. Submicronic particles (sizes < 1 μm) seem to
form continuous agglomerates, which are formed by a pseudo spherical particles (see Fig.3a). TEM image of BCO particles show irregular, non-uniform shapes (square, pentagon and heptagon) with dimensions less than 1μm.
The estimated size was done on many recorded images which give a dispersive of the particles dimension. The mean size from these TEM analyses should be: DTEM = 300 ±100 nm (the deviation of ±100
Int. J. Adv. Res. Sci. Technol. Volume 4, Issue 3, 2015, pp.361-366.
Fig.3: Electron microscopy images of BaCeO3 ceramic
powder: a) SEM Image and b) TEM image with EDX local chemical analyses on individual crystallites.
Electrical properties:
On Figure 4 we have reported a series of Nyquist representations of impedance data as a function of temperature. To interpret the semi-circles of the figure, it has been necessary to use a specific equivalent electrical circuit involving a resistance R and a frequency dependent term in (jC)n instead of the ideal capacitance term jC: the CPE constant phase element. The exponent n characterizes the heterogeneous nature of the polycrystalline pellet with porosities.
The intersection of the semi-circles with the horizontal axis (Z’ values) directly delivers the R value. The activation energy associated with the temperature dependence of R was calculated from the Arrhenius plot (Figure 5) using the following equation:
)
/
exp(
.
Ea
k
T
A
R
B (1)Where Ea is the activation energy for conduction, A is a preexponential factor and T is the sample temperature in Kelvin.
The resistance decrease with temperature to conductor behaviour (Fig. 4a). The impedance spectra of BaCeO3 can be interpreted as the evidence mixture
electronic and ionic conduction. Moreover, the adsorbed gases, particularly water, contained in the atmosphere could introduce a protonic contribution. Effectively, high temperature uses allows the generating oxygen vacancies, which associated to proton induce the charge transfer and ionic conduction.As reported on Figure 4.b, the logarithm of conductivity versus 103/T is not linear: it shows various
electrical changes. These electrical modifications might be related to structural of BaCeO3 suggested below. At
low temperature below 550 °C, the two orthorhombic BCO phases should be associated with the two activation energies of 0.21 (P orthorhombic) and 0.31 eV (I orthorhombic). For intermediate temperatures, the BCO structure should be hexagonal-rhombohedric with an activation energy of about 0.24 eV. Finally, at high temperature, the BCO acquires the ideal cubic perovskite structure: the activation energy is found to be higher close to 0.9 eV. The strong change in conductivity can be attributed to the instability of the atoms in the low temperature on the BCO surface; these oxygen instabilities (below 400 °C) might be linked with existence of nonstoichiometry in oxygen. The resulting surface oxygen vacancies might also be associated with probable change in cerium valence (Ce4+ being easily reduced into Ce3+, this could facilitate the reaction for CO oxidation.
0 1M 2M 3M 4M 5M
0 1M 2M 3M
a)
5) 4) 3)
2)
-Z
"(Oh
m)
Z'(Ohm)
1) 400 °C 2) 450 °C 3) 500 °C 4) 550 °C 5) 600 °C
1)
0,8 1,0 1,2 1,4
-6 -5 -4 -3
Ea= 0,210 eV
Orthohombic P
Ea= 0,305 eV
Orthohombic I Ea = 0,237 eV
Rhombohedral
Ea= 0,851 eV
Cubic
Log
S
c
m
-1 )
1000/T (K)
b)
Fig.4:Nyquist diagram of electrical impedance Z = Z’+jZ” obtained for BaCeO3 in the temperature range
of 400 - 600°C, b) Logarithm of conductivity (log ) as a function of 103/T,
Catalytic activity:
Int. J. Adv. Res. Sci. Technol. Volume 4, Issue 3, 2015, pp.361-366.
by catalytic CO conversion with increasing temperature (Fig.5.a), according to the following equation:
2 *
2
2 1
CO O
CO (2)
In this reaction, the oxygen O* has two origins: (i) adsorbed oxygen from air and (ii) free oxygen from the BCO surface. The catalytic reaction can be explained mainly by Langmuir – Hinshelwood mechanism [28]. In this case, the adsorbed CO gas reacts with the adsorbed oxygen from the air giving rise to the reaction CO (adsorbed) + O (adsorbed) CO2 (adsorbed).
Given the oxidation temperature range, the diffusion of oxygen species (O-, O2-) rather favourable at high temperature is low. As a result, the oxygen of the oxide, which are thermally activated, contribute little or not to gas transformation.
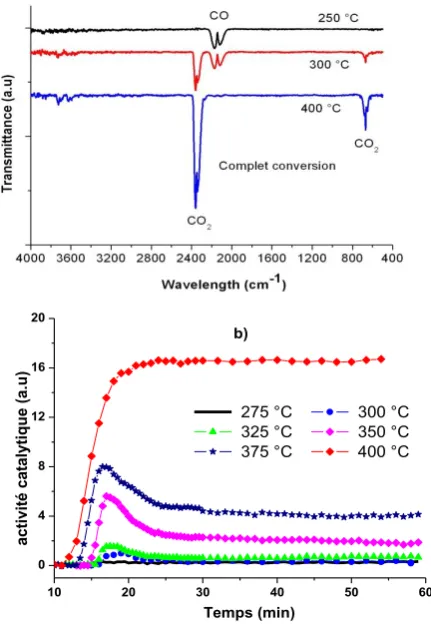
Catalytic activity was determined from the CO2
absorption band intensities, for each FTIR spectrum, versus temperature. It appears that the beginning of the conversion mechanism starts above 275 °C and reaches a saturation level at 400 °C: at this temperature, the CO oxidation is complete (the CO band vanishes). For temperatures lower than 400 °C, the conversion intensities are characterized by a maximum value, reached after a delay of about 15 minutes. After that, these intensities decrease with time and stabilize down to a fixed value depending on temperature.
10 20 30 40 50 60
0 4 8 12 16 20
275 °C 300 °C
325 °C 350 °C
375 °C 400 °C
acti
vi
té
catal
yti
q
u
e
(a.
u
)
Temps (min) b)
Fig.5: FTIR spectra analysis at different temperature: 250 °C, 300 °C and 400 °C.
The first maximum observed for the conversion is probably due to progressive penetration and adsorption gases. In this stage, the active sites are progressively consumed by CO adsorption on the grain surfaces. Then, the surface should be regenerated and we could observe equilibrium between active site degradation due to CO sieving and new active site generation due to adsorbed oxygen from air.
250 300 350 400 450 500
0 4 8 12 16
c
a
ta
ly
ti
c
Effi
c
ie
n
c
y
(a
.u
)
Temperature (°C) Conversion with BaCeO3 Oxidation under air without sample Contribution of BaCeO3
Total conversion
Fig.6: Catalytic efficiency of CO conversion in air versus temperature.
Figure 6 reports a comparative analysis of CO oxidation without and with catalyst sample. It shows that the oxidation rate is lower in presence of sample, up to a temperature of 375°C. Below this temperature, oxidation of CO evolves slowly, but above this temperature, the catalytic activity strongly increase and reaches the total conversion at 400°C with 75 % sample contribution (Four time then conversion without catalyst sample).
It should be remarked that the catalytic interesting domain is found to be between 300 and 400 °C: it corresponds to the domain in which the orthorhombic phase stabilizes. During this first phase, the observed conductivity increases and this behaviour might be due to lower activation energy which favours the atomic mobility.
Conclusion:
From the adapted EDTA-Citrate synthesis, we obtained the BaCeO3 polycrystalline phase after a
moderate temperature heating of 1000°C, with submicronic powders. The conductivity of BCO exhibits a series of electrical transitions identical to the various losses observed by the thermodynamic analyses; all these observed modifications can be interpreted in terms of structural changes corresponding to increase of structural symmetry.
Int. J. Adv. Res. Sci. Technol. Volume 4, Issue 3, 2015, pp.361-366.
activity might be mainly due to the relatively small sizes of BCO grains. The kinetics of the conversion presents abnormal time dependence. This might be interpreted in terms of a competition between the easy surface reaction of adsorbed CO with oxygen species and the regeneration by oxygen present in air flows, of the initially reduced grain surfaces.
Acknowledgements:
This work was developed in the general framework of CAPES-COFECUB projects, the Regional Council of Provence-Alpes—Côte d’Azur, the General Council of Var and by Toulon Provence Mediterranean.
References:
1. Chiang, P. H.; Eng, D., Stoukides, M. Solid Stat Ionics, 1993, 61, 99.
2. Uchida, H.; Kumura, H.; Iwahara, H. J. Appl. Electrochem. 1990, 20, 390.
3. Shimada, T.; Wen, C.; Taniguchi H. J. Pow. Sources, 2004, 131, 289.
4. Bonanos, N., Knight, K. S.; Ellis, B. Solid State Ionics, 1995, 79, 161-170.
5. Ouzaouit, K.; Benlhachemi, A.; Benyaich, H.; Aneflous, L.; Marrouche, A.; Gavarri, J. R.; Musso, J. A. J. Phys. IV. France, 2005, 123, 125
6. Munch, W.; Kreur, K. D. ; Seifert, G.; Maier, J. Solid. Stat Ionics, 2000, 136, 183
7. Meng, G. Y.; Ma, Q. L. ;Peng, R. R. Liu, ; X. Q. Solid Stat Ionics. 2007, 178, 697.
8. Ruiquiang, Y.; Qingfeng, W.; Guihua, C.; Weiya, H.; Kui, X. Ionics, 2009, 15, 749.
9. Fujishima, A.; Honda, K. Nature, 1972, 238, 37. 10. Kato, H., Kobayashi, H.; Kudo, A. J. Phys. Chem. B.
2002, 106, 12441-12447.
11. Zou, Z.; Ye, J.; Sayama, K.; Nature, 2001, 414, 625. 12. He, T.; Jia, C.L.; Meuffels, P. Solid State Ionics 1996,
89, 9.
13. Ahlgrem, O.E.; J. Phys. Chem. Solids, 1997 9, 1475. 14. Goretta, K.C.; Park, E.T.; Guan, J.; Balachandran, U.;
Dorris, S.E.; Routbort, J.L. Solid State Ionics 1998, 111, 295.
15. Yamaguchi, S.; Yugami, H.; Ikeda, S. J. Alloys Compd. 2002, 330, 911
16. Osman, N.; Talib, I. A., Hamid, H. A. Ionics. 2009, 15, 203.
17. Hashimoto, A.; Hibino, T.; Sano, M. Sensors and Actuators B. 2002, 86, 12–19.
18. Scherban, T.; Lee, W. K.; Nowick, A.S. Solid State Ionics. 1988, 28-30, 585-588.
19. Azad, Abul K.; Irvine, John T.S. Solid State Ionics. 2008, 179, 678-682.
20. Goretta, K. C.; Park, E. T.; Guan, J.; Balachandran, U.; Dorris, S. E.; Routbort, J. L. Solid State Ionics. 1998, 111, 295-299.
21. Zheng, M.; Zhu, B. Solid State Ionics. 1995, 80, 59-65. 22. Arab, M.; Lopes-Moriyama, A. L.; Renovato dos
Santos, T.; Pereira de Souza, C.; Gavarri, J. R.; Leroux, Ch. Catalysis Today. 2013, 208, 35– 41.Lin,
23. H-L.; Chiang, R-K.; Kuo, C-L.; Chang, C-W. J. of Non-Crystalline Solids. 2007, 353, 1188–1194. 24. Genet, F.; Loridant, S.; Ritter, C.; Lucazeau, G. J. of
Physics and Chemistry of Solids, 1999, 60, 2009–2021. 25. Wilson, A. J. C. International tables for
crystallography: mathematical, physical and chemical tables, (2nd ed), klerwer Academic Publishers, Dardrecht, 1995, pp. 625–626.
26. Williamson, G. K.; Hall, W. H. Acta Metallurgica. 1953, 1, 22.