Super Efficiency Analysis: An Application on The Efficiency of
Programming Languages
Kemal Gunduz
1, Talat Senel
2*(Department of Statistic, Ondokuz Mayıs University, Turkey) ** (Department of Statistic, Ondokuz Mayıs University, Turkey
1.
INTRODUCTION
Any person, community, institution or organization that produces product or provides services will want to be efficient in the work they do. Efficiency analysis takes an important place in almost every field that profit-making or non-profit, offers services or direct products, from education to health, from transportation to tourism, from food to logistics, from textiles to agriculture, from technology to public organizations. Companies, by making the management of resources of their healthier than it is; can save more, produce more products with the same amount of resources, reach more customers, provide better quality services and thus they can develop. If public institutions such as schools and hospitals are considered, the efficient management of resources will contribute significantly to development and it will increase the quality of the service. For this purpose, these individuals, companies and organizations should adjust their inputs and outputs well, manage the production process correctly, identify and correct where they are faulty or missing. To achieve this, they need to compare themselves with similar decision making units (DMUs). Data Envelopment Analysis (DEA) is involved here.
DEA is a non-parametric, linear programming-based efficiency analysis method that measures the relative efficiency of DMUs which have the same purpose, producing the same type of product or providing the same type of service. DEA can perform at the same time with multiple inputs and multiple outputs which have same or different units.
DEA classifies the DMUs as fully efficient or inefficient. The basic methods of DEA are not able to rank fully efficient DMUs among themselves. Fully efficient DMUs can be ranked by taking an efficiency score between 0 and 1. Inefficient DMUs can fix their shortcomings by taking reference fully efficient DMUs.
Super efficiency (SE) analysis is a method which makes possible to rank fully efficient DMUs among themselves. In the SE analysis, the efficiency scores of inefficient DMUs do not change. As for fully efficient DMUs, they take 1 or more values. Thus, fully efficient DMUs can also be ranked.
In this research, programming languages were chosen as the application subject in order to show the importance of the SE method and how different areas it can be used.
Programming is used in everyday life, in academic fields, in technological development, in health, in sociability, in art design and in many other fields. The phones themselves and their applications, computers, games, smart electronic home appliances, ATMs, automatic braking systems of vehicles, TVs, lights with sensor, and much more work through programming. The programming languages are code sequences with some basic rules that makes enable us to teach all these working systems to machines.
Abstract:
As in every period of history, it is desirable to be efficient while doing a study today too. Thus, resources can be used in the most appropriate way and maximum earnings can be obtained. These earnings can be directly financial or they can also be the increase of the quality of services in areas such as education and health. Data Envelopment Analysis (DEA) and Super Efficiency (SE) are widely used to measure this efficiency. In this study, DEA and SE are used in an application that focuses on the measurement of efficiency of programming languages. The 18 commonly used programming languages has been taken as decision-making units (DMU). By using SE analysis for the 10 DMUs with full efficiency, these fully efficient DMUs have been ranked. As a result of this ranking, C# has been identified as the most efficient programming language. The TypeScript programming language has been identified as the last one among the fully efficient DMUs by having the lowest SE score.In this case, it is very important to measure the effectiveness of programming languages. This research has been done in order to contribute to the development of the programming languages by looking from a different perspective and to show how competent the SE analysis is.
2.
METHODOLOGY
In this study, DEA and SE method have been used to measure the relative efficiency between the 18 programming languages.
2.1.Data Envelopment Analysis
Data Envelopment Analysis (DEA), which Farrell laid the foundations in 1957 [1], was became into the present state by Charnes, Cooper and Rhodes in 1978 [2].The model of Charnes, Cooper, Rhodes (CCR) accepts the status of Constant Return to Scale (CRS) to measure the technic efficiency. The model, which accepted as BCC model in the literature, developed by Charnes, Charnes and Cooper in 1984[3], accepts the status of Variable Return to Scale (VRS) [4].
In the constant returns to scale models, each increase in inputs causes the same ratio increase in outputs. In the variable returns to scale models, each increase in inputs cause different ratio increase in outputs. DEA models can be examined in two groups as input-oriented and output-oriented. Input-oriented DEA models investigate that how the most appropriate input composition to should be in order to produce a certain output composition in the most efficient way. Output-oriented DEA models investigate that maximum how much output composition can be obtained with a constant input composition (Charnes et al., 1978) [5].
In this research, input-oriented CCR model has been used. The mathematical model of the input-oriented CCR model is as follows:
Purpose Function
𝑚𝑎𝑥 𝑢𝑟𝑘. 𝑌𝑟𝑘
𝑠 𝑟=1
𝑣𝑖𝑘. 𝑋𝑖𝑘 𝑚
𝑖=1
Subject to
𝑢𝑟𝑘. 𝑌𝑟𝑗 𝑠
𝑟=1
𝑣𝑖𝑘. 𝑋𝑖𝑗 𝑚
𝑖=1
≤ 1 𝑗 = 1, … , 𝑛
𝑢𝑟𝑘 ≥ 𝜀, 𝑟 = 1, … , 𝑠
𝑣𝑖𝑘 ≥ 𝜀, 𝑖 = 1, … , 𝑚
Y: Outputs
X: Inputs
u: weight of output
v:weight of input
s: numbers of outputs,
m: number of inputs,
k: k. DMU,
j: DMU set,
r: Outputs set,
i: Inputs set,
ε : A very small positive value like 10-6
2.2.Super Efficiency
The Andersen and Petersen Method (AP) is the first ranking method based on the comparison and ranking of the full efficient DMUs with all other units. This approach facilitates comparison in rankings based on parametric methods and provides a basis for ranking full efficient DMUs. AP model is described as "Super Efficiency Model" in the literature. The main idea in this method is to compare the DMU studied with the linear combinations of all other DMUs. For this purpose, the examined DMU removes from the reference set. Thus, the fully efficient DMU will provide the largest increase in the inputs while maintaining its efficiency. The DMU with the highest SE score will rank first place in the ranking. Other DMUs will be ranked from large to small, according to the SE score they have(Andersen and Petersen, 1993: 1261 - 1264) [6].
Şimşek T. and Şimşek A.B., in their research that named "Unskilled Employee Selection Within The Scope Of Social Responsibility" published in 2017, persons who need to be employed from the 25-member candidate group were identified with DEA. And the employment priority was determined by the SE method. As can be seen from this example, it is important that to rank the fully efficient DMUs among themselves [7].
2.2.1. Super Efficiency Models and Mathematical Expressions
The main difference of the super efficiency models from the basic DEA models is that the analysis is performed by subtracting the examined KVB from the reference set. This enables the fully efficient DMUs be ranked among themselves by taking 1 or more scores. The mathematical expressions of SE models are as follows:
Input-Oriented CCR SE model
Purpose Function
min 𝜃 − 𝜀 𝑠𝑖− 𝑚
𝑖=1
− 𝜀 𝑠𝑟+ 𝑠
𝑟 =1
𝑖 = 1, … , 𝑚
Subject to
𝑋𝑖𝑗
𝑛
𝑗 =1 𝑗 ≠𝑘
𝜆𝑗− 𝑠𝑖−− 𝜃𝑋𝑖𝑘 ≤ 0 𝑗 = 1, … , 𝑛
𝑌𝑟𝑗
𝑛
𝑗 =1 𝑗 ≠𝑘
𝜆𝑗 − 𝑠𝑟+− 𝑌𝑟𝑘 ≥ 0 𝑟 = 1, … , 𝑠
𝑠𝑖−, 𝑠𝑟+ , 𝜆𝑗 ≥ 0 (𝑗 ≠ 𝑘)
Input-Oriented BCC SE model
Purpose Function
𝑚𝑖𝑛𝜃𝑘− 𝜀 𝑠𝑖− 𝑚
𝑖=1
− 𝜀 𝑠𝑟+ 𝑠
𝑟 =1
Subject to
𝑋𝑖𝑗
𝑛
𝑗 =1 𝑗 ≠𝑘
𝜆𝑗− 𝑠𝑖−− 𝜃𝑘𝑋𝑖𝑘 ≤ 0 𝑖 = 1, … , 𝑚𝑗
= 1, … , 𝑛
𝑌𝑟𝑗
𝑛
𝑗 =1 𝑗 ≠𝑘
𝜆𝑗 − 𝑠𝑟+− 𝑌𝑟𝑘 ≥ 0 𝑟 = 1, … , 𝑠
𝑠𝑖−, 𝑠𝑟+ , 𝜆𝑗 ≥ 0 (𝑗 ≠ 𝑘)
Output-Oriented CCR SE model
Purpose Function
𝑚𝑎𝑥𝜑 − 𝜀 𝑠𝑖−
𝑚
𝑖=1
+ 𝜀 𝑠𝑟+ 𝑠
𝑟 =1
Subject to
𝑋𝑖𝑗
𝑛
𝑗 =1 𝑗 ≠𝑘
𝜆𝑗+ 𝑠𝑖−− 𝑋𝑖𝑘 ≤ 0 𝑗 = 1, … , 𝑛𝑖
= 1, … , 𝑚
𝑌𝑟𝑗
𝑛
𝑗 =1 𝑗 ≠𝑘
𝜆𝑗 + 𝑠𝑟+− 𝜑𝑌𝑘 ≥ 0 𝑟 = 1, … , 𝑠
𝑠𝑖−, 𝑠𝑟+ , 𝜆𝑗 ≥ 0 (𝑗 ≠ 𝑘)
Output-Oriented BCC SE model
Purpose Function
𝑚𝑎𝑥𝜑 − 𝜀 𝑠𝑖−
𝑚
𝑖=1
+ 𝜀 𝑠𝑟+ 𝑠
𝑟 =1
Subject to
𝑋𝑖𝑗
𝑛
𝑗 =1 𝑗 ≠𝑘
𝜆𝑗+ 𝑠𝑖−− 𝑋𝑖𝑘 ≤ 0 𝑗 = 1, … , 𝑛𝑖 = 1, … , 𝑚
𝑌𝑟𝑗
𝑛
𝑗 =1 𝑗 ≠𝑘
𝜆𝑗 − 𝑠𝑟+− 𝜑𝑌𝑟𝑘 ≥ 0 𝑟 = 1, … , 𝑠
𝜆𝑗 = 1
𝑛
𝑗 =1 𝑗 ≠𝑘
𝑠𝑖−, 𝑠𝑟+ , 𝜆𝑗 ≥ 0 (𝑗 ≠ 𝑘)
s+:input slack variable s-: output slack variable θk: input efficiency 𝜑: output efficiency
3.
MATERIAL
The selection of the programming languages used in the research, the determination of the inputs and outputs, and the application itself have been described in this section.
3.1.Decision Making Units
It has been decided to use the programming languages which have the highest number of stars on Github and which that most searched in popular search engines according to TIOBE index, as DMUs in this research. For this purpose, the programming languages, which are among the first 50 languages in the two lists and which do not interfere with the collection of the input and output data, have been selected. As a result, the following 18 programming languages have been designated as DMUs.
Table 3.1. Decision Making Units
Decision Making Units- Programming Languages
C# Groovy Kotlin Perl R Scala
Dart Java Lua PHP Ruby Swift
Go JavaScript Objective-C Python Rust TypeScript
The most widely accepted situation in determining the number of DMUs in the literature is that the DMU number is at least 2 times the number of inputs + outputs. In this research at least 12 DMUs have been required because of using 4 inputs and 2 outputs. Considering this situation, to choose 18 DMUs is healthy enough for the research.
3.2.Inputs
A large part of the input data has been obtained from Github.com [8]. Github; At a high level, is a cloud-based service and website that enables more than 31 million programmers from all over the world to store and manage their code, to make version control and collaborate with each [9]. As input; repositories, commits, contributors and users have been determined. Since Github is a very active website, the data belong to the inputs are constantly being changed. Input data used in this research were collected on May 7.
Repositories: They are the virtual space where programmers can store the codes they use, present to other users, manage any changes to their codes. They're some sort of code library. Therefore, they play an important role in the efficiency of a programming language. The input data is based on the number of repositories that have received at least 1 star by users.
Commits: It is the number of operations such as adding-removing, modifying, and saving the code on the code sequence of a language during a project and development. The high number of transactions does not necessarily mean that the language is used very much, but it is parallel.
Contributors: It is the number of people contributing to the development of a programming language from its establishment to the present. Some programming languages present themselves as open source, and if they come with an important suggestion, they allow every programmer around the world to contribute to the development of the language. On the other hand, some programming languages only provide this development with their own developers.
Users: It indicates the number of developers using the language examined on Github. Not every user has to be an expert on the language in question.
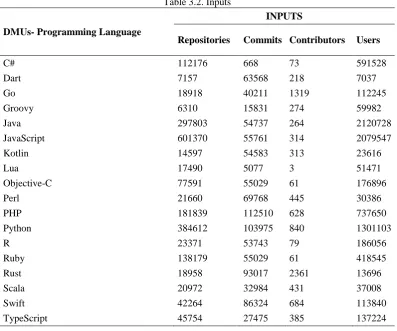
Table 3.2. Inputs
DMUs- Programming Language
INPUTS
Repositories Commits Contributors Users
C# 112176 668 73 591528
Dart 7157 63568 218 7037
Go 18918 40211 1319 112245
Groovy 6310 15831 274 59982
Java 297803 54737 264 2120728
JavaScript 601370 55761 314 2079547
Kotlin 14597 54583 313 23616
Lua 17490 5077 3 51471
Objective-C 77591 55029 61 176896
Perl 21660 69768 445 30386
PHP 181839 112510 628 737650
Python 384612 103975 840 1301103
R 23371 53743 79 186056
Ruby 138179 55029 61 418545
Rust 18958 93017 2361 13696
Scala 20972 32984 431 37008
Swift 42264 86324 684 113840
TypeScript 45754 27475 385 137224
The R programming language has been stated the "Contributors" data on Github as 0 (zero). However, each programming language needs at least 1 developer, ie contributors who contribute to the development of the language. Therefore, in order to reach the actual data, the number of the persons who stated that they contributed to the development of the language on the official web site of the R programming language have been counted as 79 [10].
The data of the "Commits" and "Contributors” of the Java programming language could not obtained from Github's profile. However, the necessary data has been collected from Github based on Open JDK, the largest free and open source platform of Java programming language.
3.3.Outputs
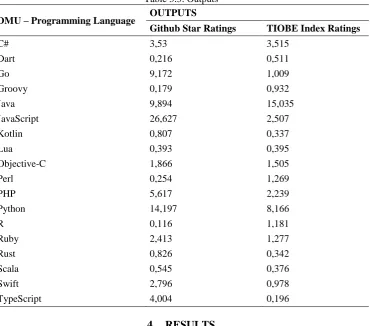
Github star ratings and the TIOBE index have been determined as the outputs.
Github star ratings: The level of stars received by a programming language is an indicator that how much the programming language is liked, useful and has potencial to be useful in the future. So, it is a evaluation method for programmers on Github. The Github percentages used in this research are the first quarter data of 2019, which has been collected from https://madnight.github.io/githut/#/stars/2019/1 [11]based on the Githut 2.0 project. Githut 2.0is a project designed to follow the development of Github. Githut shows Github data in percentages.
The TIOBE index data used in this study belongs to April 2019.The output data of the selected DMUs are given in Table 3.3.
Table 3.3. Outputs
DMU – Programming Language OUTPUTS
Github Star Ratings TIOBE Index Ratings
C# 3,53 3,515
Dart 0,216 0,511
Go 9,172 1,009
Groovy 0,179 0,932
Java 9,894 15,035
JavaScript 26,627 2,507
Kotlin 0,807 0,337
Lua 0,393 0,395
Objective-C 1,866 1,505
Perl 0,254 1,269
PHP 5,617 2,239
Python 14,197 8,166
R 0,116 1,181
Ruby 2,413 1,277
Rust 0,826 0,342
Scala 0,545 0,376
Swift 2,796 0,978
TypeScript 4,004 0,196
4.
RESULTS
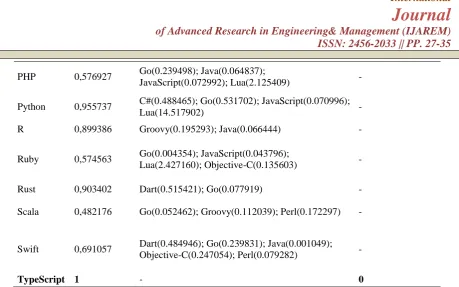
In order to perform SE analysis, it is necessary to find fully efficient DMUs. For this purpose, input-oriented CCR method has been performed in the first part of the analysis. The findings have been presented in Table 4.1.
Table 4.1. Input Oriented CCR Analysis Findings
DMU Efficiency
Score Reference Set
Number of References
C# 1 - 1
Dart 1 - 3
Go 1 - 7
Groovy 1 - 2
Java 1 - 3
JavaScript 1 - 3
Kotlin 0,630904 Dart(0.457253); Go(0.073236);
Objective-C(0.019567) -
Lua 1 - 3
Objective-C 1 - 3
PHP 0,576927 Go(0.239498); Java(0.064837);
JavaScript(0.072992); Lua(2.125409) -
Python 0,955737 C#(0.488465); Go(0.531702); JavaScript(0.070996);
Lua(14.517902) -
R 0,899386 Groovy(0.195293); Java(0.066444) -
Ruby 0,574563 Go(0.004354); JavaScript(0.043796);
Lua(2.427160); Objective-C(0.135603) -
Rust 0,903402 Dart(0.515421); Go(0.077919) -
Scala 0,482176 Go(0.052462); Groovy(0.112039); Perl(0.172297) -
Swift 0,691057 Dart(0.484946); Go(0.239831); Java(0.001049);
Objective-C(0.247054); Perl(0.079282) -
TypeScript 1 - 0
When Table 4.1 was examined, 10 out of 18 DMUs (C #, Dart, Go, Groovy, Java, JavaScript, Lua, Ojective-C, Perl, TypeScript) have been found efficient with 1 efficiency score. Other DMUs are inefficient. The "Number of References" column shows that how many times a fully efficient DMU has been referenced. Scala is the DMU with the lowest efficiency score by 0,482176.Go has been the most referenced DMU with 7 times. Although TypeScript is a fully efficient DMU, it has not been taken reference by any inefficient DMU.
When Table 4.1 is examined, it is seen that 55,56% of DMUs are fully efficient. Since this percentage is very high, it is difficult to determine which programming language uses the resources more efficiency. The SE method is used to resolve this issue. Table 4.2 shows the findings of Super Efficiency analysis.
Table 4.2. Super Efficiency Analysis Findings
DMU Efficiency Score
Super Efficiency Score
Super Efficiency Reference Set
Super Efficiency – Number Of References
C# 1 22,558192 Java(0.225664); JavaScript(0.048720) 3
Dart 1 1,869982 Go(0.004222); Perl(0.372338);
Rust(0.100126) 1
Go 1 5,676917 Groovy(0.606584); TypeScript(2.263592) 4
Groovy 1 2,605537 Java(0.012945); Perl(0.581064) 3
Java 1 1,535425 C#(3.760372); Groovy(0.043854);
R(1.504166) 3
JavaScript 1 1,904921 C#(5.043708); Lua(17.775517);
TypeScript(0.458774) 4
Kotlin 0,630904 0,630904 Dart(0.457253); Go(0.073236);
Objective-C(0.019567) -
Lua 1 2,723083 C#(0.109347); Java(0.000708) 3
Objective-C 1 1,111707
Go(0.042821); JavaScript(0.000781);
Perl 1 1,451877 Dart(1.452760); Groovy(0.565064) 2
PHP 0,576927 0,576927 Go(0.239498); Java(0.064837);
JavaScript(0.072992); Lua(2.125409) -
Python 0,955737 0,955737 C#(0.488465); Go(0.531702);
JavaScript(0.070996); Lua(14.517902) -
R 0,899386 0,899386 Groovy(0.195293); Java(0.066444) -
Ruby 0,574563 0,574563 Go(0.004354); JavaScript(0.043796);
Lua(2.427160); Objective-C(0.135603) -
Rust 0,903402 0,903402 Dart(0.515421); Go(0.077919) -
Scala 0,482176 0,482176 Go(0.052462); Groovy(0.112039);
Perl(0.172297) -
Swift 0,691057 0,691057
Dart(0.484946); Go(0.239831);
Java(0.001049); Objective-C(0.247054); Perl(0.079282)
-
TypeScript 1 1,021158 Go(0.285693); JavaScript(0.051963) 2
When Table 4.2 is examined, it has seen that the SE scores of the fully efficient DMUs are higher than 1 and the efficiency scores of the inefficient DMUs are the same as those in the input-oriented CCR analysis. As SE scores increase, the efficiency of DMUs is increasing. In this case, the most efficient DMU is the C# programming language with the score of 22,558192 SE. After the C# programming language, the Go programming language comes with the score of 5,676917 SE. The TypeScript programming language is the last in the SE ranking with the score of 1.021158 SE.
As a result of the SE analysis, it is seen that the most frequently referenced DMUs are Go and JavaScript by 4 times. Although it has not been taken as reference by any DMUs in the CCR analysis, TypeScript has been taken as a reference by Go and JavaScript in the SE analysis. C#, which the most efficient DMU, has been shown 3 times as a reference by fully efficient DMUs.
5.
CONCLUSION
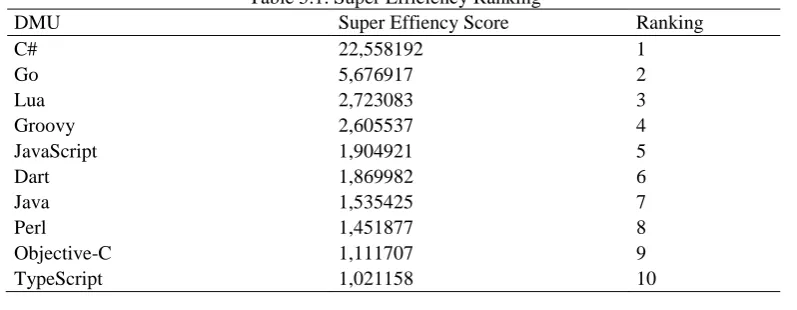
In this research, relative efficiency between the 18 commonly used programming languages has been measured by DEA and SE. At the end of DEA, 10 fully efficient DMUs have been found. All of these fully efficient DMUs have been taken 1 efficiency score. Therefore, they could not be ranked among themselves. Moreover, this situation has been prevented the determination of the most efficient DMU. SE method has been needed in this part of the research. The fully efficient DMUs have been ranked among themselves with SE method. The SE scores and rankings of the programming languages are as follows:
Table 5.1. Super Efficiency Ranking
DMU Super Effiency Score Ranking
C# 22,558192 1
Go 5,676917 2
Lua 2,723083 3
Groovy 2,605537 4
JavaScript 1,904921 5
Dart 1,869982 6
Java 1,535425 7
Perl 1,451877 8
Objective-C 1,111707 9
The programming language that used its resources most efficient, according to this ranking is C#. This research has been showed that the SE method has an important place in efficiency measurement. In addition, the efficiency of programming languages has been viewed from a different perspective. In the future, with using DEA and SE, new findings regarding programming languages can be achieved by expanding or modifying the input and output sets in this research.
REFERENCES
[1]. M. J. Farrell, The Measurement of Productive Efficiency, Journal of the Royal Statistical Society, 120, 1957, 253-290.
[2]. Charnes A. Charnes, W.W. Cooper, A.Y. Lewin, L.M. Seiford, Data Envelopment Analysis: Theory,
Methodology and Applications (Kluwer Academic Publisher, Boston, 1994)
[3]. R. D. Banker, A. Charnes, W. W. Cooper, Models for Estimation of Technical and Scale In effciencies
in Data Envelopment Analysis, Manage. Sci. 30, 1984, 1078-1092
[4]. O.R. Yolalan, İşletmeler Arası Göreli Etkinlik Ölçümü (MPM Yayınları, No: 483, Ankara, 1993)
[5]. Charnes, A., Cooper, W.W. ve Rhodes, E. “Measuring the Efficiency of Decision Making Units”, European Journal of Operational Research, Vol.: 2, No: 6, 1978, 429-444.
[6]. P. Andersen, N.C. Petersen, A Procedure for Ranking Efficient Units in Data Envelopment
Analysis, Management Science, 39, 1993, 1261-1264.
[7]. T. Şimşek, A.B. Şimşek, Sosyal Sorumluluk Kapsamında Vasıfsız Çalışan Seçimi, Gazi İktisat ve İşletme Dergisi, 3(2): 2017, 1-18.
[8]. https://github.com/
[9]. https://kinsta.com/knowledgebase/what-is-github/
[10]. https://www.r-project.org/contributors.html
[11]. https://madnight.github.io/githut/#/stars/2019/1