R E S E A R C H A R T I C L E
Open Access
Tumor microenvironment dictates
regulatory T cell phenotype: Upregulated
immune checkpoints reinforce suppressive
function
Hye Ryun Kim
1†, Hyo Jin Park
2†, Jimin Son
2†, Jin Gu Lee
3, Kyung Young Chung
3, Nam Hoon Cho
4, Hyo Sup Shim
4,
Seyeon Park
2, Gamin Kim
1, Hong In Yoon
5, Hyun Gyung Kim
6, Yong Woo Jung
6, Byoung Chul Cho
1,
Seong Yong Park
3*, Sun Young Rha
1*and Sang-Jun Ha
2*Abstract
Background:Regulatory T (Treg) cells have an immunosuppressive function in cancer, but the underlying mechanism of immunosuppression in the tumor microenvironment (TME) is unclear.
Methods:We compared the phenotypes of T cell subsets, including Tregcells, obtained from peripheral blood, malignant effusion, and tumors of 103 cancer patients. Our primary focus was on the expression of immune checkpoint (IC)-molecules, such as programmed death (PD)-1, T-cell immunoglobulin and mucin-domain containing (TIM)-3, T cell Ig and ITIM domain (TIGIT), and cytotoxic T lymphocyte antigen (CTLA)-4, on Tregcells in paired lymphocytes from blood, peritumoral tissue, and tumors of 12 patients with lung cancer. To identify the
immunosuppressive mechanisms acting on tumor-infiltrating Tregcells, we conducted immunosuppressive
functional assays in a mouse model.
Results:CD8+, CD4+T cells, and Tregcells exhibited a gradual upregulation of IC-molecules the closer they were to the tumor. Interestingly, PD-1 expression was more prominent in Tregcells than in conventional T (Tconv) cells. In lung cancer patients,higher levels of IC-molecules were expressed on Tregcells than on Tconvcells, and Tregcells were also more enriched in the tumor than in the peri-tumor and blood. In a mouse lung cancer model, IC-molecules were also preferentially upregulated on Tregcells, compared to Tconvcells. PD-1 showed the greatest increase on most cell types, especially Tregcells, and this increase occurred gradually over time after the cells entered the TME. PD-1 high-expressing tumor-infiltrating Tregcells displayed potent suppressive activity, which could be partially inhibited with a blocking anti-PD-1 antibody.
Conclusions:We demonstrate that the TME confers a suppressive function on Tregcells by upregulating IC-molecule expression. Targeting IC-IC-molecules, including PD-1, on Tregcells may be effective for cancer treatment.
Keywords:Tumor microenvironment, Regulatory T cells, Immune checkpoints, Programmed cell death 1 receptor
© The Author(s). 2019Open Access This article is distributed under the terms of the Creative Commons Attribution 4.0 International License (http://creativecommons.org/licenses/by/4.0/), which permits unrestricted use, distribution, and reproduction in any medium, provided you give appropriate credit to the original author(s) and the source, provide a link to the Creative Commons license, and indicate if changes were made. The Creative Commons Public Domain Dedication waiver (http://creativecommons.org/publicdomain/zero/1.0/) applies to the data made available in this article, unless otherwise stated.
* Correspondence:[email protected];[email protected];[email protected] †Hye Ryun Kim, Hyo Jin Park, Jimin Son contributed equally to this work and
are joint first authors.
3
Department of Thoracic and Cardiovascular Surgery, Yonsei University College of Medicine, 50 Yonsei-ro, Seodaemun-Gu, Seoul 120-752, South Korea
1Yonsei Cancer Center, Division of Medical Oncology, Yonsei University
College of Medicine, 50 Yonsei-ro, Seodaemun-Gu, Seoul 120-752, South Korea
2Department of Biochemistry, College of Life Science & Biotechnology,
Yonsei University, Seoul, South Korea
Background
The recent development of immune checkpoint inhibi-tors (ICIs) has revolutionized cancer treatment. ICIs spe-cific for anti-cytotoxic T lymphocyte antigen (CTLA)-4 or anti-programmed death (PD)-1 have improved patient survival and have been approved for the treatment of several cancer types, including non-small cell lung can-cer (NSCLC), melanoma, head and neck cancan-cer, bladder cancer, and renal cell cancer [1–3].
The tumor microenvironment (TME) and the immune system play critical roles in cancer progression and clin-ical outcome [4, 5]. Regulatory T (Treg) cells are highly
immunosuppressive and contribute to the maintenance of self-tolerance and immune homeostasis in humans [6, 7]. Treg cells infiltrate tumors and promote their
pro-gression by suppressing antitumor immunity in the
TME. Depleting Treg cells can lead to spontaneous
tumor regression due to enhanced antitumor response [7, 8]. Interaction of Tregcells with TME enhances their
immunosuppressive function and proliferative capacity. Several studies have shown that tumor-infiltrating Treg
cells are phenotypically distinct from those in peripheral blood (PB) and normal tissues [9, 10], suggesting that their immunosuppressive function depends on environ-mental factors.
Tregcells suppressive functions are associated with the
expression of several immune checkpoint molecules (ICs), such as PD-1, CTLA-4, T-cell immunoglobulin and mucin-domain containing-3 (TIM)-3, and T cell Ig and ITIM domain (TIGIT) [3, 6, 11–14]. CTLA-4 and TIGIT act as tumor suppressors and thus, modulate the immune response in the TME [6, 15, 16]. Although the PD-1/PD ligand (PD-L)1 interaction was shown to pro-mote the conversion of conventional T (Tconv) cells into
Treg cells to maintain the latter’s population [17–19], it
remains controversial whether PD-1 expression by Treg
cells suppresses antigen-specific T cell immune re-sponses [20–22].
Recent studies have reported that IC-molecules are
upregulated on Treg cells within the TME or upon
chronic infection and that Treg cells-mediated
immuno-suppression correlates with the expression of IC-molecules on these cells [6, 12]. The upregulation of these molecules has also been linked to tumor progres-sion, as it likely reinforces the suppressive function of Treg cells in the TME. We previously reported that an
increased level of PD-1 on Tregcells during chronic viral
infection enhances CD8+ T cell immune suppression via interaction with PD-L1 on CD8+ T cells [12]. On the contrary, high PD-1 expression on Treg cells indicates
dysfunctional and exhausted IFN-γ-secreting Treg cells
that are enriched in tumor infiltrates and have possibly lost their suppressive function [23]. So far, the precise role of PD-1 in the function of tumor-infiltrating Treg
cells in the TME is controversial. Given the significance of PD-1 in modulating immune responses and its para-doxical role as both an activation and exhaustion marker, clarifying the function of PD-1-positive Tregcells
and their role in regulating anti-tumor immune re-sponses is important [23].
To evaluate the suppressive function of tumor-infiltrating Treg cells in the TME, we comprehensively
compared the phenotypes of T cell subsets, including Treg cells, obtained from PB, malignant effusion (ME),
and tumor (TM) samples of patients with cancer. We also characterized Treg cells in paired lymphocyte
sam-ples obtained from blood, peri-tumoral tissue, and tu-mors of patients with lung cancer. Using a lung cancer mouse model, we investigated the suppressive function and mechanism of action of tumor-infiltrating Tregcells
in the TME. We found that PD-1 was upregulated in tumor-infiltrating Treg cells and played a role in
sup-pressing CD8+ T cell proliferation through PD-1/PD-L1 interactions. These results suggest that infiltrated PD-1-expressing Tregcells in TME are a potential therapeutic
target for anti-cancer treatment.
Methods Study design
Patients with stage IV cancer with ME and patients with cancer who planned to undergo surgical resection be-tween April 2012 and December 2017 at the Severance Hospital were prospectively enrolled. Inclusion criteria were as follows: 1) over 20 years old; 2) stage IV cancer with malignant pleural effusion or ascites confirmed by cytology, or cancer with scheduled surgery; and 3) writ-ten informed consent. We collected 300 cc of effusions and simultaneously obtained 10 cc of PB from patients with stage IV cancer with ME, if available. In patients who underwent surgery, we collected TM-adjacent nor-mal tissue, and 10 cc of PB to isolate peripheral blood lymphocytes (PBLs). The study was approved by the In-stitutional Review Board of Severance Hospital. We cate-gorized the samples into three groups: 1) PBLs, 2) ME from patients with stage IV cancer, and 3) TM from pa-tients with cancer who underwent surgery. To analyze the characteristics of Tregcells in TME, we also collected
paired peritumoral tissue lymphocytes (pTILs), tumor-infiltrating lymphocytes (TILs), and PBLs at the same day from 12 patients with NSCLC who underwent cura-tive resection.
were chopped and then incubated with a solution con-taining 1 mg/mL collagenase type IV (Worthington Bio-chemical) and 0.01 mg/mL DNaseI (Sigma-Aldrich) at 37 °C for 25 min. TILs were isolated by Percoll gradient
after washing dissociated tissues with ice-cold
RPMI1640.
Flow cytometry and antibodies
Flow cytometry was performed using a FACS CANTOII (BD Biosciences, Franklin Lakes, NJ, USA) and Cyto-FLEX (Beckman Coulter, IN, USA). Data were analyzed using FlowJo software (Tree Star, OR, USA).
For immunolabeling of human samples, fluorophore-conjugated monoclonal antibodies against the following proteins were used: CD4 (RPA-T4), CD3 (OKT3), PD-1 (EH12.2H7), and CTLA-4 (BNI3) (all from Biolegend, San Diego, CA, USA); TIM-3 (344823) and TIGIT (741182) (both from R & D Systems, Minneapolis, MN, USA); CD25 (M-A251) (BD Biosciences, Franklin Lakes, NJ, USA); and Foxp3 (PCH101) (eBioscience, San Diego, CA, USA). The LIVE/DEAD Fixable Red Dead Cell Stain kit was from Invi-trogen (Carlsbad, CA, USA). Tregcells labeled with various
antibodies (except for the antibody against Foxp3) were
fixed and permeabilized with Foxp3 fixation/
permeabilization solution (eBioscience). Foxp3 antibody was then administered for intracellular labeling of Tregcells.
The proportion of CD4+ and CD8+ T cells among total
lymphocytes was determined, and the fraction of Foxp3-positive CD4+T cells was quantified.
For immunolabeling of mouse samples, fluorophore-conjugated monoclonal antibodies against the following
proteins were used: CD4 (RM4–5), Ly5.1 (A20), PD-1
(29F.1A12), TIM-3 (RMT3–23), NK1.1 (PK136), and DX5
(DX5) (all from Biolegend); and CD8 (53-6.7), CD25 (PC61.5), CTLA-4 (UC10-4B9), TIGIT (G1GD7), and F4/ 80 (BM8) (all from eBioscience); and CD11b (M1/79) (BD Biosciences). The LIVE/DEAD Fixable Near-IR Dead Cell Stain kit was from Invitrogen. Tregcells labeled with various
antibodies (except for the antibodies against Foxp3 and CTLA-4) were fixed and permeabilized with Foxp3 fix-ation/permeabilization solution (eBioscience, San Diego, CA, USA). Foxp3 antibody was then administered for intra-cellular labeling of Tregcells. The proportions of CD4+and
CD8+ T cells among lymphocytes were determined, and
the fraction of Foxp3-positive CD4+T cells was quantified. To prevent myeloid cells from non-specific staining,
sam-ples were preincubated with anti-CD16/32 (93)
(eBioscience) before immunolabeling with fluorophore-conjugated antibodies.
Mouse TM model and lymphocyte isolation
Female C57BL/6, C57BL/6-Rag2−/−, and C57BL/6-Ly5.1 congenic mice (5–6 weeks) were purchased from Charles River Laboratories (Wilmington, MA, USA) and Jackson
Laboratories (Bar Harbor, ME, USA). To generate lung TM bearing mice, 5 × 10⁵TC-1 cells were intravenously injected into C57BL/6 mice via the tail-vein. Mice were sacrificed on day 21 post-injection. Lymphocytes were isolated from the spleen, normal lung, and lung tumor as previously described [9]. The number of tumor nod-ules on left upper lobe of the lung was counted at day 12, 16, and 21 post-injection. All animal protocols were approved by the Institutional Animal Care and Use Committee of the Yonsei University Laboratory Animal Research Center (2013–0115).
In vitro suppression assay using mouse lymphocytes For the Tregcells suppression assay, CD4+CD25+Tregcells
(105/well) were co-cultured with CD8+ T cells (105/well) with Dynabeads mouse T-activator CD3/CD28 (Thermo Fisher Scientific, Waltham, MA, USA) in a 96-well U-bottom plate at 37 °C for 72 h. For the CellTrace Violet di-lution assay, CD8+T cells were isolated from the spleen of naïve mice using a CD8+T Cell Isolation kit (Miltenyi Bio-tec, Bergisch Gladbach, Germany) and labeled with 5μM CellTrace Violet (Thermo Fisher Scientific). CD4+CD25+ Treg cells were separately isolated from the spleen and
tumor of TM-bearing mice on day 21 post-injection using CD4+CD25+Regulatory T Cell Isolation kit (Miltenyi Bio-tec, Bergisch Gladbach, Germany). To inhibit cell migra-tion, Transwell membranes (0.4 mm pore; BD Biosciences) were inserted into 24-well plate. CD4+CD25+ Treg cells
(106/well) were co-cultured with CD8+ T cells (106/well) with Dynabeads mouse T-activator CD3/CD28 (Thermo Fisher Scientific) in a 24-well plate at 37 °C for 72 h.
For PD-1 blockade in tumor-infiltrating Treg,
CD4+CD25+ Treg cells (2.5 × 10⁴/well) isolated from
tumor lymphocytes of TM bearing mice on day 14
post-injection were preincubated with 10μg/mL anti-PD-1
antibody (RMP1–14) or rat IgG2a isotype control (2A3) (Bio X Cell) at 4 °C for 1 h, washed twice, and then co-cultured with CD8+ T cells (105/well) in the presence of mouse T-activator CD3/CD28 Dynabeads for 68 h.
Adoptive cell transfer for in vivo suppression assay To examine the functionality of TIL Treg (PD-1hi) and
spleen Treg(PD-1lo) cells, CD4+CD25+Tregcells were
iso-lated from the tumor and spleen of TM bearing mice at day 21 post-injection using CD4+CD25+Regulatory T Cell Isolation kit (Miltenyi Biotec). Ly5.1+ CD8+ T cells were isolated from naïve C57BL/6-Ly5.1 congenic mice. Ly5.1+ CD8+ T cells (2 × 10⁶) were injected i.v. into recipient Rag2−/−mice alone or with Ly5.2+TIL Tregor spleen Treg
In vitro suppression assay using human lymphocytes CD4+CD25+ Treg cells were isolated from the tumor
tis-sue and peripheral blood of NSCLC patients, using
hu-man CD4+CD25+CD127dim/− Regulatory T Cells
Isolation Kit II (Miltenyi Biotec, Bergisch Gladbach,
Germany). CD8+ T cells were isolated from the paired
peripheral blood of NSCLC patients using human CD8+
T Cell Isolation kit (Miltenyi Biotec, Bergisch Gladbach, Germany) and subsequently labeled with 5μM CellTrace Violet. The CD8+ T cells (105/well) were co-cultured with CD4+CD25+ Treg cells (5 × 10⁴/well) isolated from
either tumor tissue or peripheral blood in the presence
of 2.5μl/well of Dynabeads human T-activator CD3/28
(Thermo Fisher Scientific) at 37 °C for 72 h.
Multi-color immunofluorescence analysis
For multicolor immunofluorescence analysis, lungs were isolated, fixed with 2% paraformaldehyde/phosphate buff-ered saline overnight at 4 °C, and then embedded in OCT compound (Sakura). Tissue blocks were frozen in 2-methyl butane and cooled on dry ice. Frozen blocks were cut to a thickness of 8μm and mounted on the silane-coated slide. Sections were stained with 4,6-diamidino-2-phenylindole
(DAPI; Invitrogen) and with antibodies for anti-CD8α
(Clone 53–6.7), anti-CD4 (clone RM4–5), anti-CD279 (clone RMP1–30), and anti-GFP (clone 1GFP63) for ampli-fication of Foxp3-GFP signals (Biolegend). Streptavidin-conjugated horseradish peroxidase was used for staining of biotin-conjugated antibodies, and TSA Cyanine 3 Tyrami-detetramethylrhodamine reagent (SAT704A001EA; Perki-nElmer) was subsequently added for amplification. Images was acquired using a microscope (Carl Zeiss Co. Ltd) and analyzed with ImageJ 1.50b software.
Statistical analysis
Data were analyzed using Prism 5.0 software (GraphPad Inc., CA, USA). The Student’st-test, one-way analysis of variance, and the least significant difference test were used, where appropriate, to evaluate the significance of differences among groups. All statistical analyses were conducted with a significance level ofα= 0.05 (P< 0.05).
Results
Patient characteristics
We enrolled 103 patients: 72 were stage IV cancer pa-tients with ME, and 31 were papa-tients with operable dis-ease (not stage IV) who underwent surgical resection. Detailed information of the patients from which PB, ME, or TM were obtained is described in Additional file 6: Table S1. The total number of tumor specimens was di-vided into three groups based on the specimen type: PB, 20.7% (28/135); ME, 56.2% (76/135); and TM, 23.1% (31/135). Detailed analyses of immune subsets as well as the levels of their immune checkpoints were performed
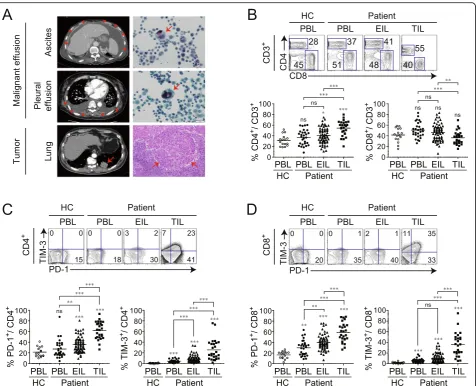
in PBLs (PB group), effusion-infiltrating lymphocytes (EILs) (ME group), and TILs (TM group). Primary can-cer types in the ME group were NSCLC, 43.1% (31/72); gastric cancer, 22.2% (16/72); colon cancer, 5.6% (4/72), and breast cancer, 5.6% (4/72). The types of ME were as-cites, 59.7% (43/76) and pleural effusion, 45.8% (33/76), with four patients having both (Additional file 6: Table S1). The presence of malignant cancer cells and TILs in TM or ME was pathologically or cytologically confirmed (Fig.1a).
Tconvwith exhausted phenotypes are abundant in TM and
ME
To investigate T cell subsets in three different tumor
specimens, we compared the ratio of CD4+ and CD8+T
cells in PBLs, EILs, and TILs isolated from PB, ME, and
TM, respectively. The percentage of CD4+ T cells was
higher among TILs than among PBLs or EILs. In con-trast, the percentage of CD8+T cells was markedly lower among TILs than among PBLs or EILs (Fig.1b), suggest-ing that the migration of cytotoxic lymphocytes (CTLs) into the TM was inhibited.
The phenotypes of PBLs, EILs, and TILs were com-pared by quantifying CD4+ and CD8+T cells expressing PD-1 and TIM-3. The percentage of PD-1- or TIM-3-expressing CD4+or CD8+T cells was the highest among TILs, with lower percentages in EILs and PBLs (Fig. 1c, d), suggesting that T cells derived from TM and ME show more pronounced T cell exhaustion than those de-rived from PBLs.
High expression of PD-1 in Tregcells of ME and TM
We next examined how Treg cells expressing forkhead
box (Fox) p3 are distributed and differ phenotypically in
PB, ME, and TMs. Treg cells showed greater
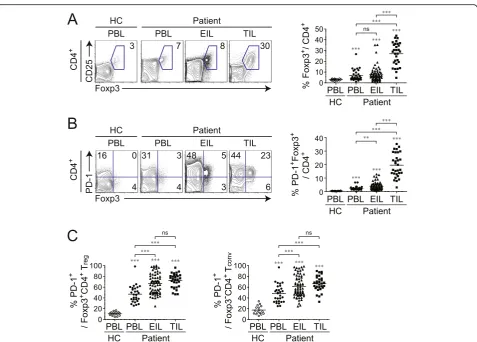
accumula-tion in TILs than in PBLs and EILs of patients or in PBLs of healthy controls (Fig.2a). Interestingly, Tregcells
in TILs expressed a higher level of PD-1 than those in
PBLs and EILs; moreover, the PD-1-expressing Foxp3+
population among CD4+ T cells was also larger in TILs than in EILs, which, in turn, had a larger population
than PBLs (Fig. 2b). To further characterize CD4+ T
cells in different tissues, we compared PD-1 in Foxp3+ and Foxp3− CD4+ T cells (Fig. 2c). The proportion of PD-1-expressing cells in both CD4+ cells was larger in EILs and TILs than in PBLs. These results indicate that PD-1 expression by Treg cells and Tconv cells clearly
re-flect the TME, as PD-1 expression increased in the fol-lowing order: TILs > EILs > PBLs.
We next investigated whether the characteristics of CD4+ T cells, CD8+ T cells, and Treg cells were altered
different types of cancer, although it is worth noting that
there were more Treg cells than there were CD4+ or
CD8+ Tconv cells expressing PD-1. Interestingly, the
de-gree of infiltration of PD-1+Tregcells did not differ among
ME samples derived from the different types of cancer, in-dicating that the presence of PD-1+ Treg cells in ME is a
common feature across cancers of distinct histological ori-gin (Additional file 1: Figure S1). Additionally, we com-pared the phenotype of Treg between ascites and pleural
effusion. As shown in Additional file2: Figure S2, signifi-cant differences of the percentages of Foxp3+ Treg and
PD-1+ Foxp3+ Treg cells were not observed between
ascites and pleural effusion. Moreover, the ascites and pleural effusions had a similar expression rate of PD-1 in Foxp3+Tregand Foxp3−Tconvcells.
Tumor-infiltrating Tregare abundant in patients with lung
cancer and express multiple IC-molecules
To clarify the characteristics of Treg cells in the TME,
we compared the frequency of Tregcells and the
expres-sion of IC-molecules such as PD-1, TIM-3, TIGIT, and CTLA-4 in paired sets of tissue-derived lymphocytes, such as PBLs, pTILs, and TILs collected from 12
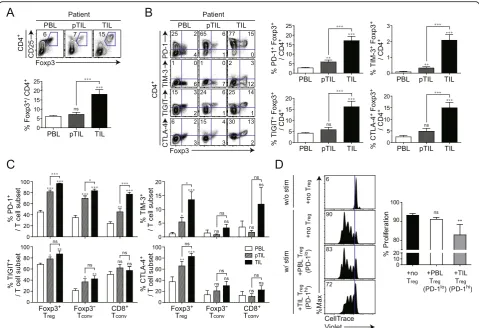
pa-tients with NSCLC. As expected, Treg cells were
more highly enriched in TILs than in pTILs and
PBLs (Fig. 3a). Moreover, more Treg-expressing ICs
were found among TILs than among pTILs and PBLs (Fig. 3b).
We also compared IC-molecule expression on ent tumor-infiltrating T cell subsets. Among four differ-ent IC-molecules, PD-1 most clearly distinguished TME in all T cell subsets, because a significant increase in the
PD-1+ population was observed in the following order
TIL > pTIL > PBL (Fig.3c). Notably, PD-1 was higher in tumor-infiltrating Foxp3+Treg cells (~ 98%) than in
Foxp3−Tconv cells (~ 82%) or CD8+ Tconv cells (78%).
Furthermore, the number of PD-1-expressing tumor-infiltrating Foxp3+ Treg cells was greater than the
num-ber of tumor-infiltrating Foxp3+ Treg cells expressing
other IC-molecules. It is therefore conceivable that PD-1 expression on Treg cells is a TME marker. Additionally,
we performed the in vitro suppressive assay using iso-lated CD4+CD25+ Treg cells from the peripheral blood
and tumor tissue of NSCLC patients and isolated CD8+
T cells from the peripheral blood. Each tumor-infiltrating Treg cells or peripheral Treg cells was
co-cultured with peripheral CD8+T cells with αCD3/CD28 stimulation. CD8+ T cells proliferated at a high rate in the absence of Treg cells and were more potently
inhib-ited by PD-1hi tumor-infiltrating Treg cells than by
PD-1loPBMC Tregcells (Fig.3d).
Tregnumbers and the expression of IC-molecules are
altered during cancer progression in a mouse model We previously showed that immune-exhaustion markers were highly expressed in tumor-infiltrating Treg cells of
patients with NSCLC. We therefore investigated the Treg
phenotype in greater detail in different tissues, using a mouse lung cancer model. We compared the expression levels of IC-molecules, such as PD-1, TIM-3, and TIGIT,
on CD4+ and CD8+ T cells in different tissues from
naïve and TM-bearing mice. As in patients with cancer Fig. 2PD-1 expression in Foxp3+T
regin different tissue types of patients with cancer.aRepresentative plots of CD25 and Foxp3 expression (left) and proportion of Foxp3+T cells (right) among CD4+T cells.bRepresentative plots of PD-1 and Foxp3 expression (left) and proportion of PD-1 and Foxp3 co-expressing cells among total CD4+T cells (right).cSummary of PD-1-positive fraction of Foxp3+T
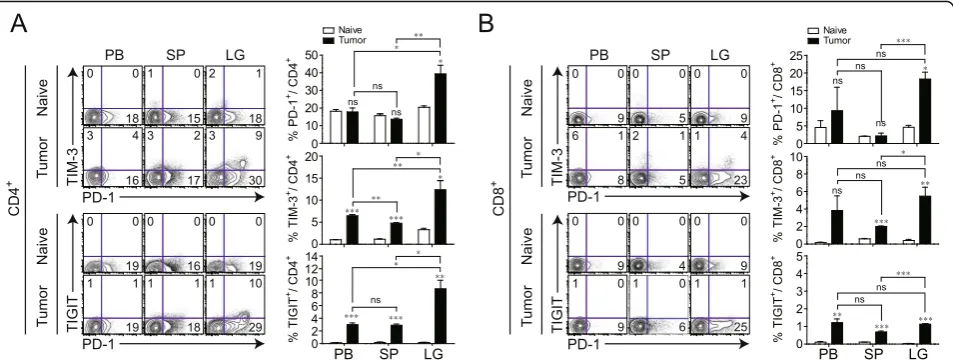
tissue, the expression of IC-molecules in CD4+ and
CD8+ T cells was much higher in lung TM than in PB
or spleen (Fig.4a, b). Among the populations expressing
IC-molecules, PD-1-expressing CD4+ and CD8+ T cells
were more abundant in the TM.
We next examined whether IC-molecules are
pref-erentially upregulated on Treg cells (compared to
Tconv) in TM, as was observed in patient tissues. PB,
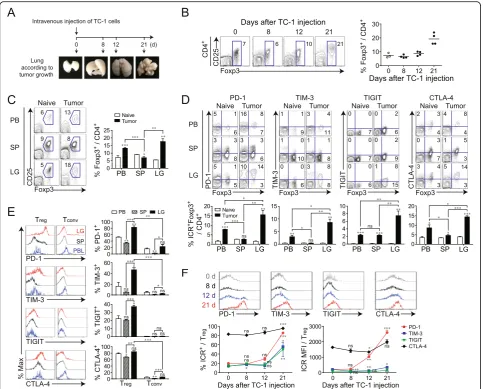
spleen, and lung lymphocytes were isolated at differ-ent time points after TC-1 injection (Fig. 5a). Starting at 12 days after TC-1 injection, an increase in the
number of Foxp3+ Treg cells was observed in TM and
the Treg cells fraction reached 20% of total CD4+ T
cells, a nearly 3-fold increase compared to that in the
non-TM lung (Fig. 5b). At 3 weeks after TC-1
injec-tion, Foxp3+ Treg cells were more abundant in the
TM than in the PB or spleen (Fig. 5c). Foxp3+ Treg
cells in TM showed significant increases in PD-1, TIM-3, TIGIT, and CTLA-4, compared to other tis-sues (Fig. 5d). Moreover, tumor-infiltrating Treg cells
expressed much higher levels of IC-molecules than tumor-infiltrating Tconv (Fig. 5e). Most Treg cells (~
80%), but only a low frequency of Tconv (~ 20%)
expressed PD-1 in TM. PD-1 was markedly upregu-lated 21 days after TC-1 injection, and the same trend was observed for TIM-3 and TIGIT, although the in-creases in the levels of these molecules were less
prominent (Fig. 5f). Unlike PD-1, TIM-3, and TIGIT,
CTLA-4 was already upregulated in Treg cells before
TC-1 injection and its expression progressively
in-creased over time (Fig. 5f). Thus, expression of
IC-molecules, especially PD-1, on Treg cells increases
Fig. 3PD-1-expressing tumor-infiltrating Tregand their activated phenotype in patients with non-small cell lung cancer (NSCLC).aCD25 and Foxp3 expression in CD4+T cells (upper) and proportion of Foxp3+cells among total CD4+T cells (lower) in peripheral blood lymphocytes (PBLs), peritumoral infiltrating lymphocytes (pTILs), and tumor-infiltrating lymphocytes (TILs) derived from patients with NSCLC.bRepresentative plots of PD-1, TIM-3, TIGIT, CTLA-4, and Foxp3 expression in CD4+T cells (left) and percentage of CD4+T cells co-expressing PD-1, TIM-3, TIGIT, CTLA-4, and Foxp3 (right).cPD-1, TIM-3, TIGIT, and CTLA-4 expression in Foxp3+T
reg, Foxp3−Tconvand CD8+Tconvof these patients.dEnhanced suppression of CD8+T cells by PD-1-expressing tumor-infiltrating T
regfrom NSCLC patients. Tregwere isolated from the peripheral blood and tumor tissue from NSCLC patients. Peripheral blood Tregand tumor-infiltrating Tregexpressed low and high levels of PD-1, respectively. CellTrace Violet (CTV)-labeled CD8+T cells were stimulated in vitro with CD3/CD28 Dynabeads for 96 h in the absence or presence of each T
with TM progression. As tumor numbers increased, immune checkpoints including PD-1, TIM-3, TIGIT, and CTLA-4 increased (Additional file 3: Figure S3).
Immunosuppressive function of tumor-infiltrating Tregin
CD8+T cell response is mediated by PD-1/PD-L1 interaction
Among all IC-molecules examined, PD-1 was most highly upregulated in tumor-infiltrating Treg cells. To
determine the role of PD-1 on tumor-infiltrating Treg
cells, in the regulation of the CD8+ T cell response, we
compared the suppressive activity of Treg expressing
high- and low-levels of PD-1 (PD-1hiTregcells from lung
TM 3 weeks after TC-1 injection vs. PD-1lo Treg cells
from the spleen of the same TM-bearing mice). CD4+CD25+Treg cells, isolated using a microbead-based
Treg isolation kit (CD4+CD25+ Regulatory T Cell
Isola-tion kit), was confirmed to be ~ 90% purified Foxp3+
Treg cells (Additional file4: Figure S4). Each population
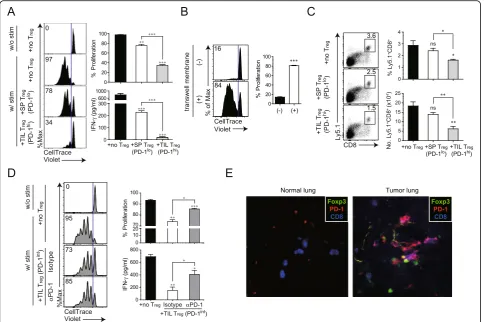
was co-cultured with naïve CD8+ cells with or without stimulation byαCD3/CD28. CD8+ T cells proliferated at a high rate in the absence of Treg cells and were more
potently inhibited by PD-1hitumor-infiltrating Treg cells
than by PD-1lospleen Treg cells (Fig.6a). Similarly,
inter-feron (IFN)-γ production was also more strongly
sup-pressed by PD-1hitumor-infiltrating Tregthan by PD-1lo
spleen Tregcells.
To investigate the role of PD-1 upregulation, induced by tumor-infiltrating Treg cells, we examined whether
the interaction between PD-1 on tumor-infiltrating Treg
cells and PD-L1 on CD8+ T cells is required for
im-munosuppression in patients with cancer. PD-1 on tumor-infiltrating Treg cells was blocked by incubation
with an anti-PD-1 antibody. Unbound antibody was sub-sequently removed and the cells were co-cultured with CD8+ T cells. We prepared Treg cells, expressing an
intermediate level of PD-1 that were isolated from lung TM in 2- rather than in 3-weeks after injection because Treg cells, highly expressing PD-1, isolated at later
time-points, also co-expressed other IC-molecules (Fig. 5), making it difficult to differentiate the role of PD-1 in the suppressive function of Tregcells from that of others.
Additionally, to clarify whether the potent suppressive function of PD-1hi tumor-infiltrating Treg cells is
medi-ated via cell-to-cell contact between Tregand CD8+cells
or soluble factors produced from Treg cells, we
con-ducted the experiments with transwell membrane system to block cell migration (Fig. 6b). Transwell membranes
were inserted into 24-well plate. CTV labeled CD8+ T
cells and CD4+CD25+ Treg were placed into lower and
upper wells, respectively, and αCD3/CD28 was added
into both wells for stimulation. Suppression of T cell proliferation was not observed in the presence of the Transwell membrane. This data demonstrated that the suppression of CD8+T cell proliferation by Tregrequires
cell to cell contact between each cell population (Fig.
6b). Next, we performed the in vivo experiment with
TIL Treg and spleen Treg cellsalong with Ly5.1+CD8+ T
cells. In line with in vitro data, when TIL Treg cells was
injected, CD8+ T cell proliferation was significantly Fig. 4Differential expression of immune checkpoint (IC) molecules on CD4+and CD8+T cells in mice with lung cancer. To induce lung
inhibited compared with spleen Treg and no Treg cells
(Fig.6c).
As shown in Fig. 6d, tumor-infiltrating Treg cells that
had been blocked with anti-PD-1 antibody, were signifi-cantly impaired in their ability to suppress the
prolif-eration of CD8+ T cells and IFN-γ production as
compared to isotype antibody-treated
tumor-infiltrating Treg cells. Given that both mouse and
hu-man CD8+ T cells can upregulate low affinity Fc
re-ceptors following activation [24, 25], we tested
whether CD8+ T cells upregulate Fc receptors in our
system. We obtained splenocytes of TC-1 tumor bear-ing mice. We stained splenocytes with CD8, CD44,
CD16/32 (FcγRIII/II), and CellTrace Violet and
com-pared the expression of Fc receptor between with and without stimulation. Significant differences of CD16/ 32 were not observed between groups with and
with-out stimulation (Additional file 5: Figure S5A). To
validate the CD16/32 antibody, we analyzed the ex-pression of CD16/32 on NK cells and macrophages. This antibody can specifically detect CD16/32 on these cells, so we excluded the possibility that no
de-tection of CD16/32 on CD8+ T cells after stimulation
could be a problem of CD16/32 antibody (Additional
file 5: Figure S5B). Taken together, our data
demon-strated that the effect of anti-PD-1 is direct effect by Fig. 5Spatial and temporal dynamics of immune checkpoint (IC) molecule expression on Tregduring cancer progression.aSchedule for
establishing the TC-1 lung adenocarcinoma model and tumor formation at each time point.bRepresentative plots showing CD25 and Foxp3 expression in CD4+T cells (left) and changes at different time points after TC-1 TM tumor cell injection (right).cRepresentative plots of T
reg(left) and summary of the proportion of Foxp3+cells among CD4+T cells (right) in peripheral blood (PB), spleen (SP), and lung (LG).dLevels of PD-1, TIM-3, TIGIT, and CTLA-4 expression on Foxp3+CD4+T
blocking of PD-1 pathway signaling rather than the effect of anti-PD-1 antibody mediated by ADCC.
A multi-color immunofluorescence analysis revealed that CD8, PD-1, and Foxp3 were co-localized in mouse tumor tissues (Fig. 6e), implying that CD8+ cells and Foxp3+Tregcells spatially interact in the TME.
Discussion
In this study, we examined the phenotype and
func-tion of Treg cells as well as CD4+ and CD8+ Tconv
cells that infiltrated into the TME, including the ME and TM from patients with cancer. We also
investi-gated the mechanism by which Treg cells induce
immunosuppression using a mouse lung cancer
model. Most tumor-infiltrating Treg cells showed
higher PD-1 expression than Tconv cells, implying that
PD-1-expressing Treg cells are a biological marker of
the TME. Indeed, in Treg cells derived from TMs of
patients with NSCLC, PD-1 was the most clearly up-regulated IC-molecule. As previously reported, these cells exhibited an enhanced immunosuppressive func-tion that was correlated with the extent of PD-1
up-regulation [12]. We speculate that PD-1-expressing
tumor-infiltrating Treg cells induce
immunosuppres-sion through the interaction of PD-1 and PD-L1, which may contribute to immune escape in TME. Fig. 6Enhanced suppressive function of PD-1-expressing tumor-infiltrating Treg.aEnhanced suppression of CD8
+
T cells by PD-1-expressing tumor-infiltrating Treg. At 3 weeks after intravenous injection of TC-1 cells, Tregwere isolated from the spleen (SP) and lung of mice with TC-1 cell-induced tumors. SP Tregand tumor-infiltrating Tregexpressed low and high levels of PD-1, respectively. CellTrace Violet (CTV)-labeled CD8+T cells were stimulated in vitro with CD3/CD28 Dynabeads for 72 h in the absence or presence of each Tregpopulation. CTV dilution in proliferating CD8+T cells is indicated in each histogram. Histograms represent the percentages of proliferating (upper) and IFN-γ-producing (lower) cells.b Contact-dependent Treg-mediated suppression of CD8+T proliferation. CTV-labeled CD8+T cells were stimulated in vitro with CD3/CD28 Dynabeads and cocultured with tumor-infiltrating Tregfor 72 h in the absence or presence of a transwell membrane.cHomeostatic proliferation of donor Ly5.1+CD8+T cells in the spleen isolated from Rag2−/−mice at 7 d after adoptive cell transfer. Representative plot (left) and absolute number (right) of donor Ly5.1+CD8+T cells in the spleen.dPD-1-mediated suppressive activity of tumor-infiltrating Tregisolated from the lungs of tumor-bearing mice 2 weeks after intravenous injection of TC-1 cells. At this time point, Tregexpressed intermediate levels of PD-1. CTV-labeled CD8+T cells were stimulated as shown in (a). Before co-culture of CD8+T cells with tumor-infiltrating Treg, the latter were pre-incubated with an anti-PD-1 antibody or its isotype as control. CTV dilution in proliferating CD8+T cells is shown in the histograms, which represent the
percentages of proliferating (upper) and IFN-γ-producing (lower) cells. (e) Representative immunofluorescence images of mouse lung tumor samples. Antibodies against Foxp3, CD8, and PD-1 were used to label and examine the interaction between Tregand CD8
+
Clarifying the link between this phenotype and en-hanced suppressive function of tumor-infiltrating Treg
cells can provide insight into their suppressive mech-anism in patients with cancer.
The predominant function of PD-1 in Tregcells seems
to be similar to that of CTLA-4; both proteins contrib-ute to the maintenance of Tregimmunosuppressive
func-tion [15]. However, PD-1 expression on Treg cells
differed by cell location. For instance, PD-1 was expressed by Treg cells in TMs but not in normal tissue
or PBLs as depicted in Fig.3. In contrast, Tregcells had
high basal CTLA-4 levels irrespective of the tissue of ori-gin. This supports our assertion that PD-1 on Treg cells
is a more useful marker for characterizing the TME. We also examined whether the upregulation of PD-1 on tumor-infiltrating Treg cells can reinforce their basal
immune-suppressive function. High PD-1 expression in Tregcells was associated with the suppression of CD8+T
cells and PD-1 blockade abrogated the immune-suppressive function of Treg cells, suggesting that an
interaction between PD-1 on Treg cells and PD-L1
expressed by another cell type—likely CD8+ T cells
[26]—is necessary for immunosuppression. Thus, ele-vated PD-1 expression on Tregcells is a potential marker
for immune escape in patients with cancer. These find-ings were consistent with our previously reported data that PD-1 upregulation in Treg cells and the interaction
between PD-1 on Treg cells and PD-L1 expressed by
ef-fector T cells enhanced T cell-mediated immune sup-pression during chronic viral infection [12]. Thus, an immunotherapy targeting Tregand PD-1 could be highly
effective in patients with cancer.
We also investigated tumor-infiltrating Treg and Tconv
cells obtained from ME of patients with stage IV cancer. Most of the earlier studies of TME Treg cells were
per-formed in mice and focused on Treg cells phenotype.
Studies in patients with stage IV cancer have been ham-pered by the difficulty of obtaining sufficient TMs for analysis of T cell populations. To overcome this limita-tion, we developed an experimental model using ME from human patients with stage IV cancer as representa-tive TME of stage IV cancer. This model will allow fu-ture examinations of various mechanistic aspects of human cancer through functional assays.
Several studies have reported IC expression on intra-tumoral Treg cells and suggested potential roles of these
ICs in the regulation of the immune response in mice [6, 15, 27]. We also showed here that ICs other than PD-1 were upregulated in Treg cells. Studies on the relative
contributions of these IC-molecules to immunosuppres-sion in the TME may lead to the development more ef-fective immunotherapies.
Regarding other PD-1-expressing immune cells than CD8+ T cells and Tregcells in TME and their role, Irving
et al. reported that tumor-associated macrophages (TAMs) expressed PD-1 and PD-1-expressing TAMs increased over time in mouse model and progressive disease in human
cancers [28]. PD-1 expressed on TAMs reduced their
phagocytic potency against tumor cells and blockade of PD-1 pathway restored the macrophage phagocytosis, resulting in enhancing anti-tumor activity of TAMs. This data suggests that PD-1 expressed by TAMs is one of the mechanism for immune evasion. PD-1 expression was also described on NK cells in many different types of human and mouse cancers, where the PD-1 expressed by NK cells negatively regulated NK cell function even though its mo-lecular mechanisms are not clearly demonstrated to date [29–34]. In addition, PD-1 has been reported to be expressed on innate lymphoid cells (ILCs), prevalently ILCs type 3 (ILC3s), as well as NK cells in pleural effusion of pri-mary and metastatic tumors, albeit the role of PD-1 on ILC3s was not addressed [35].
Based on these reports, it is plausible that PD-1 expressed by different types of immune cells including CD8+ T cells, Tregcells, NK cells, and ILCs in the TME probably
contrib-utes to immune evasion, leading to promotion of tumor cells. However, it has not been addressed yet which types of PD-1-expressing immune cells are most effectively involved in the PD-1-mediated immunosuppression. In addition, to compare the immunosuppressive activity of each immune cell subset, the level of PD-1 expression on each type of cells should be examined. In this regard, further study is needed to determine whether other PD-1-expressing immune cells than Tregcells in the TME compensate for a lack of Treg
cells and which types of PD-1-expressing immune cells mostly impact on immune suppression in the TME.
Treg cells expansion in the TME is widely recognized
as an obstacle to successful immunotherapy in patients with cancer [5]. Previously, we demonstrated that Treg
cells depletion using an anti-CD25 antibody increased
the abundance of functional antigen-specific CD8+ T
cells during chronic viral infection [12]. Furthermore, treatment with a neutralizing antibody also caused the elimination of non-Treg and rapid replenishment of Treg
cells [36]. Thus, functional inactivation of Treg cells and
rejuvenation of exhausted T cells by targeting overex-pressed PD-1 combined with temporal depletion of Treg
cells expressing IC-molecules may be a promising strat-egy to limit cancer progression.
Conclusions
In conclusion, our study provides insights into Tregcells
function and their suppressive mechanism in patients with cancer. We showed that the suppressive function of tumor-infiltrating Treg cells was enhanced by the
Supplementary information
Supplementary informationaccompanies this paper athttps://doi.org/10. 1186/s40425-019-0785-8.
Additional file 1: Figure S1. PD-1 expression on CD4+, CD8+, or T regin malignant effusion according to the different types of cancer patients in-cluding lung cancer, gastric cancer, breast cancer, and others.
Additional file 2: Figure S2. Comparison of Tregphenotype between ascites and pleural effusion. (A) Percentage of Foxp3 in total CD4+T cells between ascites and pleural effusion (B) Percentage of PD-1+Foxp3+in total CD4+T cells between ascites and pleural effusion (C) Percentage of PD-1+in Foxp3+CD4 T
regbetween ascites and pleural effusion (Left), per-centage of PD-1+in Foxp3−CD4 T cells between ascites and pleural
effusion.
Additional file 3: Figure S3. Correlation of the immune checkpoint including PD-1, TIM-3, TIGIT and CTLA4 expressed on Tregas tumor nod-ule number increased. (A) PD-1, (B) TIM-3, (C) TIGIT, and (D) CTLA-4 ex-pression on Tregaccording to the increased tumor nodules. The number of tumor nodules was measured at day 12, 16, and 21 post-injection (n= 4–7 mice per group). Data are representative of two independent experi-ments. *P< 0.05, **P< 0.01, ***P< 0.001 (Student’st-test).
Additional file 4: Figure S4. Purification of tumor-infiltrating Tregusing microbead-based Treg isolation kit. Tregwere separately isolated from the spleen and from TM-bearing mice using a CD4+CD25+Regulatory T Cell Isolation kit for suppressive function analysis. Treg, isolated using a microbead-based Treg isolation kit, demonstrated ~ 90% purified Foxp3+ Tregcompared with the 16% prior to isolation.
Additional file 5: Figure S5. Expression of CD16/32 on CD8+T cells after in vitro TCR activation and NK cells and macrophages. (A) The expression of CD16/32 on purified CD8+T cells activated by CD3/28 Dynabeads for 3 d. (B) The expression of CD16/32 on Dx5+NK1.1+NK cells and CD11b+F4/80+macrophages isolated from the spleen of naïve mouse.
Additional file 6: Table S1.Baseline characteristics of patients and specimens.
Acknowledgements Not applicable.
Declarations
This manuscript has not been published or presented elsewhere in part or in entirety and is not under consideration by another journal. All study participants provided informed consent, and the study design was approved by the appropriate ethics review board. We have read and understood your journal’s policies, and we believe that neither the manuscript nor the study violates any of these. There are no conflicts of interest to declare. The author contributions are described below.
Authors’contributions
Conception and design: HRK, SYP, SYR, S-JH. Financial support: HRK, S-JH. Ad-ministrative support: HRK, SYP, SYR, S-JH. Provision of study materials or pa-tients: HRK, HJP, JS, JGL, KYC, NHC, HSS, SP, GMK, HIY, HGK, YWJ, BCC, SYP, SYR, S-JH. Collection and assembly of data: HRK, HJP, JS, JGL, KYC, GMK, HIY, HGK, YWJ, BCC, SYP, SYR, S-JH. Data analysis and interpretation: HRK, HJP, SYP, SYR, S-JH. Manuscript writing: All authors. Final approval of manuscript: All authors.
Funding
This work was supported by grants from the National Research Foundation of the Republic of Korea (2018R1A2A1A05076997, 2017R1A5A1014560, 2018M3A9H3024850, and 2019M3A9B6065221 to S-.J.H.; 2017M3A9E9072669, 2017M3A9E8029717, 2017R1D1A1B03029874, and 2019M3A9B6065231 to H.R.K).
Availability of data and materials
All data generated or analysed during this study are included in this published article and its supplementary information files.
Ethics approval and consent to participate
The study was approved by the Institutional Review Board of Severance Hospital. All animal protocols were approved by the Institutional Animal Care and Use Committee of the Yonsei University Laboratory Animal Research Center (2013–0115).
Consent for publication All authors agreed with publication.
Competing interests
The authors declare that they have no competing interest that are relevant to this study.
Author details
1Yonsei Cancer Center, Division of Medical Oncology, Yonsei University
College of Medicine, 50 Yonsei-ro, Seodaemun-Gu, Seoul 120-752, South Korea.2Department of Biochemistry, College of Life Science & Biotechnology,
Yonsei University, Seoul, South Korea.3Department of Thoracic and Cardiovascular Surgery, Yonsei University College of Medicine, 50 Yonsei-ro, Seodaemun-Gu, Seoul 120-752, South Korea.4Department of Pathology,
Yonsei University College of Medicine, Seoul, South Korea.5Department of
Radiation Oncology, Yonsei University College of Medicine, Seoul, South Korea.6Department of Pharmacy, Korea University, Sejong, South Korea.
Received: 13 December 2018 Accepted: 22 October 2019
References
1. Gettinger SN, Horn L, Gandhi L, Spigel DR, Antonia SJ, Rizvi NA, et al. Overall survival and long-term safety of Nivolumab (anti-programmed death 1 antibody, BMS-936558, ONO-4538) in patients with previously treated advanced non-small-cell lung Cancer. J Clin Oncol. 2015;33(18):2004.https:// doi.org/10.1200/jco.2014.58.3708.
2. Garon EB, Rizvi NA, Hui R, Leighl N, Balmanoukian AS, Eder JP, et al. Pembrolizumab for the treatment of non-small-cell lung Cancer. N Engl J Med. 2015.https://doi.org/10.1056/NEJMoa1501824.
3. Ribas A. Tumor immunotherapy directed at PD-1. N Engl J Med. 2012; 366(26):2517–9.
4. Sakuishi K, Apetoh L, Sullivan JM, Blazar BR, Kuchroo VK, Anderson AC. Targeting Tim-3 and PD-1 pathways to reverse T cell exhaustion and restore anti-tumor immunity. J Exp Med. 2010;207(10):2187–94.
5. Nishikawa H, Sakaguchi S. Regulatory T cells in tumor immunity. Int J Cancer. 2010;127(4):759–67.
6. Kurtulus S, Sakuishi K, Ngiow SF, Joller N, Tan DJ, Teng MW, et al. TIGIT predominantly regulates the immune response via regulatory T cells. J Clin Invest. 2015;125(11):4053–62.
7. Scurr MJ, Pembroke T, Bloom A, Roberts DJ, Thomson A, Smart K, et al. Low-dose cyclophosphamide induces anti-tumor T-cell responses which associate with survival in metastatic colorectal cancer. Clin Cancer Res. 2017. https://doi.org/10.1158/1078-0432.ccr-17-0895.
8. Sugiyama D, Nishikawa H, Maeda Y, Nishioka M, Tanemura A, Katayama I, et al. Anti-CCR4 mAb selectively depletes effector-type FoxP3+CD4+ regulatory T cells, evoking antitumor immune responses in humans. Proc Natl Acad Sci U S A. 2013;110(44):17945–50.
9. Park HJ, Kusnadi A, Lee EJ, Kim WW, Cho BC, Lee IJ, et al. Tumor-infiltrating regulatory T cells delineated by upregulation of PD-1 and inhibitory receptors. Cell Immunol. 2012;278(1–2):76–83.
10. Kang MJ, Kim KM, Bae JS, Park HS, Lee H, Chung MJ, et al. Tumor-infiltrating PD1-positive lymphocytes and FoxP3-positive regulatory T cells predict distant metastatic relapse and survival of clear cell renal cell carcinoma. Transl Oncol. 2013;6(3):282–9.
11. Penaloza-MacMaster P, Kamphorst AO, Wieland A, Araki K, Iyer SS, West EE, et al. Interplay between regulatory T cells and PD-1 in modulating T cell exhaustion and viral control during chronic LCMV infection. J Exp Med. 2014;211(9):1905–18.
13. Sakuishi K, Ngiow SF, Sullivan JM, Teng MW, Kuchroo VK, Smyth MJ, et al. TIM3FOXP3 regulatory T cells are tissue-specific promoters of T-cell dysfunction in cancer. Oncoimmunology. 2013;2(4):e23849. 14. Gautron AS, Dominguez-Villar M, de Marcken M, Hafler DA. Enhanced
suppressor function of TIM-3+ FoxP3+ regulatory T cells. Eur J Immunol. 2014;44(9):2703–11.
15. Wing K, Onishi Y, Prieto-Martin P, Yamaguchi T, Miyara M, Fehervari Z, et al. CTLA-4 control over Foxp3+ regulatory T cell function. Science. 2008; 322(5899):271–5.
16. Sojka DK, Hughson A, Fowell DJ. CTLA-4 is required by CD4+CD25+ Treg to control CD4+ T-cell lymphopenia-induced proliferation. Eur J Immunol. 2009;39(6):1544–51.
17. Francisco LM, Salinas VH, Brown KE, Vanguri VK, Freeman GJ, Kuchroo VK, et al. PD-L1 regulates the development, maintenance, and function of induced regulatory T cells. J Exp Med. 2009;206(13):3015–29.
18. Periasamy S, Dhiman R, Barnes PF, Paidipally P, Tvinnereim A, Bandaru A, et al. Programmed death 1 and cytokine inducible SH2-containing protein dependent expansion of regulatory T cells upon stimulation with mycobacterium tuberculosis. J Infect Dis. 2011;203(9):1256–63. 19. Wang L, Pino-Lagos K, de Vries VC, Guleria I, Sayegh MH, Noelle RJ.
Programmed death 1 ligand signaling regulates the generation of adaptive Foxp3+CD4+ regulatory T cells. Proc Natl Acad Sci U S A. 2008;105(27): 9331–6.
20. Franceschini D, Paroli M, Francavilla V, Videtta M, Morrone S, Labbadia G, et al. PD-L1 negatively regulates CD4+CD25+Foxp3+ Tregs by limiting STAT-5 phosphorylation in patients chronically infected with HCV. J Clin Invest. 2009;119(3):551–64.
21. Radziewicz H, Dunham RM, Grakoui A. PD-1 tempers Tregs in chronic HCV infection. J Clin Invest. 2009;119(3):450–3.
22. Shen T, Zheng J, Liang H, Xu C, Chen X, Zhang T, et al. Characteristics and PD-1 expression of peripheral CD4+CD127loCD25hiFoxP3+ Treg cells in chronic HCV infected-patients. Virol J. 2011;8:279.
23. Lowther DE, Goods BA, Lucca LE, Lerner BA, Raddassi K, van Dijk D, et al. PD-1 marks dysfunctional regulatory T cells in malignant gliomas. JCI Insight. 2016;1(5):1.
24. Dhanji S, Tse K, Teh HS. The low affinity fc receptor for IgG functions as an effective cytolytic receptor for self-specific CD8 T cells. J Immunol. 2005; 174(3):1253–8.
25. Kudo K, Imai C, Lorenzini P, Kamiya T, Kono K, Davidoff AM, et al. T lymphocytes expressing a CD16 signaling receptor exert antibody-dependent cancer cell killing. Cancer Res. 2014;74(1):93–103. 26. Zelenay S, Lopes-Carvalho T, Caramalho I, Moraes-Fontes MF, Rebelo M,
Demengeot J. Foxp3+ CD25- CD4 T cells constitute a reservoir of committed regulatory cells that regain CD25 expression upon homeostatic expansion. Proc Natl Acad Sci U S A. 2005;102(11):4091–6.
27. Kolar P, Knieke K, Hegel JK, Quandt D, Burmester GR, Hoff H, et al. CTLA-4 (CD152) controls homeostasis and suppressive capacity of regulatory T cells in mice. Arthritis Rheum. 2009;60(1):123–32.
28. Gordon SR, Maute RL, Dulken BW, Hutter G, George BM, McCracken MN, et al. PD-1 expression by tumour-associated macrophages inhibits phagocytosis and tumour immunity. Nature. 2017;545(7655):495–9. 29. Beldi-Ferchiou A, Lambert M, Dogniaux S, Vely F, Vivier E, Olive D, et al.
PD-1 mediates functional exhaustion of activated NK cells in patients with Kaposi sarcoma. Oncotarget. 2016;7(45):72961–77.
30. Seo H, Jeon I, Kim BS, Park M, Bae EA. IL-21-mediated reversal of NK cell exhaustion facilitates anti-tumour immunity in MHC class I-deficient tumours. Nat Commun. 2017;8:15776.
31. Seo H, Kim BS, Bae EA, Min BS, Han YD, Shin SJ, et al. IL21 therapy combined with PD-1 and Tim-3 blockade provides enhanced NK cell antitumor activity against MHC class I-deficient tumors. Cancer Immunol Res. 2018;6(6):685–95.
32. Iraolagoitia XL, Spallanzani RG. NK Cells Restrain Spontaneous Antitumor CD8+ T Cell Priming through PD-1/PD-L1 Interactions with Dendritic Cells. J Immun. 2016;197(3):953–61.
33. Liu Y, Cheng Y, Xu Y, Wang Z, Du X, Li C, et al. Increased expression of programmed cell death protein 1 on NK cells inhibits NK-cell-mediated anti-tumor function and indicates poor prognosis in digestive cancers. Oncogene. 2017;36(44):6143–53.
34. Vari F, Arpon D, Keane C, Hertzberg MS, Talaulikar D, Jain S, et al. Immune evasion via PD-1/PD-L1 on NK cells and monocyte/macrophages is more prominent in Hodgkin lymphoma than DLBCL. Blood. 2018;131(16):1809–19.
35. Tumino N, Martini S, Munari E, Scordamaglia F, Besi F, Mariotti FR, et al. Presence of innate lymphoid cells in pleural effusions of primary and metastatic tumors: Functional analysis and expression of PD-1 receptor. Int J Cancer. 2019;145(6):1660–8.
36. Setiady YY, Coccia JA, Park PU. In vivo depletion of CD4+FOXP3+ Treg cells by the PC61 anti-CD25 monoclonal antibody is mediated by FcgammaRIII+ phagocytes. Eur J Immunol. 2010;40(3):780–6.
Publisher’s Note