S H O R T R E P O R T
Open Access
Influence of a home-based exercise
program on the urine pH in elderly female
subjects: a secondary analysis of a
randomized controlled trial
Yuichiro Nishida
1*, Keitaro Tanaka
1, Megumi Hara
1, Noriko Hirao
2, Hiroaki Tanaka
2, Takuro Tobina
3,
Masaharu Ikeda
4, Hiroshi Yamato
5and Masanori Ohta
6Abstract
Background:A low urine pH is a characteristic metabolic feature of metabolic syndrome and type 2 diabetes. The
purpose of the current study was to investigate the effects of a 12-week home-based bench step exercise on the urine pH status of elderly female subjects.
Methods:The current study is a secondary analysis of a randomized controlled trial (RCT) in which 59 postmenopausal
female subjects were randomized to either the exercise group (n= 29) or the control group (n= 30). The subjects in the exercise group were instructed to perform home-based exercises using a bench step at the anaerobic threshold (AT), with a goal of performing≥140 min/week at home for 12 weeks. The subjects in the control group were instructed to not change their normal lifestyle. Urine was collected after overnight fasting, and the urine pH was measured using a urinary test strip. The inter-group-differences at baseline and the pre-post changes within groups were assessed using the Mann-WhitneyUtest and Wilcoxon’s signed-rank test, respectively. Additionally, the difference in the post-intervention urine pH levels of the two groups, adjusted for the pre-post-intervention values (the estimated effect size) and the precision (95% confidence intervals) were investigated using an analysis of covariance.
Results: The pre-post comparison of the urine pH data using Wilcoxon’s signed-rank test showed a significant
increase in the urine pH levels of the exercise group (p< 0.05); there was no significant change in the urine pH levels of the control group. However, the estimated effect size (0.15) was small and the confidence interval straddled 0 (−0.25–0.55).
Conclusions:Based on the results of the current secondary analysis of an RCT, we could not clearly conclude that
exercise has a beneficial effect on the urine pH. Further well-designed RCTs should be conducted to determine whether aerobic exercise is truly able to ameliorate urine acidification.
Trial registration:The study was retrospectively registered in the University Hospital Medical Information Network
(UMIN) as“Effect of step exercise on aerobic fitness and progression of atherosclerosis in the elderly” under the registration number UMIN 000026743 (the date of registration: March 28, 2017).
Keywords: Older females, Uric acidification, Aerobic exercise
* Correspondence:[email protected]
1Department of Preventive Medicine, Faculty of Medicine, Saga University,
Nabeshima 5-1-1, Saga 849-8501, Japan
Full list of author information is available at the end of the article
Background
People with type 2 diabetes and metabolic syndrome have been reported to have acidic urine [1–3]. An increase in the number of metabolic syndrome abnormalities is asso-ciated with an increase in the degree of urine acidification [3]. A lower urine pH is also correlated with a higher body mass index (BMI), triglyceride (TG), serum uric acid, and insulin resistance index values [3, 4]. These studies used a low urine pH as a sign of metabolic acidosis and indicated that acidic urine is a characteristic feature of the common metabolic diseases [1–5]. Furthermore, it has been known for a long time that even in healthy humans, very mild de-gree of chronic metabolic acidosis is sufficient to induce insulin resistance [6, 7].
A low body fluid pH or metabolic acidosis is consid-ered to be a crucial factor in the induction of metabolic disorders, such as insulin resistance and type 2 diabetes [8, 9]. It is generally possible that the acidification of body fluid is unfavorably involved in the mechanisms of metabolic diseases, since a low pH can cause a number of abnormalities in various fundamental cell functions, such as abnormally low enzymatic activity and impaired protein-protein interaction [8]. For instance, a lower extracellular pH levels are associated with lower levels binding between insulin and insulin receptors, a lower level of insulin receptor activation (or phosphorylation), and the decreased activation of other key proteins that are involved in the muscle insulin signaling pathway [8, 10]. It should be noted that, even in healthy subjects, greater body fluid acidity has been associated with an increased risk of developing type 2 diabetes [11]. Thus, maintaining a proper pH status is considered to be crucially important for preventing metabolic diseases [8, 9].
In peripheral metabolic tissues such as skeletal muscle, the main proton sources are lactic acid (lactate–/H+), pyruvic acid (pyruvate–/H+), and beta-hydroxybutyric acid (beta-hydroxybutyrate–/H+) [8, 9]. The pH of body fluids (e.g., blood and urine) is determined by the amount of protons (H+) produced in the metabolic tissues, and the elevated production of the abovementioned organic acids–as sources of protons–is considered to be partly caused by an impaired mitochondrial function [8, 9]. The protons that are dissociated from organic acids are mainly buffered by bicarbonate ions (HCO3-) within cells, but the
protons that are not eliminated are extruded to the cellular fluid which has little buffering capacity, and extra-cellular fluid protons will be transported to the circulating blood, which contains abundant protein buffers (albumin and hemoglobin [Hb]). If these circulating protons cannot be removed by the blood buffers, they will ultimately be excreted from the body via urine and expiration. It is therefore conceivable that urine acidification is originally attributed to the overproduction of organic acids in the peripheral metabolic tissues such as skeletal muscle, which
presumably occurs due to the impairment of the mito-chondrial function [8, 9].
The lower expression of mitochondrial genes in the skeletal muscle has been reported in people with insulin resistance and type 2 diabetes [12], whereas moderate ex-ercise at the anaerobic threshold (AT) intensity has been shown to induce a number of muscle genes that are in-volved in the mitochondrial functions in healthy adults [13]. A moderate home-based step exercise program is re-ported to be a safe, effective, and practical exercise regi-men for improving aerobic fitness in elderly individuals [14]. Additionally, we recently showed that moderate step exercises at the AT in combination with the administra-tion of branched-chain amino acids not only enhances the aerobic capacity but may also improve the glycemic con-trol in elderly patients with liver cirrhosis [15].
In the current study, the main outcome measure was the urine pH. The secondary outcome measures included several metabolic parameters (TG, glucose, insulin resist-ance index, high density lipoprotein cholesterol [HDL-C], and serum uric acid), which have previously been reported to be significantly correlated with the urine pH [4]. The blood urea nitrogen (BUN), as an index of the protein in-take (which can affect the urine pH) [16, 17], and other factors that potentially act as proton buffers in the blood (i.e., total protein and Hb) or which contribute to the ex-cretion of protons from the body via urine (i.e., estimated glomerular filtration rate [eGFR]) were also assessed as secondary outcomes. We hypothesized that aerobic exer-cise at the AT would ameliorate the urine pH levels in elderly women, presumably due to the enhancement of the mitochondrial function in the skeletal muscle.
Materials and Methods The study design and subjects
hypothesized that there would be a 10% change from baseline in the exercise group), and the subject number per group was 29, the power calculated was 90%. To in-vestigate the effects of exercise intervention independently of the influence of dietary factors, all of the subjects in the two groups were instructed to not change (and to simply maintain) their normal lifestyle and to continue their usual dietary habits; the participants in exercise group regularly performed step exercises in their home throughout the 12-week study period. The RCT was retrospect-ively registered in the University Hospital Medical In-formation Network (UMIN) as “Effect of step exercise on aerobic fitness and progression of atherosclerosis in the elderly” under the registration number UMIN 000026743.
Exercise testing using a bench step
Submaximal graded incremental exercise tests were con-ducted using a bench step (height: 15 cm or 20 cm) to as-sess the AT (which is considered to be a superior index of the aerobic capacity and the intensity of exercise training in home-based training programs), as previously described [19]. The step rhythm was initially set at 40 steps/min, and was increased by 10 steps/min every 4 min, separated by 2-min rest intervals. The heart rate (Polar T31-coded transmitter, Polar Electro, Oy, Kempele, Finland) and the rating of perceived exertion were recorded during the last minute of exercise at each step rhythm. Blood samples (5 μL) were obtained from the earlobe immediately after exercise at each step rhythm, and the blood lactate con-centration was measured using a portable blood lactate test meter (Lactate pro, Arkray, Inc., Kyoto, Japan). Oxy-gen consumption during the bench step exercises was estimated based on the height of the bench step and the step rhythm [19]. Metabolic equivalents (METs) were cal-culated by comparing the oxygen consumption at rest (3.5 mL/kg/min). The estimated oxygen consumption or METs at the first breakpoint of the blood lactate concen-tration was judged as the lactate threshold; this exercise intensity defines the AT [20]. The AT data were consid-ered to be missing when the lactate threshold was not assessed due to an insufficient blood sample. The number of subjects in whom the AT was analyzed is shown in the footnotes of the table.
The home-based bench step exercise training
The exercise regimen was a moderate intensity, home-based aerobic training using a bench step. The partici-pants in the bench step exercise program were instructed to perform the bench step exercises at the AT three times per day (10–20 min per session), with a goal of performing ≥140 min of exercise in their home per week for the 12-week period. In order to adjust the workload, an add-itional step exercise test was performed at six weeks after
the commencement of training, and the revised workload, which corresponded to the newly determined AT was used for the remaining 6 weeks. Exercise sessions were conducted once a week at a community welfare center by an exercise leader in order to maintain the subjects’ mo-tivation. Based on the self-recorded exercise logs that were submitted by a subset of the subjects in the exercise group (n= 13), the average length of time spent performing bench step exercises at home was 208 ± 62 min/week over the 12-week period. The participants assigned to the con-trol group were instructed to simply maintain their nor-mal lifestyle and usual dietary habits for the duration of the study.
The anthropometric indices, blood pressure, and urine and blood sampling, and laboratory assay
HbA1c value was estimated as the National Glycohemo-globin Standardization Program (NGSP) equivalent value, which was calculated as HbA1c (NGSP [%]) = 1.02 × HbA1c (Japan Diabetes Society value [%]) + 0.25% [25].
Statistical analysis
The main outcome measure was the urine pH. The sec-ondary outcome measures were metabolic parameters (TG, glucose, HOMA-IR, HDL-C, and serum uric acid), which have previously been reported to be significantly correlated with the urine pH [4]. The BUN as an index of the influence of the protein intake on the urine pH levels and other factors that potentially act as proton buffers in the blood (i.e., total protein, Hb) or which contribute to the excretion of protons from the body via urine (i.e., eGFR), were also assessed as secondary out-comes. As noted above, a per protocol analysis was performed. The values are shown as the mean ± SE. Intra-group comparisons of the data obtained before (baseline) and after the 12-week intervention were per-formed using Wilcoxon’s signed-rank test. Comparisons of the inter-group differences (between the exercise and control groups) in the baseline data were made using the Mann-Whitney Utest. To identify the clinical variables that potentially explain the exercise-induced changes in the urine pH, the significance of correlations between the changes in the significantly changed variables and the change in the urine pH was assessed in the exercise group according to the Spearman’s rank correlation coeffi-cient. As for the primary outcome of the urine pH, the post-intervention values adjusted for the pre-intervention
values of each group, as well as the difference between the adjusted post-intervention values of the two groups (i.e., the estimated effect size) plus its precision (i.e., 95% confidence intervals) were analyzed using an analysis of covariance. All of the statistical analyses were performed using the SAS software program (version 9.3 for Win-dows, SAS Institute, Cary, NC, USA). Apvalue of <0.05 was considered to indicate statistical significance.
Results
The effects of the bench step exercise on the anthropometric indices, aerobic capacity, blood biochemical parameters, and urine creatinine levels
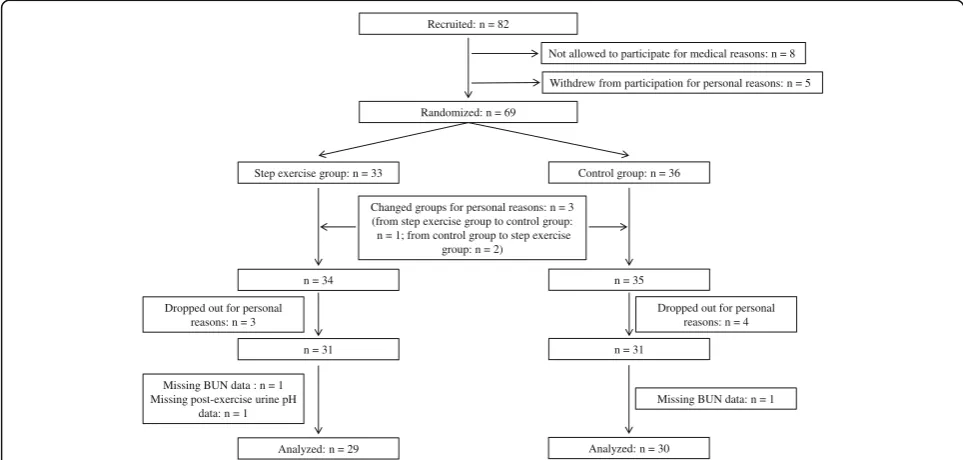
Figure 1 shows a participant flow diagram. After the 69 participants were randomly assigned to the step exercise or control groups, one participant who was originally assigned to the exercise group changed to the control group while two participants who were originally assigned to the control group changed to the exercise group based on the subjects’preference. Among the 69 remaining par-ticipants (exercise group, n= 34; control group, n= 35) seven participants (exercise group,n= 3; control group,n = 4) dropped out for personal reasons. Two more partici-pants with missing BUN data (exercise group,n= 1; con-trol group, n= 1) and one participant from the exercise group whose post-exercise urine pH data were missing were excluded from the analysis. Consequently, 59 sub-jects (exercise group, n= 29; control group, n= 30) were included in the per protocol analysis. In the exercise group, the baseline body weight and BMI were higher, while the serum uric acid level and eGFR were lower in
Recruited: n = 82
Not allowed to participate for medical reasons: n = 8
Withdrew from participation for personal reasons: n = 5
Randomized: n = 69
Step exercise group: n = 33 Control group: n = 36
Changed groups for personal reasons: n = 3 (from step exercise group to control group: n = 1; from control group to step exercise
group: n = 2)
n = 34 n = 35
Dropped out for personal reasons: n = 3
Dropped out for personal reasons: n = 4
n = 31 n = 31
Missing BUN data : n = 1 Missing post-exercise urine pH
data: n = 1
Analyzed: n = 29
Missing BUN data: n = 1
Analyzed: n = 30
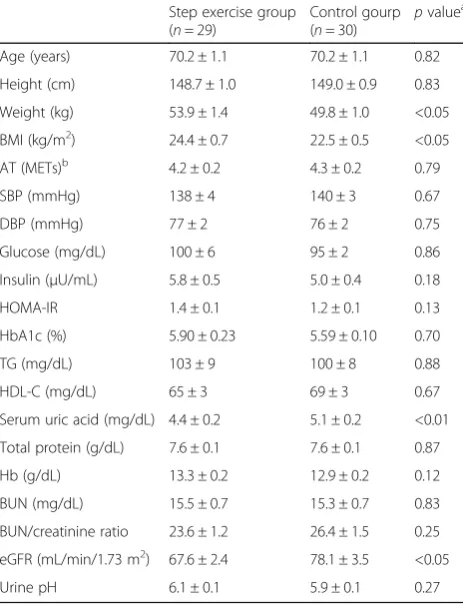
comparison to the control group (Table 1). The baseline urine pH levels of the two groups were similar. In the exercise group, the BMI decreased, and aerobic capacity increased (as indicated by AT) with the exercise program, as previously reported [14]. The serum uric acid showed statistically significant improvement after the exercise pro-gram; the changes in these variables (BMI, AT, serum uric acid) were not observed in the control group. The other metabolic parameters (glucose, HOMA-IR, TG, HDL-C) were not significantly affected by the exercise. As for the indices related to the blood buffering capacity and the urine production function of the kidney, there were no changes in two buffers in circulation (total protein and Hb) or the index of kidney function (eGFR values) in either the exercise or control groups. The BUN value and the BUN/creatinine ratio, as indices of the dietary protein intake, were also not changed after the 12-week study in either of the groups. Additionally, the urine creatinine levels, as an index of the degree of urine concentration,
was unchanged during the study period in both groups (exercise group: before 103 ± 9, after 110 ± 10 mg/dL,p = 0.34; control group: before 110 ± 13, after 99 ± 12 mg/ dL,p= 0.46).
The effects of the moderate step exercise on the urine pH levels
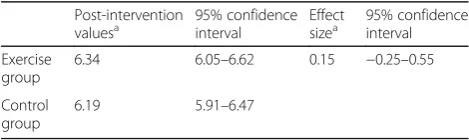
The intra-group comparison analysis using Wilcoxon’s signed-rank test showed that the urine pH levels were significantly increased in the exercise group (pre-inter-vention 6.10 ± 0.13, post-inter(pre-inter-vention 6.41 ± 0.18, p< 0.05), whereas the urine pH of the control group did not change to a statistically significant extent (pre-interven-tion 5.88 ± 0.12, post-interven(pre-interven-tion 6.12 ± 0.14, p= 0.15) (Fig. 2). The post-intervention values adjusted for the pre-intervention values (in each group), and the differ-ence between the adjusted post-intervention values of the two groups (i.e., the estimated effect size) plus its precision (i.e., 95% confidence intervals) are shown in Table 2. The estimated effect size (0.15) was small and its 95% confidence interval straddled 0. Similarly, the ad-justed mean urine pH change (before and after the inter-vention) in the exercise (0.35 [95% confidence interval 0.06−0.63]) and control (0.20 [-0.08−0.48]) groups did not differ to a statistically significant extent (p= 0.46).
We did not observe any significant correlation between the change in the urine pH after the exercise and the changes in BMI (ρ= 0.26,p= 0.17) and the serum uric acid level (ρ=−0.12, p= 0.53). Another factor that showed sig-nificant changes after the exercise program was the AT; however, the change in this index of aerobic capacity was not significantly correlated with the change in the urine pH after the exercise program (ρ=−0.28,p= 0.14).
Discussion
To our knowledge, the current study is the first to inves-tigate whether or not aerobic exercise improves the urine pH in humans. Despite the crucial importance of metabolic acidosis in the development of insulin resist-ance and other chronic diseases [6, 8, 9], there is only one report on an effective approach to improve meta-bolic acidification, in which a diet containing propolis (a natural compound derived from honeybee product) was found to elevate the pH of interstitial fluids and simultaneously enhance insulin sensitivity in a rodent model of type 2 diabetes mellitus [26].
In the present study, the pre-post comparison of the urine pH data using Wilcoxon’s signed-rank test showed a significant increase in the urine pH levels of the exer-cise group, while there was no significant change in the urine pH levels of the control group. However, when the degree of the effect of exercise was assessed based on the estimated effect size and its precision (95% confi-dence interval), the effect size was small (0.15) and the
Table 1The characteristics of the study subjects at baseline
Step exercise group (n= 29)
Control gourp (n= 30) p
valuea
Age (years) 70.2 ± 1.1 70.2 ± 1.1 0.82
Height (cm) 148.7 ± 1.0 149.0 ± 0.9 0.83
Weight (kg) 53.9 ± 1.4 49.8 ± 1.0 <0.05
BMI (kg/m2) 24.4 ± 0.7 22.5 ± 0.5 <0.05
AT (METs)b 4.2 ± 0.2 4.3 ± 0.2 0.79
SBP (mmHg) 138 ± 4 140 ± 3 0.67
DBP (mmHg) 77 ± 2 76 ± 2 0.75
Glucose (mg/dL) 100 ± 6 95 ± 2 0.86
Insulin (μU/mL) 5.8 ± 0.5 5.0 ± 0.4 0.18
HOMA-IR 1.4 ± 0.1 1.2 ± 0.1 0.13
HbA1c (%) 5.90 ± 0.23 5.59 ± 0.10 0.70
TG (mg/dL) 103 ± 9 100 ± 8 0.88
HDL-C (mg/dL) 65 ± 3 69 ± 3 0.67
Serum uric acid (mg/dL) 4.4 ± 0.2 5.1 ± 0.2 <0.01
Total protein (g/dL) 7.6 ± 0.1 7.6 ± 0.1 0.87
Hb (g/dL) 13.3 ± 0.2 12.9 ± 0.2 0.12
BUN (mg/dL) 15.5 ± 0.7 15.3 ± 0.7 0.83
BUN/creatinine ratio 23.6 ± 1.2 26.4 ± 1.5 0.25
eGFR (mL/min/1.73 m2) 67.6 ± 2.4 78.1 ± 3.5 <0.05
Urine pH 6.1 ± 0.1 5.9 ± 0.1 0.27
Values are the mean ± SE
ATanaerobic threshold,BMIbody mass index,BUNblood urea nitrogen,DBP
diastolic blood pressure,eGFRestimated glemerular filtration rate,Hb
hemoglobin,HbA1chemoglobin A1c,HDL-Chigh density lipoprotein cholesterol,HOMA-IRhomeostasis model assessment of insulin resistance,
LDL-Clow density lipoprotein cholesterol,METmetabolic equivalent,
SBPsystolic blood pressure,TGtriglyceride a
Thepvalue for the inter-group comparison of baseline data between the exercise group and the control group
b
confidence interval straddled 0. Thus, the magnitude of the effect of exercise training on the urine pH could not be considered significant. This negative result is attrib-uted to both the small degree of increase in the average urine pH in the exercise group (5.1%) and the unex-pected nonsignificant increase in the urine pH of the control group (4.1%; Wilcoxon’s signed-rank test, p= 0.15). We were not able to clearly explain why the urine pH levels of the control group tended to increase.
Previous reports showing that either a higher BMI value or an increase in the uric acid level was linked with more acidic urine [2, 3, 27]. The participants in our exercise group showed significant changes in these two parameters and AT after the exercise program. However, we did not observe any significant association between the change in the urine pH after the exercise and the changes in BMI, serum uric acid level, or AT. Addition-ally, the indices of the blood buffers (total protein and Hb) as well as the index of kidney function (eGFR) were not altered by the exercise. Thus, in the current study, we were unable to identify the clinical factors that might contribute to the elevation of the urine pH level after the exercise. Further studies will be needed to identify
the factors that determine the exercise-induced amelior-ation of the urine pH level.
In the recent reviews on the body pH status and meta-bolic diseases [8, 9], the acidification of body fluids (especially interstitial fluid in skeletal muscle) is consid-ered to be one of the important mechanisms underlying insulin resistance and type 2 diabetes. Thus, we hypothe-sized that the acidification of the body fluids, including urine, is a cause (rather than a result) of insulin resistance and that the amelioration of the urine pH status with exer-cise may precede the exerexer-cise-induced improvement in in-sulin resistance. The 12-week duration of exercise training at the AT was sufficient for enhancing insulin sensitiv-ity in younger subjects (24.8 ± 1.8 years of age) [28]; however, the duration (12 weeks) of the current pro-gram might have been too short to achieve the amelior-ation of the urine pH and insulin sensitizamelior-ation in the elderly subjects.
The current study is associated with several limita-tions. The usage of 24-h accumulated urine is ideal for precisely assessing the whole-day pH status; however, in the current study the urine sample was only collected once in the morning, as it is a highly practical method of reliably assessing the metabolic acidosis status [4]. Since the present subjects were not provided with the same fixed diet during the study period, we cannot totally exclude the possibility that their diet (in particular, protein-rich food which can induce urine acidification) might have influenced the urine pH status; however, we asked each subject not to change and to simply maintain their usual dietary habits throughout the study period and we confirmed that the BUN concentration levels (as an index of protein intake) were not altered during the current study.
Fig. 2The changes in the urine pH after the 12-week study in the exercise group and the control group. The columns represent the mean ± SE. The intra-group comparisons were made using Wilcoxon’s signed-rank test
Table 2The adjusted post-intervention values, estimated effect
size, and precision regarding the effect of step exercise training on the urine pH
Post-intervention
valuesa 95% confidenceinterval Effectsizea 95% confidenceinterval
Exercise group
6.34 6.05–6.62 0.15 −0.25–0.55
Control group
6.19 5.91–6.47
a
Conclusion
The current study was a secondary analysis of an RCT that was performed to investigate the effect of aerobic exercise on the urine pH levels in older women. Although the pre-post comparison analysis using Wilcoxon’s signed-rank test showed that the urine pH levels were only significantly in-creased in the exercise group, the degree of the effect was considered to be insignificant based on the estimated effect size and its precision. Thus, we could not clearly conclude that aerobic exercise training has a beneficial effect on the urine pH. Further well-designed RCTs should be con-ducted to determine whether aerobic exercise is truly able to ameliorate urine acidification.
Acknowledgements Not applicable.
Funding
This work was partially supported by grants from the Japanese Ministry of Education, Culture, Sports, Science and Technology (Nos. 17700537, 19200049 and Strategic Research Infrastructure) and the Global FU Program funded by Fukuoka University. The funding sources had no role in any aspect of the current work.
Availability of data and materials
The datasets generated during and/or analyzed during the current study are available from the corresponding author on reasonable request.
Authors’contributions
YN, HT, MI, HY, and MO conceived of the study, and participated in the conception and design of the study. NH and TT performed the experiments and collected data. YN, MH, and KT performed the statistical analysis. YN drafted the manuscript. All authors critically revised the manuscript. All authors read and approved the final manuscript.
Competing interests
The authors declare that they have no competing interest.
Consent for publication Not applicable.
Ethics approval and consent to participate
The current study was approved by the ethics committee of the University of Occupational and Environmental Health, Japan. Written informed consent was obtained from all participants.
Publisher’s Note
Springer Nature remains neutral with regard to jurisdictional claims in published maps and institutional affiliations.
Author details 1
Department of Preventive Medicine, Faculty of Medicine, Saga University, Nabeshima 5-1-1, Saga 849-8501, Japan.2Laboratory of Exercise Physiology, Faculty of Sports and Health Science, Fukuoka University, Fukuoka, Japan. 3Faculty of Nursing and Nutrition, University of Nagasaki, Nagasaki, Japan. 4
Fukuseikai Minami Hospital, Fukuoka, Japan.5Department of Health Development, Institute of Industrial Ecological Science, University of Occupational and Environmental Health, Kitakyushu, Japan.6Department of Food and Health Sciences, International College of Arts and Sciences, Fukuoka Women’s University, Fukuoka, Japan.
Received: 11 July 2016 Accepted: 8 May 2017
References
1. Maalouf NM, Cameron MA, Moe OW, Sakhaee K. Metabolic basis for low urine pH in type 2 diabetes. Clin J Am Soc Nephrol. 2010;5:1277–81.
2. Cameron MA, Maalouf NM, Adams-Huet B, Moe OW, Sakhaee K. Urine composition in type 2 diabetes: predisposition to uric acid nephrolithiasis. J Am Soc Nephrol. 2006;17:1422–8.
3. Maalouf NM, Cameron MA, Moe OW, Adams-Huet B, Sakhaee K. Low urine pH: a novel feature of the metabolic syndrome. Clin J Am Soc Nephrol. 2007;2:883–8.
4. Otsuki M, Kitamura T, Goya K, Saito H, Mukai M, Kasayama S, Shimomura I, Koga M. Association of urine acidification with visceral obesity and the metabolic syndrome. Endocr J. 2011;58:363–7.
5. Daudon M, Traxer O, Conort P, Lacour B, Jungers P. Type 2 diabetes increases the risk for uric acid stones. J Am Soc Nephrol. 2006;17:2026–33. 6. Souto G, Donapetry C, Calvino J, Adeva MM. Metabolic acidosis-induced
insulin resistance and cardiovascular risk. Metab Syndr Relat Disord. 2011;9: 247–53.
7. DeFronzo RA, Beckles AD. Glucose intolerance following chronic metabolic acidosis in man. Am J Physiol. 1979;236:E328–34.
8. Marunaka Y. Roles of interstitial fluid pH in diabetes mellitus: Glycolysis and mitochondrial function. World J Diabetes. 2015;6:125–35.
9. Aoi W, Marunaka Y. Importance of pH homeostasis in metabolic health and diseases: crucial role of membrane proton transport. Biomed Res Int. 2014; 2014:598986.
10. Hayata H, Miyazaki H, Niisato N, Yokoyama N, Marunaka Y. Lowered extracellular pH is involved in the pathogenesis of skeletal muscle insulin resistance. Biochem Biophys Res Commun. 2014;445:170–4.
11. Ohlson LO, Larsson B, Bjorntorp P, Eriksson H, Svardsudd K, Welin L, Tibblin G, Wilhelmsen L. Risk factors for type 2 (non-insulin-dependent) diabetes mellitus. Thirteen and one-half years of follow-up of the participants in a study of Swedish men born in 1913. Diabetologia. 1988;31:798–805. 12. Patti ME, Butte AJ, Crunkhorn S, Cusi K, Berria R, Kashyap S, Miyazaki Y,
Kohane I, Costello M, Saccone R, Landaker EJ, Goldfine AB, Mun E, DeFronzo R, Finlayson J, Kahn CR, Mandarino LJ. Coordinated reduction of genes of oxidative metabolism in humans with insulin resistance and diabetes: Potential role of PGC1 and NRF1. Proc Natl Acad Sci U S A. 2003;100:8466–71. 13. Nishida Y, Tanaka H, Tobina T, Murakami K, Shono N, Shindo M, Ogawa W,
Yoshioka M, St-Amand J. Regulation of muscle genes by moderate exercise. Int J Sports Med. 2010;31:656–70.
14. Nishida Y, Tanaka K, Hara M, Hirao N, Tanaka H, Tobina T, Ikeda M, Yamato H, Ohta M. Effects of home-based bench step exercise on inflammatory cytokines and lipid profiles in elderly Japanese females: a randomized controlled trial. Arch Gerontol Geriatr. 2015;61:443–51.
15. Nishida Y, Ide Y, Okada M, Otsuka T, Eguchi Y, Ozaki I, Tanaka K, Mizuta T. Effects of home-based exercise and branched-chain amino acid supplementation on aerobic capacity and glycemic control in patients with cirrhosis. Hepatol Res. 2017;47:E193–200.
16. Remer T, Manz F. Potential renal acid load of foods and its influence on urine pH. J Am Diet Assoc. 1995;95:791–7.
17. Remer T. Influence of diet on acid-base balance. Semin Dial. 2000;13:221–6. 18. Ohta M, Hirao N, Mori Y, Doi Y, Takigami C, Eguchi M, Tanaka H, Ikeda M,
Yamato H. Effects of step exercise on leptin resistance and oxidative stress in elderly females (in Japanese). Jpn J Cardiovasc Dis Prev. 2008;43:55–62. 19. Ayabe M, Yahiro T, Mori Y, Takayama K, Tobina T, Higuchi H, Ishii K, Sakuma
I, Yoshitake Y, Miyazaki H, Kiyonaga A, Shindo M, Tanaka H. Simple assessment of lactate threshold by means of the bench stepping in older population. Int J Sport Health Sci. 2003;1:207–15.
20. Wasserman K, Whipp BJ, Koyl SN, Beaver WL. Anaerobic threshold and respiratory gas exchange during exercise. J Appl Physiol. 1973;35:236–43. 21. Morishita Y, Nakane K, Fukatsu T, Nakashima N, Tsuji K, Soya Y, Yoneda K,
Asano S, Kawamura Y. Kinetic assay of serum and urine for urea with use of urease and leucine dehydrogenase. Clin Chem. 1997;43:1932–6.
22. Horio M, Orita Y. Comparison of Jaffe rate assay and enzymatic method for the measurement of creatinine clearance. Nihon Jinzo Gakkai Shi. 1996;38: 296–9.
23. Ou M, Song Y, Li S, Liu G, Jia J, Zhang M, Zhang H, Yu C. LC-MS/MS Method for Serum Creatinine: Comparison with Enzymatic Method and Jaffe Method. PLoS One. 2015;10:e0133912.
24. Matthews DR, Hosker JP, Rudenski AS, Naylor BA, Treacher DF, Turner RC. Homeostasis model assessment: insulin resistance and beta-cell function from fasting plasma glucose and insulin concentrations in man. Diabetologia. 1985;28:412–9.
Sasahara T, Nishio Y, Kuwa K, Ueki K, Takei I, Umemoto M, Murakami M, Yamakado M, Yatomi Y, Ohashi H, Committee on the Standardization of Diabetes Mellitus-Related Laboratory Testing of Japan Diabetes S. International clinical harmonization of glycated hemoglobin in Japan: From Japan Diabetes Society to National Glycohemoglobin Standardization Program values. J Diabetes Investig. 2012;3:39–40.
26. Aoi W, Hosogi S, Niisato N, Yokoyama N, Hayata H, Miyazaki H, Kusuzaki K, Fukuda T, Fukui M, Nakamura N, Marunaka Y. Improvement of insulin resistance, blood pressure and interstitial pH in early developmental stage of insulin resistance in OLETF rats by intake of propolis extracts. Biochem Biophys Res Commun. 2013;432:650–3.
27. Taylor EN, Curhan GC. Body size and 24-h urine composition. Am J Kidney Dis. 2006;48:905–15.
28. Nishida Y, Tokuyama K, Nagasaka S, Higaki Y, Shirai Y, Kiyonaga A, Shindo M, Kusaka I, Nakamura T, Ishibashi S, Tanaka H. Effect of moderate exercise training on peripheral glucose effectiveness, insulin sensitivity, and endogenous glucose production in healthy humans estimated by a two-compartment-labeled minimal model. Diabetes. 2004;53:315–20.
• We accept pre-submission inquiries
• Our selector tool helps you to find the most relevant journal • We provide round the clock customer support
• Convenient online submission • Thorough peer review
• Inclusion in PubMed and all major indexing services • Maximum visibility for your research
Submit your manuscript at www.biomedcentral.com/submit