ORIGINAL PAPER
Evaluation of Water Quality Using Heavy Metal Index and Multivariate
Statistical Analysis in Lorestan Province, Iran
Zahra Khoshnam1, Ramin Sarikhani2, Artimes Ghassemi Dehnavi3, Zeinab Ahmadnejad4
1. M.Sc. Student, Department of Geology, Faculty of Science, Lorestan University 2. Department of Geology, Lorestan University, Khorramabad
3. Department of Geology, Lorestan University, Khorramabad 4. Department of Geology, Tabriz University, Tabriz
Date of submission: 13 Dec 2016, Date of acceptance: 28 Feb 2017
ABSTRACT
In the present study, the water quality of Silakhor River, located in Rahim Abad hydrometric station, was analyzed based on Boron, Iron, Nickel, Fluorine, Manganese, Chromium, Cadmium, Aluminum, Copper, Zinc and Lead pollution. The samples were collected from Silakhor River in Rahim Abad hydrometric station during a one-year period, from December 2012 to November 2013. In addition, metal index (MI) and heavy metal evaluation index (HEI) were applied to evaluate the amount of heavy metal pollution of water resources in the study area. The aforemention indices determined the origin of contamination of water resources, drinking or non-drinking. The findings from the samples showed that the amount of some heavy metals, such as Lead, Chromium, Cadmium and Manganese was higher than permissible limit of WHO standard. However, metal index (MI) and heavy metal evaluation index (HEI) proved that all samples are non-potable. In the present study, statistical studies (correlation coefficient, factor analysis and cluster analysis) were employed to determine the probable origin of the area’s elements. The findings indicated a multiple source of pollutants for the region water resources including two major sources; one is associated with the region lithology (the natural factor) while the other is caused by human activity in the region (anthropogenic factors).
Keywords: Silakhor, metal index, heavy metal evaluation index
Introduction
River systems are considered as the main inland water resources for domestic, industrial and irrigation purposes. In addition, they play a major role in transporting industrial and municipal wastewater runoff from agricultural fields, roadways and streets, leading to river
pollution.1 Chemical pollution of surface water
may pose a significant threat to aquatic environment causing acute and chronic toxicity to aquatic organisms, accumulation in the ecosystem, losses of habitats and biodiversity,
and a potential threat to human health. 2,3 Heavy
metals are considered as the most common environmental pollutants whose occurrence in water and biota prove the presence of natural or
Ramin Sarikhani [email protected]
Citation: Khoshnam Z, Sarikhani R, Ghassemi Dehnavi A, Ahmadnejad Z. Evaluation of Water Quality Using Heavy Metal
anthropogenic sources. In fact, the major natural sources of metal in water are chemical weathering of minerals and soil leaching. The anthropogenic sources are mainly associated with industrial and domestic effluents, urban storm, water runoff, landfill leachate, mining of coal and ore, atmospheric sources and inputs
rural areas.4 Moreover, the main anthropogenic
sources of heavy metal contamination are mining, disposal of untreated and partial treated effluents containing toxic metals, metal chelates from different industries and indiscriminate use of heavy metals containing fertilizer and
pesticides in agricultural fields.5 A number of
researchers have studied various aspects of
water quality.6,16 The present study aims at not
only comparing the element concentration of B
-, Fe2+, Ni2+, F-, Mn2+, Cr3+, Ca2+, Al3+, Cu2+,
Zn2+ and Pb2+ to World Health Organization
statistical analysis implicated human activities as the main origin of the elements.
Geographical and geological features of the area
The study setting is geologically located between thrust or crushed Zagros and Sanandaj – Sirjan zone, from the north of Boroujerd to the south of Dorud city. Silakhor River is a part of Boroujerd-Lorestan in the northernmost part of Karun River Basin. Flat area of this region
covers 162.36 km2 with the altitude of529.06
km2. It is always a permanent watercourse of the
region due to the arrival of surface flow, sufficient rainfall and snowy mountains. In addition, the area has a cold climate with
appropriate precipitation. Considering
limestone mountains, adequate precipitation and appropriate alluvial, the region has significant groundwater and permanent rivers like Karun
river branches.18 Figure 1 presents the study area
and geological map of Rahim Abad hydrometric station.
Fig. 1 The geological map of Rahim Abad hydrometric
station (After Geological Survey and Mineral Exploration, 2000)
Table 1 Heavy metal concentration of the Silakhor River samples (mg/l)
Sample B- Fe2+ Ni2+ F- Mn2+ Cr3+ Cd2+ Al3+ Cu2+ Zn2+ Pb2+
Dec-2012 0.05 0.05 0.02 0.49 0.02 0.03 0.01 0.01 0.01 0.03 0.003
Jan-2013 0.11 0.09 0.05 0.51 0.05 0.05 0.03 0.02 0.03 0.07 0.004
Feb-2013 0.11 0.09 0.045 0.55 0.06 0.055 0.03 0.02 0.045 0.06 0.005
Mar-2013 0.08 0.075 0.03 0.35 0.06 0.055 0.021 0.01 0.05 0.055 0.008
Apr-2013 0.06 0.07 0.03 0.39 0.053 0.04 0.019 0.01 0.052 0.0375 0.01
May-2013 0.05 0.06 0.03 0.42 0.025 0.038 0.02 0.01 0.037 0.025 0.009
Jun-2013 0.05 0.045 0.03 0.37 0.01 0.02 0.01 0.03 0.015 0.035 0.01
Jul-2013 0.05 0.055 0.03 0.42 0.01 0.03 0.01 0.03 0.035 0.035 0.01
Aug-2013 Dry Dry Dry Dry Dry Dry Dry Dry Dry Dry Dry
Sep-2013 0.04 0.02 0.01 0.45 0.01 0.02 0.005 0.02 0.01 0.02 0.009
Oct-2013 0.05 0.028 0.01 0.51 0.013 0.034 0.007 0.02 0.018 0.024 0.01
Nov-2013 0.04 0.033 0.01 0.46 0.02 0.04 0.006 0.03 0.022 0.033 0.033
WHO 2011 2.4 0.1 0.07 1.5 0.05 0.05 0.003 0.1 2 3 0.01
Outside of the WHO 2011 standard range Inside of the WHO 2011 standard range
Heavy Metal in the Study Area
The water samples were collected from Silakhor River during a one-year period from December 2012 to November 2013. They were analyzed in terms of Boron, Iron, Nickel, Fluorine, Manganese, Chromium, Cadmium, Aluminum, Copper, Zinc and Lead pollution. The findings showed that the values of Cadmium, Lead, Manganese and Chromium were higher than the
WHO (2011) standard. Besides, Global Positioning System (GPS) was applied to determine not only the precise location of sampling but also the exact latitude, longitude and altitude. With regard to heavy metals, the WHO (2011) standard was used to determine
the water quality of the area.17 The analysis of
metal of the samples were within the range of WHO (2011) standard limit in Silakhor River. As shown in the table below, the amount of Manganese is higher than the standard permissible value in February 2013, March 2013 and April 2013; while Cadmium was high during the whole sampling period. Moreover, Lead was high in November 2013, and chromium in February and March 2013.
Materials and Methods
Quantity Evaluation of Heavy Metal Pollution in Water Resources
In evaluating heavy metal pollution of water resources in the study area, Metal Index (MI) and Heavy Metal Index (HMI) were used to determine the potability of drinking water and the effects of heavy metals on human health, respectively (potable or non-potable for drinking). All samples were collected in 250 ml polyethylene bottles which were acidified with
HNO3 to prevent the precipitation of metal.
They were all transferred to the laboratory in iceboxes and refrigerated at 4°C. Inductively coupled plasma mass spectrometry (ICP-MS) was employed to analyze the samples. Moreover, it can recognize both the degree of water contamination and potability of drinking water. The findings revealed that human activities and erosion of lithological formation are the dominant origins of heavy metals. (HEI) Heavy Metal Evaluation Index
The HEI gives an overall quality of the water regarding heavy metal content. The HEI is computed as follows:
𝐻𝐸𝐼 = ∑ 𝐻𝑐
𝐻𝑚𝑎𝑐 𝑁
𝑖=1
Where, Hc indicates monitored value of the ith parameter and Hmac indicates maximum
admissible concentration of the Ith parameter.19
As shown in Table 2, water quality is classified based on HEI whose values are presented in Figure 2 for Silakhor River. As shown, the HEI value of all samples are high, therefore they are polluted.
Table 2 Classification of Silakhor River water quality
based on modified categories for HEI
Description Class
Index
Low <1.24
Metal Index
General metal index (MI) is the other index used
for assessing the quality of drinking water 20
which takes into consideration, the possible
Fig. 2 Heavy metal evaluation index of Silakhor River at
various sampling times
additive effects of heavy metals on human health leading to quick evaluation of overall quality of drinking water. Metal pollution index is given by the expression proposed by Caeiro et.al.21
𝑀𝐼 = ∑ 𝐶𝑖
(𝑀𝐴𝐶)𝑖
𝑁
𝑖=1
Where MAC indicates maximum allowable concentration and Ci is the mean concentration of each metal. MI value > 1 is a warning
threshold.20 Water quality and its suitability for
drinking purpose can be examined by
determining its metal pollution index. 22, 23
Given that metalloid and fluorine are not considered as metal, they were ignored in
Fig.3 Metal Index (MI) of studied samples of Silakhor
River at various sampling times
Table 3 Water quality classification using MI 21
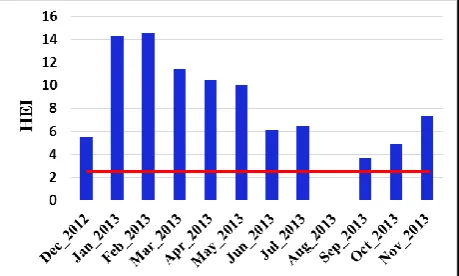
Besides, index values are presented in Table 4 for Silakhor River. The histogram of Silakhor River is shown in Figure 3, where the red line indicates the standard level of the MI. As shown in Table 4 and Figure 3, the MI value of the samples is often in seriously affected range while some samples are in moderately affected and strongly affected range, thus they are polluted accordingly.
Table 4 Metal Index (MI) of studied samples of Silakhor River at various sampling times
Sample DeC
2012 Jan
2013 Feb
2013
Mar
2013
Apr
2013
May
2013
Jun
2013 Jul
2013
Aug
2013 Sep
2013 Oct
2013
Nov
2013
MI 5.53 14.25 14.59 11.42 10.46 9.98 6.13 6.44 Dry 3.72 4.91 7.29
Class V VI VI VI VI VI VI VI - IV V VI
Results and Discussion The correlation coefficient
The correlations among heavy metals
demonstrate some facts regarding the origin and migration of these elements. For instance, high correlation between two heavy metals probably indicates that these elements share either similar pollution sources or analogous transformation
and migration processes in certain
circumstances.24 In addition, Pearson’s
correlation coefficient is considered as the most
common correlation coefficient. The correlation coefficients can range from -1 to +1 which is
independent from units of measurement.25 The
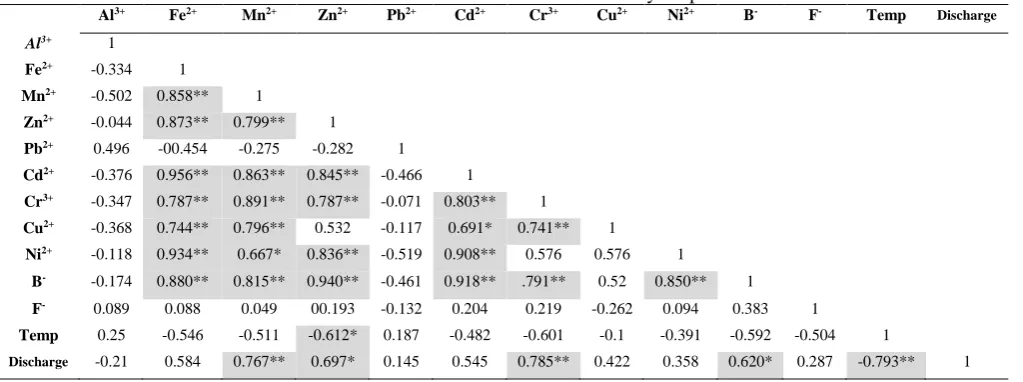
findings from Pearson correlation analysis are presented in Table 5 showing that there is a significant positive relationship among Iron,
Manganese, Zinc, Cadmium, Chromium,
Copper, Nickel, Boron and Discharge. In addition, they prove the probable pollution of common resources (agricultural waste water, rural sewages or sewages of Boroujerd city).
Table 5 Pearson correlation matrix between the analyzed parameters
Al3+ Fe2+ Mn2+ Zn2+ Pb2+ Cd2+ Cr3+ Cu2+ Ni2+ B- F- Temp Discharge
Al3+ 1
Fe2+ -0.334 1
Mn2+ -0.502 0.858** 1
Zn2+ -0.044 0.873** 0.799** 1
Pb2+ 0.496 -00.454 -0.275 -0.282 1
Cd2+ -0.376 0.956** 0.863** 0.845** -0.466 1
Cr3+ -0.347 0.787** 0.891** 0.787** -0.071 0.803** 1
Cu2+ -0.368 0.744** 0.796** 0.532 -0.117 0.691* 0.741** 1
Ni2+ -0.118 0.934** 0.667* 0.836** -0.519 0.908** 0.576 0.576 1
B- -0.174 0.880** 0.815** 0.940** -0.461 0.918** .791** 0.52 0.850** 1
F- 0.089 0.088 0.049 00.193 -0.132 0.204 0.219 -0.262 0.094 0.383 1
Temp 0.25 -0.546 -0.511 -0.612* 0.187 -0.482 -0.601 -0.1 -0.391 -0.592 -0.504 1
Discharge -0.21 0.584 0.767** 0.697* 0.145 0.545 0.785** 0.422 0.358 0.620* 0.287 -0.793** 1 **Correlation is significant at the 0.01 level (2-tailed).
*Correlation is significant at the 0.05 level (2-tailed).
Principal Components Analysis (PCA) PCA, as a multivariate analytical tool, is used to reduce a set of original variables to extract a
small number of latent factors.26 Principal
component analysis (PCA) was used to find
potential pollution sources.27 The analysis of the
main element to determine the possible sources of river contamination leads to the extraction of
MI Characteristics Class
<0.3 Very pure I
0.3-1.0 Pure II
1.0-2.0 Slightly affected III
2.0-4.0 Moderately affected IV
4.0-6.0 Strongly affected V
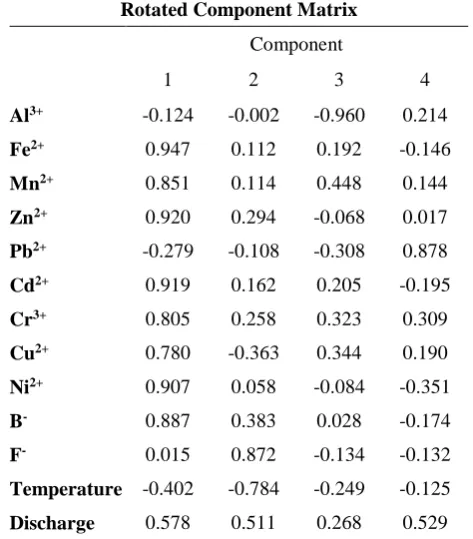
4 principle elements out of 11, temperature and river discharge. Moreover, the findings prove the correlation among the data. Table 6 shows the percentage of the extracted component total variance. In addition, Table 7 shows the rotational component matrix of water samples. The first component is described in variance of
52.061%, including Iron, Manganese, Zinc, Cadmium, Chromium, Copper, Nickel, Boron and discharge. It is suggested that these elements probably have the same origin, due to agricultural waste water, rural and urban sewages near Rahim Abad hydrometric station. The second component has the total variance of
Table 6 Percentage of the total variance of extracted components
Total Variance Explained
Component Extraction Sums of Squared Loadings Rotation Sums of Squared Loadings % of Variance Cumulative % Total % of Variance Cumulative %
1 59.344 59.344 6.768 52.061 52.061
2 13.559 72.903 2.134 16.415 68.476
3 11.091 83.993 1.683 12.945 81.421
4 8.931 92.925 1.495 11.504 92.925
16.415% containing only Fluorine and
discharge. Besides, the temperature of the river has a negative correlation. It is probably located in a separate component due to different geochemical behavior. The third component has a total variance of 12.945% including Aluminum metal. It is probably located in a
separate component due to different
geochemical behavior or different origin. In fact, there is Aluminum with low concentration in river which is probably attributed to the presence of abundant Granodiorites in the
region and rocks analysis.28 In addition, the
source of Aluminum can be related to Granodioritic rock which has high resistance against erosion. Aluminum is often recognized
Table 7 Rotated component matrix of Silakhor River water samples
Rotated Component Matrix
Component
1 2 3 4
Al3+ -0.124 -0.002 -0.960 0.214
Fe2+ 0.947 0.112 0.192 -0.146
Mn2+ 0.851 0.114 0.448 0.144
Zn2+ 0.920 0.294 -0.068 0.017
Pb2+ -0.279 -0.108 -0.308 0.878
Cd2+ 0.919 0.162 0.205 -0.195
Cr3+ 0.805 0.258 0.323 0.309
Cu2+ 0.780 -0.363 0.344 0.190
Ni2+ 0.907 0.058 -0.084 -0.351
B- 0.887 0.383 0.028 -0.174
F- 0.015 0.872 -0.134 -0.132
Temperature -0.402 -0.784 -0.249 -0.125
Discharge 0.578 0.511 0.268 0.529
Extraction Method: Principal Component Analysis. Rotation Method: Varimax with Kaiser Normalization.
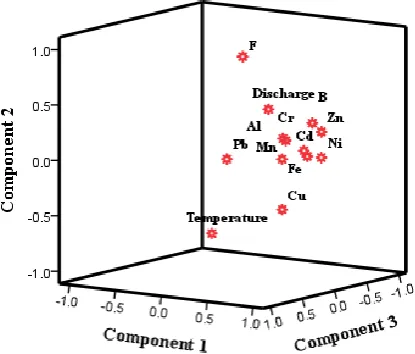
as an insoluble small amount of metal. The fourth component has a total variance of 11.504% containing Lead and Discharge. It is likely to be located in a separate component due to different origin with other elements. The upper values of permissible limit represent the anthropogenic origin of Lead which may be attributed to vehicle emissions. Figure 4 shows the effective characteristics of each factor for better comparison.
Fig. 4 Factor rotation coefficients diagram
Cluster analysis (CA)
The CA technique is an unsupervised classification procedure that involves measuring either the distance or the similarity among the clustered objects. The resulting clusters of objects should then show high internal (within
cluster ( homogeneity and high external
(between clusters) heterogeneity. Hierarchical agglomerative clustering is the most common approach which provides instinctive similar relationships between each sample and the entire data set, and is typically illustrated by a
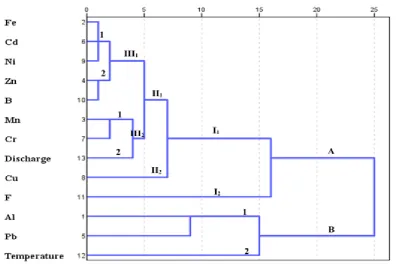
dendrogram (tree diagram).29 Cluster analysis of
the samples was studied using SPSS 19 software. The cluster diagram of the river water samples is shown in Figure 5 where two categories of A and B are distinct, more samples are in category A. Category A is divided into two groups, I1 and I2. I2 contains only Fluorine, while I1 is divided into two subgroups II1 and II2. II2 contains Copper and is probably related to Copper-Andesite, metamorphic volcanic
rocks, and tuff. Besides, II1 is divided into two parts III1 and III2. III1 includes two sections 1 and 2. III2 also includes two sub-sections 1 and 2. The four sub-sub-sections are briefly interpreted as follows: Section III1 (subsection 1) contains heavy metals like Iron, Cadmium and Nickel. High correlation of Iron with Nickel and Cadmium is due to the adsorption of these elements by Iron oxy-hydroxides. Iron is not usually considered as contaminant, but its analysis could be useful because it influences the availability of other
metals.30 Iron usually has a natural origin related
basin geology, although inconsiderable natural origin for Manganese and Chromium is possible. The Fluorine is located in the separate component, probably due to the different geochemical behavior or origin. Category B is divided into two groups of 1 and 2. Group 1 consists of Aluminum and Lead metals. Group 2 consists of water temperature of the river. Aluminum and Lead, perhaps originated from different geochemical behavior, are located in separate component. Placement of Lead and Aluminum, as well as the temperature in the category may be attributed to similar behavior of two metals with changes in temperature. Therefore, as the temperature increases and
discharge decreases, the metal concentrations increase. These metals are recognized as having standard or high concentration. Aluminum, with natural origin, can be related to Granodioritic rocks in the area. Nevertheless, there is little amount of it in the river which is related to Granodiorite high resistance and insoluble feature of Aluminum.
Lead: The higher or closer values to the permissible level proved the anthropogenic origin of Lead. River placement, Rahim Abad hydrometric station in the road vicinity, vehicle traffic, and vehicle emission are suggested to be considered as a possible origin for the lead.
Fig. 5 The cluster diagram of Silakhor River water samples
Conclusion
In the present study, water quality of Silakhor River was analyzed in terms of heavy metal pollution. According to the standard values of WHO, metal index (MI) and heavy metal evaluation index (HEI), it turned out that the amount of some heavy metals were higher than permissible limit in some of the samples. High values might be attributed to agricultural activities, urban and rural sewages, vehicle transit, and Boroujerd industrial wastewater
Statistical analysis showed that the dominant origin of the elements, particularly Cadmium, Lead, Chromium and Manganese are due to human activities. However, the natural origin and erosion of lithological units can also be considered as the minor-agent for some elements.
References
1. Pradhan UK, Shirodkar PV, Sahu BK. Physico-chemical characteristics of the coastal water off Devi estuary, Orissa and evaluation of its seasonal changes using chemometric techniques.
National Institute Oceanography
2009.96(9):1203-1209.
2. Schwarzenbach RP, Escher BI, Fenner K, Hofstetter TB, Johnson CA, Von Gunten, et al. The challenge of micropollutants in aquatic systems. Science 2006; 313(5790): 1072-77. 3. Malaj E, Peter C, Grote M, Kühne R, Mondy CP,
Usseglio-Polatera P, et al. Organic chemicals jeopardize the health of freshwater ecosystems on the continental scale. Proceedings of the National Academy of Sciences 2014; 111(26): 9549-54. 4. Zarazua G, Ávila-Pérez P, Tejeda S,
Barcelo-Quintal I, Martínez T. Analysis of total and dissolved heavy metals in surface water of a Mexican polluted river by total reflection X-ray fluorescence spectrometry. Spectrochimica Acta Part B: Atomic Spectroscopy 2006; 61(10-11): 1180-84.
5. Nouri J, Mahvi AH, Babaei A, Ahmadpour E. Regional pattern distribution of groundwater fluoride in the Shush aquifer of Khuzestan County, Iran. Fluoride 2006; 39(4): 321-325. 6. Ameh EG, Akpah FA. Heavy metal pollution
indexing and multivariate statistical evaluation of hydrogeochemistry of River PovPov in Itakpe Iron-Ore mining area, Kogi State, Nigeria. Advances in Applied Science Research 2011; 2(1): 33-46.
7. Sharma D, Kansal A. Water quality analysis of River Yamuna using water quality index in the national capital territory, India (2000–2009). Applied Water Science 2011; 1(3-4): 147-57. 8. Bhardwaj V, Singh DS. Surface and groundwater
quality characterization of Deoria District, Ganga plain, India. Environmental Earth Sciences 2011; 63(2): 383-95.
9. Brraich OS, Jangu S. Evaluation of Water Quality Pollution Indices for Heavy Metal Contamination Monitoring in the Water of
Harike Wetland (Ramsar Site), India. International Journal of Scientific and Research Publications 2015; 5(2): 1-6.
10. Dwivedi SL, Pathak V. A preliminary assignment of water quality index to Mandakini river, Chitrakoot. Indian Journal of Environmental Protection 2007; 27(11): 1036-38.
11. Nasrabadi T. An Index Approach to Metallic Pollution in River Waters. International Journal of Environmental Research 2015; 9(1): 385-94. 12. Gupta N, Yadav KK, Kumar V, Singh D.
Assessment of physicochemical properties of Yamuna River in Agra City. International Journal of Chem Tech Research 2013; 5(1): 528-31. 13. Avvannavar SM, Shrihari S. Evaluation of water
quality index for drinking purposes for river Netravathi, Mangalore, South India. Environmental Monitoring and Assessment 2008; 143(1-3): 279-90.
14. Reza R, Singh G. Heavy metal contamination and its indexing approach for river water. International Journal of Environmental Science and Technology 2010; 7(4): 785-92.
15. Patil Shilpa G, Chonde Sonal G, Jadhav Aasawari S, Raut Prakash D. Impact of Physico-Chemical Characteristics of Shivaji University lakes on Phytoplankton Communities, Kolhapur, India. Research Journal of Recent Sciences 2012; 1(2), 56-60.
16. Yankey RK, Fianko JR, Osae S, Ahialey EK, Duncan AE, Essuman DK, et al. Evaluation of heavy metal pollution index of groundwater in the Tarkwa mining area, Ghana. Elixir Pollution 2013; 54: 12663-67.
17. WHO (World Health Organization).Guidelines for Drinking-Water Quality,2011
18. The report of Geology studies of regional water, 2009
19. Edet A, Offiong O. Evaluation of water quality pollution indices for heavy metal contamination monitoring. A study case from Akpabuyo-Odukpani area, Lower Cross River Basin (southeastern Nigeria). Geo Journal 2002; 57(4): 295-304.
20. Bakan G, Özkoç HB, Tülek S, Cüce1T H. Integrated environmental quality assessment of the Kızılırmak River and its coastal environment. Turk. J. Fish. Aquat 2010; 10(4): 453-462. 21. Caeiro S, Costa MH, Ramos TB, Fernandes F,
22. Mohan SV, Nithila P, Reddy SJ. Estimation of heavy metals in drinking water and development of heavy metal pollution index. Journal of Environmental Science and Health Part A 1996; 31(2): 283-89.
23. Prasad B, Sangita K. Heavy metal pollution index of ground water of an abandoned open cast mine filled with fly ash: A case study. Mine Water and the Environment 2008; 27(4): 265-67.
24. Zhang L, Shi Z, Zhang JP, Jiang Z, Wang F, Huang X. Spatial and seasonal characteristics of dissolved heavy metals in the east and west Guangdong coastal waters, South China. Marine pollution bulletin 2015; 95(1): 419-26.
25. Bingöl D, Ay Ü, Bozbaş SK, Uzgören N. Chemometric evaluation of the heavy metals distribution in waters from the Dilovası region in Kocaeli, Turkey. Marine pollution bulletin 2013; 68(1-2): 134-39.
26. Li X, Liu L, Wang Y, Luo G, Chen X, Yang X, et al. Heavy metal contamination of urban soil in an old industrial city (Shenyang) in Northeast China. Geoderma 2013; 192: 50-58.
27. Looi LJ, Aris AZ, Johari WLW, Yusoff FM, Hashim Z. Baseline metals pollution profile of tropical estuaries and coastal waters of the Straits of Malacca. Marine pollution bulletin 2013; 74(1): 471-76.
28. Khalaji AA, Esmaeily D, Valizadeh MV,
Rahimpour-Bonab H. Petrology and
geochemistry of the granitoid complex of Boroujerd, Sanandaj-Sirjan Zone, Western Iran.Journal of Asian Earth Sciences 2007; 29(5-6): 859-77.
29. McKenna JE. An enhanced cluster analysis program with bootstrap significance testing for ecological community analysis. Environmental Modelling and Software 2003; 18(3): 205-20. 30. Desrosiers M, Gagnon C, Masson S, Martel L,