A Multidimensional Analysis of Social Vulnerability
10
0
0
Full text
(2) Hyperion Economic Journal. Year I, no.3(1), September 2013. diminishing abandon and protecting all children’s rights, for an as good as possible solving of issues facing individuals and families from the social and economic viewpoint.. 2. Main characteristics of the social vulnerability in the European Union One of the definitions given to vulnerability is the one of “weakness”, “lack of defence”, “lack of means”. The vulnerable groups are groups lacking support which often find themselves in chronic poverty situations, being incapacitated from profiting by the opportunities or from defending themselves against the issues with which they are faced. The analyses realised by the European Statistical Office (EUROSTAT) have highlighted the fact that an impressive number of individuals live under the poverty threshold, and many persons are faced with difficulties regarding access to a job, education, housing, and financial services. At the European Union level is considered that “all citizens should benefit from the advantages of prosperous periods and, also, from solidarity in difficult times”. The most recent data show that 16% from the Europeans are still at poverty risk. Even if the best protection measure against poverty is ensuring a quality job, the percentage of 8% of those in employment but still facing the poverty risk proves that not all jobs provide for such safety. Against the significant increase of unemployment in some member-states, the contribution of social policies is crucial in combating poverty. Children are faced with a higher poverty risk of 19% in EU-27, as compared with the rest of the population, a phenomena persisting from 2000. The actions developed within the Open Method of Coordination in 2007 have contributed to identifying the factors triggering poverty among children in each member state and has underpinned the need for some comprehensive strategies that would mix adequate forms of financial assistance with quality employment opportunities for parents and by supplying the necessary services. With respect to the population of Rroma ethnicity, the actions taken and enforced were centred mainly on desegregation, access to labour market, approaching education disadvantages and improving access to services like housing and health. Still, the majority of countries are short of an all-comprising political framework due, among others, to lack of basic data and information. Persons without shelter represent the most severe form of social exclusion. At the level of many member states the efforts for ensuring more accessible dwellings were intensified, but the lack of data regarding the number of persons without shelter represents a hindrance in defining and monitoring effective policies. At the level of the member states, inequalities with respect to access to health services between various socio-economic groups persist, and these tend to complete their universal approach with measures that are directed to those vulnerable. Basic policy approaches are: intensifying primary and preventive care, eliminating barriers in accessing health services and righting the situation in disadvantaged regions. Solving some issues of vulnerable groups, of combating social exclusion can be also realised by means of education. Pre-school education is regarded in the member-states as a fundamental element, a key-element in straightening socio-economic disadvantages and as a means of facilitating reconciling professional and family life. At European Union level, the year 2010 was appointed as the “European year of combating poverty and social exclusion” and had as purpose “increasing the awareness degree. 31.
(3) Hyperion Economic Journal. Year I, no.3(1), September 2013. about difficulties with which are faced vulnerable groups within society1 (84 million Europeans were living under the poverty threshold in 2010). In the European Union 17% from population is affected by poverty. The four objectives that guided the Year were: recognition of rights, responsibility and joint participation, cohesion, commitment and concrete actions. The actions taken in the 29 countries participating to this programme have completed the existing initiatives of the EU in the field and have increased the visibility of persons facing poverty and social exclusion. In the majority of countries were organised activities that answer to the needs of all vulnerable groups: elderly numerous families, and monoparental families, children and youths, persons with disabilities, immigrants, persons from among ethnic minorities. In this context, the vulnerable groups are delimitated by comparison with the majority of the population, as having more difficult living conditions: precarious housing or lack of housing, unemployment, low education level, and lack of incomes. One of the five major objectives of the Strategy “Europe 2020” 2 which follows to be fulfilled up to 2020 is “social inclusion”, as well. As result, at the level of the European Union is pursued that up to 2020 the number of persons running the risk of poverty and social exclusion shall be diminished by at least 20 millions. Also, the achievement of this intention means undertaking a series of measures, among which: • improving access to labour market, to social protection, to services of general interest (for instance, health care, finding a house) and to education; • more efficient use of European funds for supporting social inclusion and for combating discrimination; • testing and evaluating social policy reforms for increasing the efficiency in the field of social inclusion; • realising new partnerships with the public and private sector and valuing the potential of the social economy; By these measures is pursued that persons living now in poverty, and especially the most vulnerable (women, immigrants, Rroma population and other ethnic minorities, persons with disabilities) shall benefit from an improvement in their living condition and, thus, all European citizens shall live in a more cohesive society with a smart, sustainable economic growth based on inclusion. Achieving the objectives of the “Europe 2020” Strategy depends on all actions that shall be taken by each country, in particular in the field of labour force employment, of education and poverty. The determinant factors in combating poverty and social exclusion are: economic growth and conceiving successful policies regarding labour force employment and education. Even if in countries with high employment rates of labour force, the poverty and exclusion levels tend to be low still, more often than not a job is not a guarantee against poverty. In this context is of importance “the modernisation and strengthening of the countries’ policies regarding labour force employment, education and training, as well as the social protection systems by increasing participation to labour market and diminishing structural unemployment, as well as by increasing social responsibility of enterprises within the business community” 3. 1. Decision No 1098/2008/EC of the European Parliament and the Council, of 22 October 2008, on the European Year for Combating Poverty and Social Exclusion (2010), http://eur-lex.europa.eu 2 “EUROPE 2020, A European Strategy for Smart, Sustainable and Inclusive Growth”, European Commission, Bruselles, 3.3.2010, COM(2010) 2020 final, http://eur-lex.europa.eu; 3 “EUROPE 2020, A European Strategy for Smart, Sustainable and Inclusive Growth”, European Commission, Bruselles, 3.3.2010, COM(2010) 2020 final, http://eur-lex.europa.eu. 32.
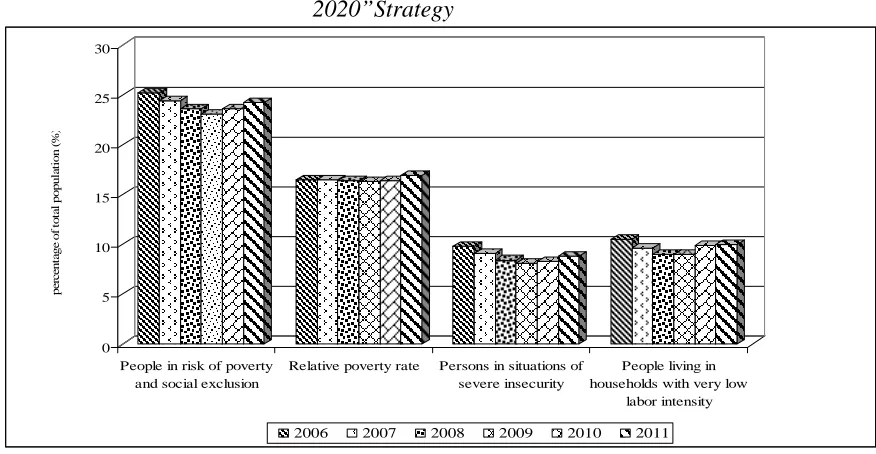
(4) Hyperion Economic Journal. Year I, no.3(1), September 2013. The objective of the “Europe 2020” strategy to guarantee the fact that the benefits of economic growth are widely distributed and that persons currently at the fringes of society can play an active role within its framework is reflected by means of three indicators that approach the varied characteristics of poverty and exclusion in Europe, as well as the different situations and priorities among the member-states: i) the number of persons exposed to poverty risk; ii) the severe material precariousness level; iii) number of persons living in households where the extremely low level of labour force employment represents a primordial element. Also, the European Commission and the member-states have adopted a common list of indicators, from among which we enumerate: the relative poverty rate, material precariousness , the number of persons exposed to poverty risk or to the social exclusion one, and the number of persons living in households with very low labour intensity. In the period 2008-2011, at European Union level, none of these indicators underwent significant changes (Figure 1). For the year 2011, the relative poverty rate was of 16.9%, by 0.5 pp higher than in 2010 and material precariousness – indicator describing the situation of persons that cannot afford goods regarded as essential for decent living in Europe and reflecting the differences with respect to living standards was, in average, in the year 2011, of about 8.8% (which means that over 40 million individuals were in a situation of severe material precariousness) (Figure 1). Figure 1 European Union Level Indicators Used for Monitoring the “Europe 2020”Strategy 30. percentage of total population (%). 25. 20. 15. 10. 5. 0 People in risk of poverty and social exclusion. Relative poverty rate. 2006. 2007. Persons in situations of People living in severe insecurity households with very low labor intensity. 2008. 2009. 2010. 2011. Data sources: Eurostat statistics, online code: [tsdsc100], [tsdsc270], [tsdsc310)], [tsdsc320)], [ilc_lvhl11]. With respect to the weight of persons living in households with very low labour intensity in total population, for the year 2011 it was of 10%, which indicates that over 37 million persons live in households where non are employed (or where the members of the households work very little), yet who do not necessarily live with very low incomes. Also, in the year 2010, over 115 million persons, that is 24% from the European Union population. 33.
(5) Hyperion Economic Journal. Year I, no.3(1), September 2013. were in a risk situation quantified at least by one of the above-mentioned indicators regarding poverty, precariousness and pertaining to a household with very low labour intensity. For Romania, the relative poverty rate had a decreasing evolution in the period 20072010, reaching in the year 2010 the value of 21.1 pp, at a difference of 4.7 pp from the value of the EU-27 relative poverty rate, but in 2011 in Romania this rate increased by 1.1 pp. If the weight of the persons in severe precariousness situations was in the year 2011 in Romania of 29.4% much over the EU-27 value (8.8%), the weight of persons living in households with very low labour intensity in total population was under the EU-27 average (6.7% against the 10% EU-27 average) (Figure 2). Figure 2. Evolution of the gap between the poverty and social exclusion indicators in Romania and EU-27 2011. 2010. 2009. 2008. 2007 -5. (%). 0. 5. 10. 15. 20. 25. 30. People in risk of poverty and social exclusion. Relative poverty rate. Persons in situations of severe insecurity. People living in households with very low labor intensity. Data source: Eurostat statistics, online code: [tsdsc100], [tsdsc270], [tsdsc310)], [tsdsc320)], [ilc_lvhl11]. 3. General characteristics of social vulnerability in Romania The state by means of economic-social policies developed, by measures for stimulating employment, and for guaranteeing the minimum wage on economy, of ensuring the necessary resources for paying rights resulting from social insurances, by granting the services pertaining to the social assistance system, as well as by ensuring quality social services has an important role in diminishing poverty. Due to the multidimensional character of social vulnerability, for its diminishment the Government of Romania adopted a series of measures in view of solving some socio-cultural, housing, health, employment, education and birth increase issues, along with the ones for diminishing abandon, and promoting and protecting the rights of all children, for better meeting the issues faced by the individuals and families from the social and economic viewpoint. In analysing the vulnerability a series of indicators were used: primary – calculated in accordance with the methodologies set at European level, and secondary and tertiary ones – which reflect the social situation specific to Romania. 34.
(6) Hyperion Economic Journal. Year I, no.3(1), September 2013. For Romania, the fields in which the tertiary indicators were grouped are: resources, labour market, housing conditions, education, health, and public order. Some of these indicators refer to poverty and inequality, respectively: relative poverty, absolute poverty, income (taken into account for measuring relative poverty) and consumption (including self-consumption) for measuring absolute poverty. Also, for Romania, consumption expenditures estimate much better than incomes the actual economic situation of the households due to the tendency of under-reporting of incomes, to the difficulty of measuring informal incomes and to the existence of population’s credits. To these is added also the fact that Romania is an economy with a strong agricultural component, the consumption expenditures reflecting thus much better the actual economic situation of the households due to a higher stability in time, as compared with the incomes affected by seasonality. The analysis of absolute poverty on areas of residence in Romania for the period 2003-2010 highlights a decreasing trend at the level of each region up to the year 2009. As result of the economic crisis, in 2010 were recorded increases of this indicator, more marked for the rural areas (Figure 3). Figure 3 Evolution of the absolute poverty rate on areas of residence in Romania 40 (%) 35 30 25. 25.1 Urban. 20. Rural Total. 18.8 15.1. 15. 13.8. 10. 9.8 5.7. 5. 4.4. 5.2. 0 2003. 2004. 2005. 2006. 2007. 2008. 2009. 2010. Data source: Annex 3 Report regarding social inclusion in Romania in the year 2010, Ministry of Labour, Family and Social Protection, Directorate Social Services and Social Inclusion, Department social indicators and social inclusion programmes. Regarding the distribution of poor population, in the year 2010, 82.9% of this population was in the rural area (on increase by 8.9 pp against 2009), year in which, in the urban area the poor population diminished by 8.9 pp. Almost one quarter of the poor population in accordance with the definition of severe poverty lived, in 2010, in the NorthEast region: 24.4%, and in the Centre region 18.1%, and in the South-East region 17.3% (Figure 4). Against the year 2009, the pauperisation process was most marked in the NorthEast region (change in 2010 against 2009:12.9%) and inexistent in the Bucharest region.. 35.
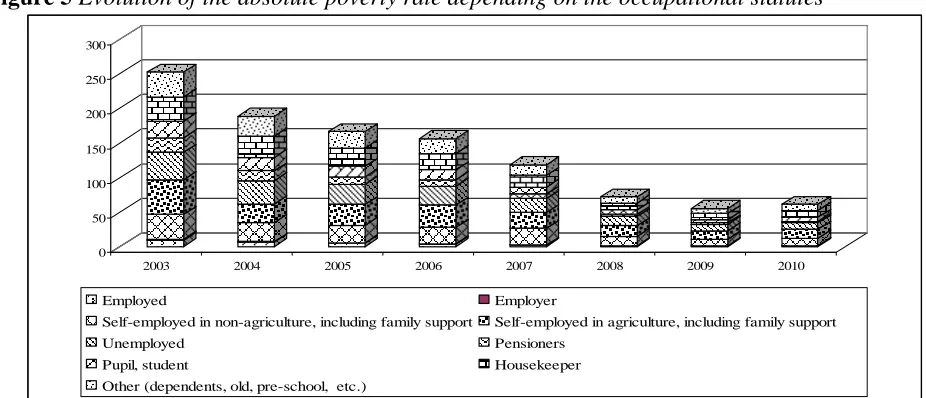
(7) Hyperion Economic Journal. Year I, no.3(1), September 2013. Figure 4 Distribution of poor population (severe poverty) in Romania on areas of residence and development regions 40 35 30 25 20 15 10 5 0 2003. 2004. 2005. 2006. North - East West. South - East North - West. Urban. Rural. 2007. 2008. 2009. South - Muntenia Center. 2010. South - West Oltenia Bucharest - Ilfov. Data source: Annex 3 Report regarding social inclusion in Romania in the year 2010, Ministry of Labour, Family and Social Protection, Directorate Social Services and Social Inclusion, Department social indicators and social inclusion programmes. The analysis of absolute poverty depending on the occupational statutes highlights a substantial diminishment of it for all occupational categories in the period 2003-2009 (Figure 5) and slight increases in the year 2010. Figure 5 Evolution of the absolute poverty rate depending on the occupational statutes 300 250 200 150 100 50 0 2003. 2004. 2005. 2006. 2007. 2008. 2009. 2010. Employed. Employer. Self-employed in non-agriculture, including family support. Self-employed in agriculture, including family support. Unemployed. Pensioners. Pupil, student. Housekeeper. Other (dependents, old, pre-school, etc.). Data source: Annex 3 Report regarding social inclusion in Romania in the year 2010, Ministry of Labour, Family and Social Protection, Directorate Social Services and Social Inclusion, Department social indicators and social inclusion programmes. The differentiation of social vulnerabilities at the level of Romania’s development regions is due also to regional disparities of the gross domestic product per capita. Thus, in the year 2010, in the North-East region the GDP/capita was of 21827.2 RON/capita, 3.87 times less than the one registered in the region Bucharest-Ilfov. Also, in the regions with a high degree of social vulnerability, the average number of employees is much smaller than in the others. In all regions, the ILO long-term unemployment rate is situated under 6%, high values being registered in the regions Centre, South-East and South-Muntenia. Much higher values 36.
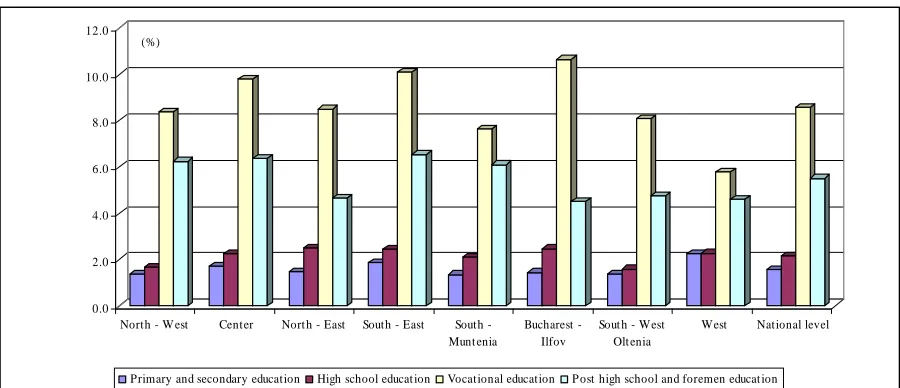
(8) Hyperion Economic Journal. Year I, no.3(1), September 2013. were recorded for the long-term unemployment rate amongst youths in the majority of regions, which indicates that this population segment is the most vulnerable. Population with ages between 6 and 24 years represents 37.5% from the poor population of Romania (Figure 6), the absolute poverty rate for this segment varying between 7.7 - 9.5%. For all the other age groups, the absolute poverty rate varies between 2.3 - 5.7%, the lowest level being recorded for the segment 60 to 64 years of age. Figure 6 Distribution of poor population on age groups 100%. 80%. 60%. 40%. 20%. 0% 2003 0-5. 6-14. 2004 15-19. 2005 20-24. 25-29. 2006 30-34. 2007. 35-39. 40-44. 2008 45-49. 50-54. 2009 55-59. 2010 60-64. 65+. Data source: Annex 3 Report regarding social inclusion in Romania in the year 2010, Ministry of Labour, Family and Social Protection, Directorate Social Services and Social Inclusion, Department social indicators and social inclusion programmes. Another element leading to the increase of the vulnerability degree of some persons is also school abandon. In the development regions of Romania, this indicator for primary and secondary education in the school year 2009-2010 exceeds the average value of 2.2% only in the South-East region. Figure 7 Abandon Rate in Pre-University Education, at Regional Level, in 2009/2010 Scholar Year 12.0 (%) 10.0. 8.0. 6.0. 4.0. 2.0. 0.0 North - W est. Center. Nort h - East. Primary and secondary education. South - East. High school educat ion. South Munt enia. Bucharest Ilfov. Vocational education. Sout h - West Olt enia. West. National level. P ost high school and foremen educat ion. Data source: Romania’s Statistical Yearbook, 2011, National Institute of Statistics, Table 8.29. High values of the school abandon rate are registered for vocational education where the value at national level is of 8.6%, and in the regions Centre, South-East and BucharestIlfov is exceeded (Figure 7). Because in Romania the obtained skills don’t have the same 37.
(9) Hyperion Economic Journal. Year I, no.3(1), September 2013. specialisation degree as those obtained in other European countries, as they are based more on general criteria and not on the specific abilities of each individual, this could be an explanation for the high abandon rate for this type of education in the Bucharest region, region which comprises the capital of the country and which can provide for other opportunities of vocational training, employment, etc. In this context, in the year 2010, 33.6% from the poor population was represented by individuals with no education, 24.7% with primary education, and 24.4% with secondary education. The weight of poor population with secondary education (classes 9-10 or 9-12) and of those graduating vocational/trades/apprenticeship schools was of 9.2%, respectively 8.1%.. 4. Conclusions The brief analysis of some indicators of the social vulnerability have lead to extracting some conclusions, among which: Ø the absolute poverty risk was, in average, 4 times higher in the rural area than in the urban area; Ø the North-East region and the regions from the southern part of Romania register higher poverty rates than the ones at national level; Ø self-employed have registered the highest poverty rates (especially those developing their activity in agriculture, and pensioners have a poverty rate under the national average); Ø the most vulnerable age segments are, irrespective of the region, children and youths; Ø according to the education level, the highest poverty rates were the ones of individuals with no education, and for those who graduated only primary education (grades 1-4), and of those with secondary education; Ø school abandon, which is high in particular in the Centre region and in the regions from the southern part of Romania, determines the much higher unemployment rate amongst youths against the general one and this, together with the specific socio-economic factors to each region might become an important factor in increasing the vulnerability of several persons; Ø in Romania the Rroma ethnicity continues to register a poverty rate much above the national level (about 6 times higher than the value registered at national level) and it also represents a population segment which is very vulnerable from the social viewpoint; Ø persons living in large households of five members or more are exposed to a 5 times higher poverty risk as compared with the one corresponding to persons in single households; Ø households managed by women, irrespective of the region in which they are, are much more affected by poverty than the ones managed by men, due to the fact that to a large extent women designated as family heads are less active on the labour market.. 5. Selective Literature 1. Popescu R., (2011), Dimensiunii Incluzive ale Grupurilor Vulnerabile, REES, Anul I 2/2011; 2. *** Anuarul Statistic al României, 2011, Institutul Naţional de Statistică;. 38.
(10) Hyperion Economic Journal. Year I, no.3(1), September 2013. 3. *** “EUROPA 2020, O strategie europeană pentru o creştere inteligentă, ecologică şi favorabilă incluziunii”, Comisia Europeană, Bruxelles, 3.3.2010, COM(2010) 2020 final, http://eur-lex.europa.eu; 4. *** Decision No 1098/2008/EC of the European Parliament and the Council, of 22 October 2008, on the European Year for Combating Poverty and Social Exclusion (2010), http://eur-lex.europa.eu; 5. *** Raport privind incluziunea socială în România în anul 2010, Ministerul Muncii, Familiei şi Protecţiei Sociale, Direcţia Servicii Sociale şi Incluziune Socială, Compartiment indicatori sociali şi programe incluziune socială; 6. *** Raport statistic privind M.M.P.F.S. în domeniul incluziunii sociale, în semestrul I 2012, Ministerul Muncii, Familiei şi Protecţiei Sociale, Direcţia Servicii Sociale şi Incluziune Socială, Compartiment indicatori sociali şi programe incluziune socială;. 39.
(11)
Figure
Related documents
Attached is information on common practices in the management of research budgets according to topics: employment in research (administrative and technical staff,
A bachelor’s degree, majoring in Management, Finance or a cognate subject, an Advanced Diploma in Management, Finance or Financial Planning or an equivalent
The overall research question was, specifically, how do first generation, low-income high school seniors, in their second semester of the senior year and who have been identified
Our prelimi- nary results show that Non-inclusive protocols save write dynamic energy mostly due to reduced number of line fills compared to an inclusive protocol.. We study
De tal manera existe una estrecha relación entre lo que entendemos por memoria social (Fentress. y Wickman 2003) y patrimonio; habida cuenta de que la memoria social
This will allow us to obtain some results about the existence of a solution for a quadratic BSDE outside of the standard framework, moving away from the bounded case to the case
These figures are obtained from the comparative period information in the audited consolidated financial statements of Scout24 Holding GmbH for the short financial
Our finding of increased TNF- α and MCP-1 expression prior to significant plaque deposition in 3xTg- AD mice, which occurs extensively at 12 months [19], may represent a
