R E S E A R C H
Open Access
Benchmarking the transparency,
comprehensiveness and specificity of
population nutrition commitments of major
food companies in Malaysia
SeeHoe Ng
1, Gary Sacks
2, Bridget Kelly
1, Heather Yeatman
1, Ella Robinson
2, Boyd Swinburn
2,3,
Stefanie Vandevijvere
3, Karuthan Chinna
4, Mohd Noor Ismail
5and Tilakavati Karupaiah
6,7*Abstract
Background:The aim of this study was to assess the commitments of food companies in Malaysia to improving population nutrition using the Business Impact Assessment on population nutrition and obesity (BIA-Obesity) tool and process, and proposing recommendations for industry action in line with government priorities and
international norms.
Methods:BIA-Obesity good practice indicators for food industry commitments across a range of domains (n= 6) were adapted to the Malaysian context. Euromonitor market share data was used to identify major food and non-alcoholic beverage manufacturers (n= 22), quick service restaurants (5), and retailers (6) for inclusion in the assessment. Evidence of commitments, including from national and international entities, were compiled from publicly available information for each company published between 2014 and 2017. Companies were invited to review their gathered evidence and provide further information wherever available. A qualified Expert Panel (≥5 members for each domain) assessed commitments and disclosures collected against the BIA-Obesity scoring criteria. Weighted scores across domains were added and the derived percentage was used to rank companies. A Review Panel, comprising of the Expert Panel and additional government officials (n= 13), then formulated recommendations.
(Continued on next page)
© The Author(s). 2020Open AccessThis article is licensed under a Creative Commons Attribution 4.0 International License,
which permits use, sharing, adaptation, distribution and reproduction in any medium or format, as long as you give appropriate credit to the original author(s) and the source, provide a link to the Creative Commons licence, and indicate if changes were made. The images or other third party material in this article are included in the article's Creative Commons licence, unless indicated otherwise in a credit line to the material. If material is not included in the article's Creative Commons licence and your intended use is not permitted by statutory regulation or exceeds the permitted use, you will need to obtain
permission directly from the copyright holder. To view a copy of this licence, visithttp://creativecommons.org/licenses/by/4.0/.
The Creative Commons Public Domain Dedication waiver (http://creativecommons.org/publicdomain/zero/1.0/) applies to the
data made available in this article, unless otherwise stated in a credit line to the data. * Correspondence:[email protected]
6
Dietetics Programme, School of Healthcare Sciences, Faculty of Health Sciences, Universiti Kebangsaan Malaysia, 50300 Kuala Lumpur, Malaysia 7School of Biosciences, Faculty of Health and Medical Sciences, Taylor’s University, 47500 Subang Jaya, Selangor, Malaysia
(Continued from previous page)
Results:Of the 33 selected companies, 6 participating companies agreed to provide more information. The median overall BIA-Obesity score was 11% across food industry sectors with only 8/33 companies achieving a score of > 25%. Participating (p< 0.001) and global (p= 0.036) companies achieved significantly higher scores than non-participating, and national or regional companies, respectively. Corporate strategy related to population nutrition (median score of 28%) was the highest scoring domain, while product formulation, accessibility, and promotion domains scored the lowest (median scores < 10%). Recommendations included the establishment of clear targets for product formulation, and strong commitments to reduce the exposure of children to promotion of unhealthy foods.
Conclusions:This is the first BIA-Obesity study to benchmark the population nutrition commitments of major food companies in Asia. Commitments of companies were generally vague and non-specific. In the absence of strong government regulation, an accountability framework, such as provided by the BIA-Obesity, is essential to monitor and benchmark company action to improve population nutrition.
Keywords:Population nutrition, Obesity, Non-communicable diseases, Commitments, Food company, Accountability, Policy
Background
Malaysia is among the countries with high obesity [1] and non-communicable disease (NCD) [2] rates in the South-East Asian region. The magnitude of risk for premature death from NCDs was 17% in Malaysia in 2016 [3]. ‘Dietary risks’ for NCDs in Malaysia account for 14.6% and ‘high body mass index’ accounts for 9.9% of disability-adjusted life years, as estimated by the Global Burden of Disease [4]. Key causes of un-healthy diets are rapid urbanisation, economic growth and social change coupled with trade liberalisation, which collectively trigger food system shifts towards convenience and ultra-processed foods [5–8]. Almost 70% of Malaysia’s population is urbanised [9] with in-creased market concentration of ultra-processed foods such as sweet and savoury snacks, carbonated drinks, packaged foods, biscuits and confectionery [6]. A re-cent population study in urban Malaysia highlighted that increased atherogenic and insulinemic risk pro-files and obesity were associated with dietary patterns high in calories, fat, and sugars [10].
Prevention of diet-related NCDs requires consider-ation of the production, marketing, and consumption of commercially produced ultra-processed food products [11, 12]. The scope for preventive action for improving population nutrition therefore extends to actions by commercial food producers. The WHO [13, 14] recog-nises the need for transnational, regional and local food and non-alcoholic beverage industries, retailers, and catering companies to take responsibility in tackling obesity and diet-related NCDs via product reformula-tion, nutrition labelling, responsible marketing to chil-dren and healthy food accessibility. The Malaysian government, through its Eleventh Malaysia Plan 2016– 2020, identified the private sector as a key stakeholder in promoting health, specifically through corporate social responsibility (CSR) activities [15].
Malaysia’s National Plan of Action for Nutrition of Malaysia (NPANM) III 2016–2025 [16], and the Na-tional Strategic Plan for Non-communicable Disease
(NSP-NCD) 2010–2014 [17] and NSP-NCD 2016–2025
[18] set the basis for food industry engagement as part of efforts to improve population nutrition and health. In response to the NSP-NCD, theFederation of Malaysian Manufacturers (FMM) developed a range of related commitments and also engaged more companies to par-ticipate in NCDs prevention and control programmes [19]. Industry commitments included self-regulation ap-proaches such as theResponsible Advertising to Children
(Malaysia Pledge), and participating in the Malaysian Healthier Choice Logoprogramme and sugar reformula-tion initiative [19–21]. In addition, the Malaysian government has stated an intention to implement mandatory regulations such as imposing declarations for total sugars and sodium for all food products, restricting television advertising of foods and beverages high in fat, sugar and salt targeting children, and imposing a sugar tax on unhealthy foods and beverages [16]. Therefore, an independent monitoring framework is needed to gen-erate baseline data to enable future comparisons if there is progress in implementing mandatory regulations.
methods to assess companies’ commitments in popula-tion nutripopula-tion and obesity at the napopula-tional level. The BIA-Obesity assessment also includes quick service restaurants (QSR) and retailers such as supermarkets and convenience stores, in addition to food and non-alcoholic beverage manufacturers. The BIA-Obesity tool has previously been applied to Australia [28–30], New Zealand [31], and Canada [32]. It has been recom-mended that BIA-Obesity country level evaluations be used to monitor and evaluate food industry’s progress towards meeting country specific nutrition policies and health criteria, while at the same time building a central database to enable cross-country comparisons [27,33].
We conducted the first BIA-Obesity in an Asian coun-try. The study included those food companies with na-tional, regional and global presence and with the largest market shares in Malaysia, for each of the four sectors (food and non-alcoholic beverage manufacturing, QSR and retailer sectors). The study also generated recom-mendations for industry actions, in line with govern-ment’s priorities and international norms.
Methods
Business impact assessment on population nutrition and obesity (BIA-obesity)
BIA-Obesity is a defined tool and process developed by the International Network for Food and Obesity/ NCDs Research, Monitoring and Action Support (INFORMAS) [22, 27]. It utilises a step-based approach to assess the nutrition-related practices of major food companies within a country’s food system. Phase I of BIA-Obesity focuses on an assessment of company policies and com-mitments, while Phase II focuses on company practices, including how commitments translate into actions. This study implemented and reported Phase I of BIA-Obesity in Malaysia.
Adaptation of the tool
The development of BIA-Obesity has been detailed by Sacks et al. [27]. In brief, the BIA-Obesity assessment in-corporates six domains: (1)Corporate strategy- assesses company’s overarching approach to addressing obesity and NCDs; (2) Product formulation– assesses targets of nutrients of concern, and portion size or energy reduc-tion in new or existing products; (3) Nutrition labelling
– focuses on the display of nutrition information on packaged foods, online and/or menus, where applicable; (4) Promotion practices – benchmarks efforts to reduce marketing of non-core foods that do not fulfil specific nutrition criteria in all settings (including catalogues and in-store promotion in retailer sector), (5) Product acces-sibility – analyses availability and pricing commitments on healthy products, compared to non-core products; and (6) Relationships with external organisations –
evaluates funded and supported corporate social respon-sibility (CSR) activities. Weighting of the domains used for this assessment was based on several consultations within the INFORMAS network [27]. The allocations are out of 100 as per sectors (see Additional file 1). Scoring was based on the comprehensiveness, transpar-ency and specificity of policies and commitments.
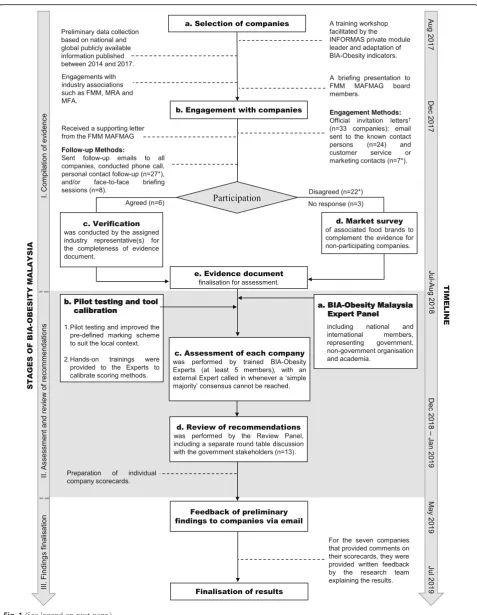
The Malaysian research team adapted the global version of the BIA-Obesity tool for the local context, in conjunction with the INFORMAS private sector module leader (GS). The process of adapting the tool consisted of an iterative process that included mul-tiple face-to-face training workshops on the BIA-Obesity protocol and discussion amongst the project team. The process for implementation of BIA-Obesity in Malaysia consisted of three stages: compilation of evidence, assessment and review of recommendations, and findings finalisation (Fig. 1).
The BIA-Obesity tool was adapted with several modifi-cations on selected indicators to suit the local context [27]. For instance, BIA-Obesity Malaysia included modi-fications to assess: (1) voluntary adoption of Malaysian
Healthier Choice Logo (product formulation and label-ling domains), (2) implementation of quantitative ingre-dient declarations (QUIDs) (labelling domain); (3) government-endorsed front-of-pack (FOP) labelling scheme (i.e. a single icon for ‘energy based on a daily calorie intake of 2000 kcal and Healthier Choice Logo) (labelling domain); (4) specifying policies related to (i) nutrient function claims and (ii) nutrition claim in ac-cordance with permitted claims in Malaysia Food Regu-lations 1985 (labelling domain) (see Additional file2).
Stage I: Compilation of Evidence
a. Selection of companies
initiatives with regards to obesity prevention, which ex-cludes undernutrition issues (e.g. fortified products).
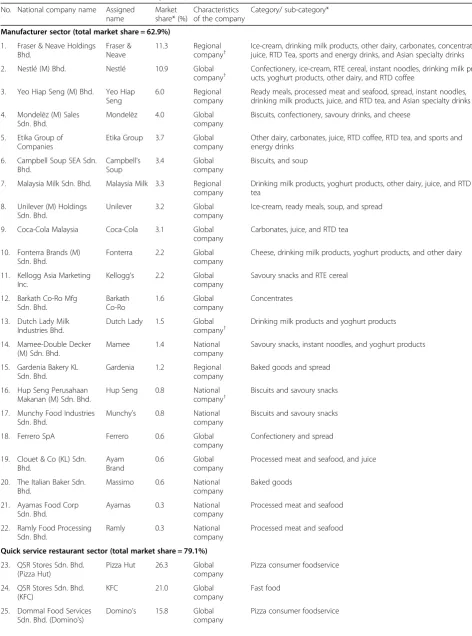
Market share according to food categories (except re-tailer sector) was applied for company selection (see Additional file 3). The retail values of companies per food category were first ranked from the highest to low-est. Subsequently, company selection was based on two criteria: (1) at least the top quarter of retail values for each subcategory; and (2) sum of the average retail value for all subcategories to fulfil at least 50% of the relevant market share. The second criterion however was not ap-plied to the retailer sector in Malaysia due to the large number of smaller grocers and the relatively small mar-ket share of the largest companies in the sector. Thirty-three food companies were selected, including food and beverage manufacturers (n= 22, representing 62.9% of the relevant market share), QSR (n= 5, 79.1% market share) and retailer (n= 6, 26.2% market share) sectors (Table 1). Most companies selected for inclusion in the study had their parent company located outside of Malaysia (25/33), although six companies were publicly listed in the Malaysian stock market [39].
Company commitments against assessed indicators published between 2014 and 2017 were extracted from publicly available information. Evidence was sourced from company/ brand websites, annual reports, policy statements or guidelines, press releases and social media posts (e.g. Facebook). The study included information published at the national, global industry association and/or parent company level, and government websites. Each company’s commitments were then compiled in a Microsoft Word file.
b. Engagement with companies
Various industry associations were contacted but only FMM was willing to support the project and circulated an endorsement letter to members. Contact informa-tion for individual companies was collated from FMM (n= 22) and also by accessing company/brand websites, phone call inquiries and/or professional networking websites, such as LinkedIn. The engagement process in-cluded sending official invitation letters to companies (n= 33); and emails to known contact persons (n= 24) and customer service or marketing contacts (n= 7) (see Additional file 4). Information related to the research
purpose and process, industry’s role, risks and benefits, as well as the use of research outcomes were provided to the selected companies. Subsequent follow-up emails, phone calls and/or individual briefing sessions (n = 8) were conducted in an effort to increase com-pany participation by providing more information about the study.
c. Verification
Company-specific evidence in a summarised document was sent to each of the participating company contacts. Participating companies were those that assigned a rep-resentative(s) to verify the evidence document, as well as provide additional evidence if available and substanti-ated. In total, six participating companies went through this process. The verification process took 3 to 5 months. Participating companies returned a verification sign-off form and there was a non-disclosure clause to keep con-fidential statements disclosed solely for scoring purposes.
d. Market survey
Non-participating companies were those which did not consent to verify the evidence document. Their as-sessment was consequently based on publicly available information. This is consistent with other studies [26, 28–30, 32, 40]. Market surveys of non-participating companies were conducted on a sample of in-store products of food and beverage manufacturers, menus for QSR and in-house brands for retailer sectors. Photo-graphs of products of these companies were captured to provide supplementary evidence for selected indicators of the nutrition labelling domain. These included avail-abilities of QUIDs; total sugars, added sugars ortrans-fat content on back-of-pack labelling; types of FOP label-ling; and/or menu labelling.
e. Evidence document
With the completion of the data collection process for participating and non-participating companies, the fina-lised evidence documents were formatted as per indica-tors for each company to be evaluated. Evidence was consolidated for national and global commitments. (See figure on previous page.)
Fig. 1Process of implementation of BIA-Obesity in Malaysia. Abbreviations: BIA-Obesity = Business Impact Assessment-Obesity; FMM = Federation of Malaysian Manufacturers; FMM MAFMAG = Federation of Malaysian Manufacturers Malaysian Food Manufacturing Group; MRA = Malaysia
Retailers Association; MFA = Malaysian Franchise Association. Notes:†Invitation letters were posted to all companies except for 3 companies who
Table 1Characteristics of the selected companies (n= 33) across sectors
No. National company name Assigned name
Market share* (%)
Characteristics of the company
Category/ sub-category*
Manufacturer sector (total market share = 62.9%)
1. Fraser & Neave Holdings Bhd.
Fraser & Neave
11.3 Regional company†
Ice-cream, drinking milk products, other dairy, carbonates, concentrates, juice, RTD Tea, sports and energy drinks, and Asian specialty drinks
2. Nestlé (M) Bhd. Nestlé 10.9 Global
company†
Confectionery, ice-cream, RTE cereal, instant noodles, drinking milk prod ucts, yoghurt products, other dairy, and RTD coffee
3. Yeo Hiap Seng (M) Bhd. Yeo Hiap Seng
6.0 Regional
company
Ready meals, processed meat and seafood, spread, instant noodles, drinking milk products, juice, and RTD tea, and Asian specialty drinks
4. Mondelēz (M) Sales Sdn. Bhd.
Mondelēz 4.0 Global
company
Biscuits, confectionery, savoury drinks, and cheese
5. Etika Group of Companies
Etika Group 3.7 Global company
Other dairy, carbonates, juice, RTD coffee, RTD tea, and sports and energy drinks
6. Campbell Soup SEA Sdn. Bhd.
Campbell’s Soup
3.4 Global
company
Biscuits, and soup
7. Malaysia Milk Sdn. Bhd. Malaysia Milk 3.3 Regional company
Drinking milk products, yoghurt products, other dairy, juice, and RTD tea
8. Unilever (M) Holdings Sdn. Bhd.
Unilever 3.2 Global
company
Ice-cream, ready meals, soup, and spread
9. Coca-Cola Malaysia Coca-Cola 3.1 Global
company
Carbonates, juice, and RTD tea
10. Fonterra Brands (M) Sdn. Bhd.
Fonterra 2.2 Global
company
Cheese, drinking milk products, yoghurt products, and other dairy
11. Kellogg Asia Marketing Inc.
Kellogg’s 2.2 Global company
Savoury snacks and RTE cereal
12. Barkath Co-Ro Mfg Sdn. Bhd.
Barkath Co-Ro
1.6 Global
company
Concentrates
13. Dutch Lady Milk Industries Bhd.
Dutch Lady 1.5 Global
company†
Drinking milk products and yoghurt products
14. Mamee-Double Decker (M) Sdn. Bhd.
Mamee 1.4 National
company
Savoury snacks, instant noodles, and yoghurt products
15. Gardenia Bakery KL Sdn. Bhd.
Gardenia 1.2 Regional
company
Baked goods and spread
16. Hup Seng Perusahaan Makanan (M) Sdn. Bhd.
Hup Seng 0.8 National
company†
Biscuits and savoury snacks
17. Munchy Food Industries Sdn. Bhd.
Munchy’s 0.8 National company
Biscuits and savoury snacks
18. Ferrero SpA Ferrero 0.6 Global
company
Confectionery and spread
19. Clouet & Co (KL) Sdn. Bhd.
Ayam Brand
0.6 Global
company
Processed meat and seafood, and juice
20. The Italian Baker Sdn. Bhd.
Massimo 0.6 National
company
Baked goods
21. Ayamas Food Corp Sdn. Bhd.
Ayamas 0.3 National
company
Processed meat and seafood
22. Ramly Food Processing Sdn. Bhd.
Ramly 0.3 National
company
Processed meat and seafood
Quick service restaurant sector (total market share = 79.1%)
23. QSR Stores Sdn. Bhd. (Pizza Hut)
Pizza Hut 26.3 Global
company
Pizza consumer foodservice
24. QSR Stores Sdn. Bhd. (KFC)
KFC 21.0 Global
company
Fast food
25. Dommal Food Services Sdn. Bhd. (Domino’s)
Domino’s 15.8 Global company
These finalised evidence documents underwent the re-view process as outlined in Stage II.
Stage II: Assessment and Review of Recommendations
a. BIA-Obesity Malaysia Expert Panel
A panel of experts (Expert Panel) was established to perform the assessment of company commitments as per the BIA-Obesity scoring protocol. Selection criteria for experts included area of expertise (e.g. public health, nutrition policy), absence of any self-declared conflict of interest (i.e. no formal collaborations with food and bev-erage companies) and no involvement in similar studies. The invited Expert Panel represented government, non-government organisations (NGO) and academia (local and international).
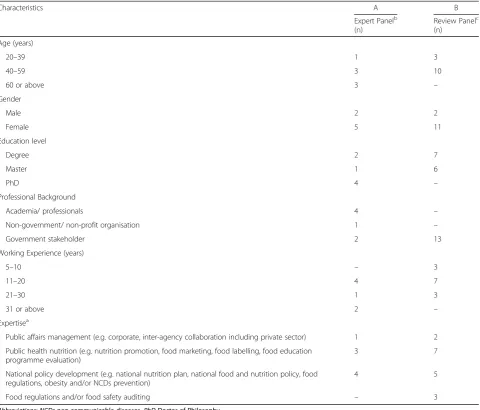
Eight of ten invited experts consented to join the Ex-pert Panel and one exEx-pert with a declared conflict of interest was subsequently rejected. The composition of the Expert Panel (n = 7) is described in Table 2A. The members had more than 10 years’ experience in their
field and were from academia (n= 4), government (n= 2) and an NGO (n = 1). Their combined expertise cov-ered public health nutrition (n = 3), national nutrition policy development (n = 4), and public affairs manage-ment (n = 1). Prior to the assessmanage-ment, each member signed a non-disclosure form and agreed to fulfil all con-fidentiality obligations.
b. Pilot testing and tool calibration
As part of the iterative process of adapting the BIA-Obesity tool to the Malaysian context, pilot testing of the assessment criteria was conducted by two experts. Based on the pilot assessments of one company, the scoring scheme was revised before proceeding with a training session for all Expert Panel members to further calibrate the tool. In this process, the scoring scheme was further revised, for example, to include results of the market survey and to add theHealthier Choice Logo
as a criterion for assessment of product healthiness.
c. Assessment of each company
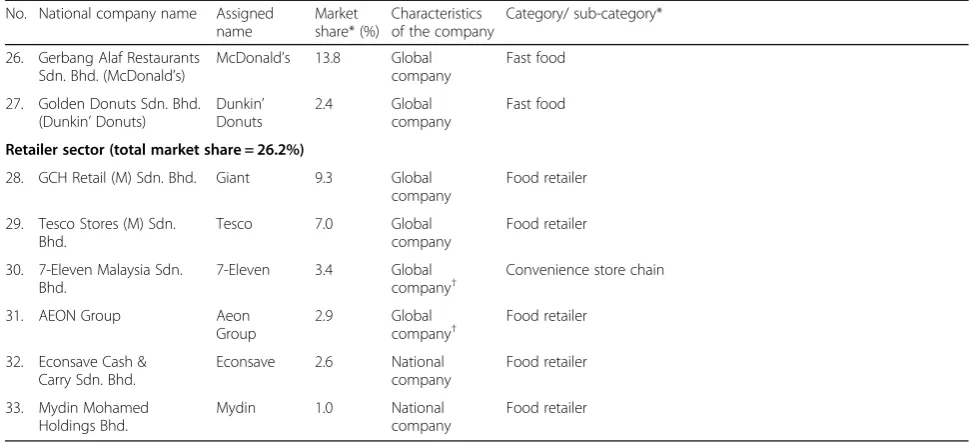
Table 1Characteristics of the selected companies (n= 33) across sectors(Continued)
No. National company name Assigned name
Market share* (%)
Characteristics of the company
Category/ sub-category*
26. Gerbang Alaf Restaurants Sdn. Bhd. (McDonald’s)
McDonald’s 13.8 Global company
Fast food
27. Golden Donuts Sdn. Bhd. (Dunkin’Donuts)
Dunkin’ Donuts
2.4 Global
company
Fast food
Retailer sector (total market share = 26.2%)
28. GCH Retail (M) Sdn. Bhd. Giant 9.3 Global company
Food retailer
29. Tesco Stores (M) Sdn. Bhd.
Tesco 7.0 Global
company
Food retailer
30. 7-Eleven Malaysia Sdn. Bhd.
7-Eleven 3.4 Global
company†
Convenience store chain
31. AEON Group Aeon
Group
2.9 Global
company†
Food retailer
32. Econsave Cash & Carry Sdn. Bhd.
Econsave 2.6 National
company
Food retailer
33. Mydin Mohamed Holdings Bhd.
Mydin 1.0 National
company
Food retailer
Abbreviations:RTDready-to-drink,RTEready-to-eat
*Market share was extracted from Euromonitor Passport datasets Year 2016 [34–38] as per the retail selling price values of investigated category/ sub-category
†At least one subsidiary publicly listed company in the Malaysian stock market [39]
Notes
1. Definitions of the characteristics of the company
a. A global company is defined as providing goods or service worldwide across regions with its headquarters or parent company located outside Malaysia b. A regional company may be a food and/or beverage business operating within the South-East Asian (SEA) region with its headquarters or parent company located outside Malaysia but within any of the SEA countries
c. A national company is denoted as a company mainly distributing its goods or services within Malaysia and its headquarters or parent company located in Malaysia
2. Etika Group of Companies included Etika Beverages Sdn. Bhd. (manufacturer for soft drinks) and Etika Dairies Sdn. Bhd. (manufacturer of other dairy namely condensed or evaporated milk)
Within a 4-month period, a minimum of five mem-bers of the Expert Panel completed scoring of all companies using the BIA-Obesity Malaysia tool. Com-munications via emails and video conferencing maxi-mised discussion between the researchers and Expert Panel. Each member scored the evidence independ-ently. Upon consolidating the Expert Panel scores, outliers (i.e. weighted overall score > 1.5 times of the interquartile range) were returned to relevant ex-pert(s) for re-consideration.
The final score for each indicator was determined based on a‘simple majority rule’such as at least 4 out of
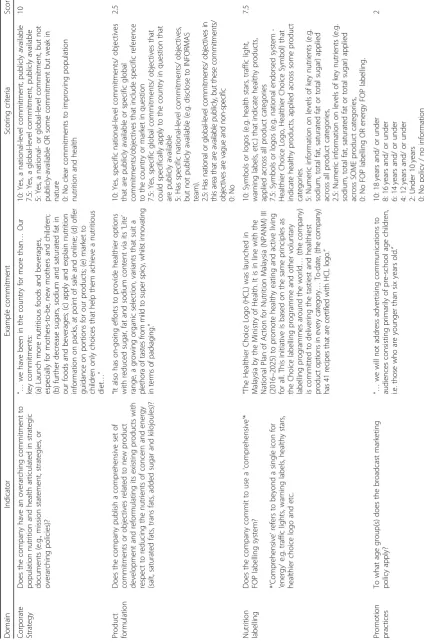
6 members in the Expert Panel casting the same score. In the event that a ‘simple majority rule’ could not be reached (e.g. where the same number of experts allo-cated scores to two different values), an additional aca-demic referee was called in to make the final decision. Baharad et al. [41] indicated that ‘simple majority rule’ was common to organisations in making decisions and adding another voter would be preferred to removing an existing competent voter to reach consensus. Table 3 shows examples of publicly available commitments using illustrative quotes, scoring criteria, and their correspond-ing scorcorrespond-ings, by domain.
Table 2Sociodemographic data of panels as part of BIA-Obesity Malaysia process of assessment
Characteristics A B
Expert Panelb (n)
Review Panelc (n)
Age (years)
20–39 1 3
40–59 3 10
60 or above 3 –
Gender
Male 2 2
Female 5 11
Education level
Degree 2 7
Master 1 6
PhD 4 –
Professional Background
Academia/ professionals 4 –
Non-government/ non-profit organisation 1 –
Government stakeholder 2 13
Working Experience (years)
5–10 – 3
11–20 4 7
21–30 1 3
31 or above 2 –
Expertisea
Public affairs management (e.g. corporate, inter-agency collaboration including private sector) 1 2
Public health nutrition (e.g. nutrition promotion, food marketing, food labelling, food education programme evaluation)
3 7
National policy development (e.g. national nutrition plan, national food and nutrition policy, food regulations, obesity and/or NCDs prevention)
4 5
Food regulations and/or food safety auditing – 3
Abbreviations:NCDsnon-communicable diseases,PhDDoctor of Philosophy
Notes:
a
More than one field of expertise may be stated by the Expert or Review Panel.
b
Seven members of the Expert Panel (including an academic who refereed whenever the 'simple majority rule' failed) performed the assessment.
c
d. Review of recommendations
The research team developed preliminary recom-mendations for each company based on Expert Panel assessment of their policies. A Review Panel was established to review and harmonise these recommen-dations to ensure that these were consistent with national policies, government directions and inter-national standards, as well as achievable under the local conditions. The Review Panel included the Ex-pert Panel members, with additional government stakeholders. Selection criteria for these government stakeholders included regular engagement with food industry on policy implementation matters related to food reformulation, labelling, promotion and/or acces-sibility, absence of any self-declared conflict of inter-est, and consenting to attend a discussion.
Hence, in addition to the Expert Panel members, 13 government stakeholders were included on the Review Panel tasked with reviewing the recommendations. Of note, government stakeholders all had a minimum 5 years of working experience with combined expertise of inter-agency collaboration with the private sector (n = 2), food regulation and/or food safety auditing (n = 3), nutrition policy planning specific to obesity and/or NCD prevention (n= 5), and/or public health nutrition (n= 7) (Table2B).
Stage III: Findings Finalisation
Preliminary scorecards were disseminated to the com-panies for verification, within a two-week period (see Additional file 5). Comments received from companies were addressed by minor amendments to stated key strengths and company-specific recommendations. All companies were invited to attend a closed-door meeting, held a month later, where overall findings of BIA-Obesity Malaysia were presented. Fifteen companies attended the meeting. The full technical report was pub-licly disseminated at a later date.
Data analysis
Intraclass correlation coefficient (ICC) of the Expert Panel were determined using two-way random model and absolute agreement type across all the indicators as per company assessed. Agreement test of assessed indi-cators reaching ‘simple majority rule’ was calculated.
Kruskal Wallis testing further examined the weighted score differences between the Expert Panel members, by domains and overall weighted scores. Differences in overall weighted scores were compared between partici-pating and non-participartici-pating companies, and according to characteristics of companies (e.g. global vs regional and national companies, and listed vs non-listed
companies in the Malaysian stock market [39]) using Mann-Whitney tests. For this study’s purpose, a global company is defined as one that provides goods or service worldwide across regions with its headquarters or parent company located outside Malaysia. Whereas, a regional company may be a food and/or beverage business oper-ating within the South-East Asian (SEA) region with its headquarters or parent company located outside Malaysia but within any of the SEA countries. In con-trast, a national company is denoted as a company mainly distributing its goods or services within Malaysia and its headquarters or parent company located in Malaysia. Finally, the association of market shares and overall weighted scores were tested using Spearman rank coefficient. IBM SPSS version 21.0 (SPSS Statistics Inc., Chicago IL, USA) was used to perform these analyses, with p< 0.05 set as the threshold for statistical significance.
Results
Six out of 33 companies agreed to participate in the BIA-Obesity assessment process. Twenty-four compan-ies declined to participate, while three did not respond. Some declined companies provided reasons for non-participation such as resource limitations (n= 2), lack of priority as perceived by senior management (n= 3), lack of local staff with relevant skills (e.g. nutritionist) to help with evidence collection (n = 2), tight schedules (n = 3), restriction in the company policy for public disclosure (n= 1), and scepticism regarding the assessment (n = 2).
Consistency between Expert Panel Scorings
In terms of consensus between the Expert Panel mem-bers, the ICC for 33 companies ranged from 0.83 (95%CI 0.75, 0.89) to 0.99 (95%CI 0.98, 0.99). The agree-ment test of assessed indicators reaching‘simple major-ity rule’ was 94.2% (i.e. 1787 out of 1897 applicable indicators assessed). There was no significant difference in weighted scores by domain between the Expert Panel for all assessed companies (p> 0.05).
Overall weighted score
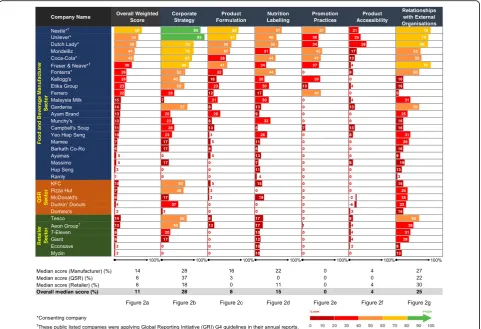
The overall weighted score for companies varied from 1% (Ramly) to 60% (Nestlé) (Fig. 2a). The overall me-dian score was 11% across food industry sectors, but individual sector comparisons indicated that the me-dian score for food and beverage manufacturers (14%) was greater than that of QSR and retailer sectors (both recorded as 6%).
The median score of participating companies was signifi-cantly higher compared with non-participating compan-ies (45.1% vs 6.9%;U = 3.0; p< 0.001). Global companies scored significantly higher, compared with regional and national companies (13.0% vs 5.8%;U= 70.0;p= 0.036).
The following sections describe domain-specific scor-ings expressed as percent of the total number of points, and the recommendations across sectors. As some indi-cators were not applicable for some industry companies (e.g. setting a trans-fat target was not applicable to bev-erage companies), the number of eligible companies var-ied per indicator.
The recommendations were developed based on collated constructive opinions of the Review Panel, which were generated from discussions on scorings for indicators and consideration of other research (e.g. BIA-Obesity Australia and New Zealand), WHO rec-ommendations, and/or national nutrition plans. The Review Panel also considered differences between food
companies global versus local commitments and disclo-sures (where relevant). Feasibility of recommendations in the Malaysian context, national norms and industry capability were also important considerations during the development of recommendations.
Corporate strategy
The overall median score (28%) was highest for the cor-porate strategy domain with scores ranging between 0 and 93% (Fig. 2b). Twenty-eight out of 33 companies had policies or statements that included population nu-trition and health as part of their business strategy. Companies with higher scores for this domain published their commitments aligning with international agendas (e.g. 2030 Agenda for SDGs, World Health Organiza-tions (WHO) recommendaOrganiza-tions) and/or national gov-ernment policies (e.g. NPANM III 2016–2025 or supportedHealthier Choice Logoprogramme). However, most (22/33) scored < 50% and this lower score was Fig. 2Overall weighted score (a) and percent of the total number of points by domain (b-g). Notes: 1. The negative scorings infwere deficit points after taking into consideration of the substantial evidence that the assessed company strongly opposed unhealthy food tax. This was
assessed under the indicator– “Does the company’s policy position on fiscal policies to make healthier foods relatively more expensive, as
articulated in theWHO Global Action Plan for NCDsand theReport of the Commission on Ending Childhood Obesity, Recommendations 1.2”. 2. The
Expert Panel considered two non-participating companies (Etika Group and McDonald’s) showing no explicit evidence published between 2014
and 2017 for the implementation of theMalaysia Pledge. The cited comments were low transparency in reporting, no publicly available individual
attributed to weak commitments that were non-specific to the Malaysian context, coupled with irregular reporting.
Key recommendations were to (1) refer national and international recommendations (e.g. NPANM III 2016– 2025, WHO Global NCD Action Plan, SDGs, etc.) when formulating targets and plans; (2) link targets to Key Performance Indicators of senior managers; and (3) re-port the progress at national level and on a regular basis. Whenever possible, the Review Panel encouraged com-panies to employ nutritionists, dietitians or equivalent professionals in their business. They also observed the low levels of engagement with the QSR sector with re-spect to implementation of nutrition policies in the past. Accordingly, the Review Panel called for greater engage-ment from food companies in regards to impleengage-mentation of government-led initiatives for improving population nutrition and health.
Product formulation
The overall median score for the product formulation domain was 8%, with individual scores ranging between 0 and 66% (Fig.2c). Many companies (24/33) committed to reformulation to some extent for at least one nutrient of concern such as sodium (8/26 eligible companies),
trans-fat (10/30), saturated fat (6/31), added sugars (13/ 33), or to reduce the energy content or portion size of their products (10/33). Twelve companies were partici-pating in national and/or global industry initiatives on reformulation (e.g.Healthier Choice Logoprogramme or other healthy eating initiatives), whereas no such initia-tives were observed in the QSR and retailer sectors. Commitments to product formulation included a lack of nutrient reduction targets, application to only select key products and non-specificity to the Malaysian market. In addition, a company’s self-determination on ‘healthier’ food product composition without external verification affected scores.
Recommendations included to (1) set SMART (spe-cific, measurable, achievable, relevant, and time-bound) national targets for product formulation and regularly report on them; (2) align the targets with Healthier Choice Logo and also consider the WHO nutrient profiling systems for all relevant categories. These rec-ommendations were also applicable to the suppliers or third-party manufacturers supplying products to the retailers.
Nutrition labelling
The overall median score for the nutrition labelling do-main was 15% with the highest score recorded as 57% (Fig. 2d). Most of the companies (30/33) disclosed mitments related to nutrition labelling with some com-panies scoring highest for publishing nutrition
information online (16/33) and displaying energy on FOP labelling (17/28). Approximately half of the com-panies included total/ added sugars (13/28) or trans-fat (13/24) content and usedHealthier Choice Logo or their own FOP formats (14/28) such as numeric information of key nutrients. Less than half of the companies com-mitted to the Malaysian Food Composition Database
programme (9/33), disclosed some commitments on using nutrition or health claims only for ‘healthy’ prod-ucts (5/28) or displayed QUIDs labelling (4/28) for their products. Within the QSR sector, nutrition information on request, such as pamphlets on trays or wall charts, was provided by some companies (2/5) but none dis-played nutrition information on the menu board. Four retailers participated in a government BeSS (Clean, Safe and Healthy) accreditation for food premises, which has a criterion for minimal calorie tagging on menu.
Key recommendations were to (1) provide comprehen-sive nutrition labelling online and on pack (e.g. sodium,
trans-fat, sugars) and QUIDs; (2) participate in government-led initiatives such asMalaysian Food Com-position Databaseand FOP labelling programmes; and (3) commit that only ‘healthier’ products (Healthier Choice Logo and/or WHO criteria) are permitted to carry nutri-tion claims. For QSR and retailer sectors, nutrinutri-tion infor-mation was recommended to be displayed using the same size fonts as for the price tags on the menu board for all takeaways or ready-to-eat foods prepared on site.
Promotion practices
The overall median score was zero, with only one-third of companies (11/33) having published some commit-ments to restrict unhealthy food marketing (Fig. 2e). The limited commitments were to restrict promotion in broadcast and non-broadcast media (10/33), primary schools (9/27) and secondary schools (2/27), limit the usage of celebrity endorsements (7/33), fantasy and ani-mation characters (6/33) and premium offers (5/33), and to undertake policy compliance audits (6/33). Most of the companies with commitments in this area were sig-natories to theMalaysia Pledgeand/or other global mar-keting pledges or policies.
schools including the provision of branded certificates and vouchers.
Product accessibility
Most companies (21/33) disclosed some commitments on food accessibility but the overall median score was 4% (Fig. 2f). Companies reported commitments to in-crease availability of some ‘healthier’ products (15/28) and their availability at specific settings (3/28), and gen-eral commitments to improve product affordability (10/ 33). Three companies provided negative statements on taxation as a means to curb intake of unhealthy food products. Lower scores related to the use of “gimmicks through promotional campaigns”(e.g. Buy 1 Free 1) that aimed to drive sales rather than addressing product ac-cessibility, were observed in this study. The QSR sector provided little evidence that they were committed to healthier product accessibility. In some cases, these com-panies offered mineral water as a value deal or provided ‘healthier’ options on request such as sweetcorn and/or mineral water, with the latter provision incurring add-itional charges for children’s combination meals.
Recommendations covered the introduction of policies to (1) apply affordable and sustainable pricing (i.e. not short-term ‘price off’ marketing practices) for healthier products compared to non-core products, (2) increase availability through placement strategies of ‘healthier’ products defined by the WHO nutrient profiling systems [42, 43], and (3) support the WHO’s position on fiscal policies [13, 14]. The QSR sector was recommended to (1) introduce ‘healthier’ choices in children and adult combination meals, such as a free water by default or the provision of mineral water, fresh fruits, and vegetable options at no extra charges, and (2) commit to not open-ing new stores within 500 m of schools.
Relationships with external organisations
All companies reported at least one type of relationship with external organisations (Fig. 2g) with scores for this domain ranging between 3 and 75%. The CSR activities included funding or in-kind support provided to re-search (6/30), professional organisations (12/31), nutri-tion educanutri-tion (12/31) and active lifestyle programmes (20/33), public-private partnerships (15/33), and philan-thropic activities (29/33). Some companies explicitly dis-closed their position to restrict political donations (9/ 33). No company made a specific commitment to con-duct CSR activities independent of brand, logo or com-pany promotions.
Evidence revealed that companies often reported rela-tionships with external organisations in a non-consolidated manner and/or not specific to the Malay-sian market. Therefore, key recommendations included to (1) publicly disclose all national CSR activities in a
regular and consolidated manner, and (2) avoid com-mercial branding and product promotion in their nutri-tion and healthy lifestyle programmes.
Discussion
This was the first BIA-Obesity study to assess the nutri-tion commitments and disclosure practices of major food companies in Asia. In terms of overall scorings for the 33 companies, less than a quarter scored more than 25% (overall median score = 11.0%). Commitments and disclosures of companies in Malaysia were evaluated across six domains of the BIA-Obesity, providing overall median scores for domains ranging between 0 and 28%. Companies performed the worst for commitments re-lated to product formulation, product accessibility, and promotion practices domains (all < 10%). Commitments were often non-specific to the Malaysian market and vague. Across the domains, lower scores were noted re-lated to self-determination of ‘healthy’products without external verification (e.g. the products that were deemed sufficiently‘healthy’to be marketed to children).
The weak nature of food company commitments and disclosures, as discussed above, has also been encoun-tered in other studies. For instance, Cetthakrikul et al. [44] reported food companies in Thailand lacked suffi-cient specificity and often did not provide detailed cri-teria in food marketing to children, nutrition and health claims, and food accessibility. A review of commitments and disclosures of companies in 30 countries [33] also revealed wide variations in country specific policies of transnational chain restaurants regarding improving healthfulness of their menus, as well as time commit-ments to executing these targets. Lack of disclosures and uncertain application of global commitments within Malaysia were identified as issues for most of the global and regional companies. As explained by the ATNF [26], nutrition activities of such companies as reported in their global reports mainly applied to major markets, which might exclude smaller countries such as Malaysia.
similar scores in both countries. Sacks et al. [45] sug-gested that variation of policies within a company for different markets may reflect the different country con-texts, including different regulatory pressures, and differ-ent consumer demand patterns, but the particular drivers of these variations warrant further exploration.
The Global Reporting Initiative(GRI) Standards serve as a guide to companies to practise sustainability report-ing to align their corporate position in relation to SDG target 12.6. Publicly listed companies in the Malaysian stock market were more likely than non-listed compan-ies to fulfil GRI as detected by this study, and most of these companies were in line with Malaysia’s NPANM III 2016–2025, the global WHO’s recommendations and/or SDGs. These companies also were participating in Malaysian government-led initiatives such as Health-ier Choice Logo, BeSS (Clean, Safe and Healthy), and/or
Malaysian Food Composition Database programmes. Additionally, two out of three companies were signator-ies to theMalaysia Pledge, practised an internal market-ing policy with compliance audits, and published CSR activities including a policy to restrict political dona-tions. Such activities complement some indicators in-cluded in the Sustainability Reporting Guide (SRG) recommended by the Bursa Malaysia [46], which is adapted from GRI. Thus, sustainability reporting would likely encourage the inclusion of population nutrition and health strategies into the business model as evi-denced by GRI or SRG compliant companies. This study highlights the need for the government to consider regu-latory changes to integrate recommendations for areas evaluated by BIA-Obesity Malaysia. This could lead to a nationally endorsed sustainability reporting system re-lated to population nutrition for food and non-alcoholic beverage companies. Furthermore, formulating appropri-ate fiscal policies (e.g. taxation rebappropri-ates or incentives) would encourage sustainability reporting and increase transparency in businesses.
Transparency is a key element of accountability [47]. This element was central to recommendations made across most BIA-Obesity domains, which emphasised the importance of public disclosures of company com-mitments and/or regular reporting for population nutri-tion and health. Participating companies in our study who provided more evidence for the BIA-Obesity assess-ment were also more likely to make public their policy information and this concurred with findings from simi-lar studies in New Zealand, Australia, and Canada [28, 31, 32]. These may indicate preparedness for evidence compilation and global company policies tuned towards population nutrition and health. They also may have a greater tendency to publicise related commitments be-cause of global pressure for public-private partnerships to tackle obesity and NCDs prevention [44].
The observed low levels of commitment from com-panies towards population nutrition puts into question the effectiveness of food industry self-regulation in this area. Moreover, we note that a preference for voluntary industry initiatives in the area of nutrition have been identified as a key strategy used by the food industry as part of efforts to influence public policy in their favour [48]. This ‘policy substitution’ strategy is often coupled with other corporate political activities, such as direct lobbying of government and constituency building activ-ities (including public-private partnerships), to weaken or delay public policy responses [49–51]. In light of well-documented corporate political activities, govern-ments are being urged to implement clear, transparent, and robust guidelines on conflicts of interest and pro-cesses to mitigate industry influence on public policy de-velopment [23]. Conflict of interest management processes need not completely exclude engagement with industry, particularly as part of policy implementation, but the risks associated with such engagement need to be closely managed. In addition, there is a need for government-led monitoring and evaluation to determine the effectiveness of industry self-regulation on food en-vironment policies.
Varying approaches to nutrition labelling by compan-ies, particularly FOP labelling, were observed in this study. Draper et al. [52] warned that multiple FOP label-ling formats in a market would likely limit consumer un-derstanding and lower usage. Relatedly, public health advocates have proposed the application of consistent FOP labelling on all products to improve consumer food choices [53]. Specific to the Healthier Choice Logo
programme in Malaysia, its use was viewed as conflicting with stronger FOP labelling implementation [54]. A case in point at the time of this study is theHealthier Choice Logo criteria were limited to selected foods within categories [55] such as cereals which excluded bread but included instant noodles [55] which is viewed as an ultra-processed food [56].
recommendation of the Review Panel, which was also echoed in an earlier study that called for stronger government-led actions in Malaysia [59].
In the area of product accessibility, a key recommen-dation from this study emphasised a need for pricing practices that would make healthier products more af-fordable to the bottom and middle income household groups in Malaysia through sustained lower prices, with less focus on temporary price promotions. A need was also identified for the food retail and manufacturer sec-tors to improve the placement of healthier products to facilitate easier identification by consumers. The pro-posed tax incentives for healthier foods as recommended in the NPANM III 2016–2025 [16] may provide incen-tives for the food industry to shift to the ‘health viable profit’model, as mooted by Swinburn et al. [23].
In the context of CSR activities, strong branding or product promotion was observed in Malaysia. Since 2007, CSR has been mandatory for companies listed on the Malaysian stock market, with tax incentives for im-plementation. However, opinion is that most businesses favoured CSR activities linked to philanthropy, rather than population health [46]. Besides, we found little evi-dence on the effectiveness of reported CSR targeting population health. Kraak et al. [50] indicated that the major challenge in public-private partnerships is to man-age conflicts of interest and only allow healthier prod-ucts for brand-use activities. Therefore, a stricter recommendation was proposed for healthy lifestyle and nutrition programmes to be free from companies’ prod-ucts and/or brands.
The BIA-Obesity tool assessed the strength of profiling systems used by companies for the purposes of food formulation, labelling, marketing to children, and acces-sibility. In this study, WHO nutrient profiling systems
[42, 43] were used as the benchmarks for assessing the healthiness of relevant product portfolios of companies. Recommendations generated by the Review Panel for relevant domains also referred to these profiling systems. The WHO systems enable a country model to consider the regulation of taxation, labelling, and guidelines for healthy food provision in public food service settings [14]. Adoption of the WHO systems would ensure a consistent approach to determining nutrient limits for the classification of a ‘healthy’product across a range of policy domains [26, 60, 61]. For food companies in Malaysia, it will be important to align relevant policies with ‘reputable’ nutrient profiling systems, rather than generating custom-fit profiling to suit an individual company’s product range.
Through the BIA-Obesity Malaysia process, civil soci-ety provided critical assessment and valuable recommen-dations that focussed on public interests without commercial influence. This academic-led assessment of
companies provides strong evidence to the government on the lack of progress in relation to existing self-regulatory policy approaches, which should provide some impetus to shift towards mandatory policies. For the food industry, this study provides evidence of the limitations of existing commitments and disclosure prac-tices to improve related to population nutrition and dis-closure practices. A first step for companies would be to formulate SMART commitments and to improve public disclosure of such commitments. The results of this study can also be used by civil society advocates to in-crease uptake of the study’s recommendations.
This study had several methodological strengths. The tool used has been adapted from INFORMAS, which was earlier implemented in Australia [28–30], New Zea-land [31], and Canada [32]. The development process was independent from the food and beverage industry [27]. The tool was modified to suit the local context by taking account of local nutrition policies in the ment criteria to better reflect a country-specific assess-ment. The innovation of the process included the appointment of the Expert and Review Panels with bal-anced representation from the government, NGO and academic backgrounds. A positive characteristic of this study was the test agreement adopting the ‘simple ma-jority rule’ approach which recorded 94.2% agreement between the Expert Panel members. Dissemination of preliminary individual scorecards to companies and holding a closed-door meeting with industry prior to public release of the findings also ensured that the con-duct of the study through to the final stages, remained transparent and unbiased.
follow-up assessments may overcome this reservation to engage, as has been the experience of similar initiatives elsewhere [25, 26]. If more food companies participated in the BIA-Obesity process, even with the option of pro-viding information on a confidential basis, this is likely to improve the completeness of the evidence, instead of heavily relying on publicly available information. More-over, future periodic monitoring via BIA-Obesity may improve food company disclosure practices and thus the accuracy of publicly available information used in the assessment.
Conclusion and policy implications
This study provided an understanding and critical as-sessment of the Malaysian food industry’s current commitments to improving population nutrition, along with recommendations for change. The lack of efficacious self-regulation in food reformulation, label-ling, and marketing, brand-associated CSR activities, and the lack of a uniform credible nutrition profiling system implies that policy makers need to adopt mandatory regulations as part of efforts to create healthier food environments. Appropriate regulatory changes by the government with non-compliance con-sequences would foster greater adherence of the food industry to policies prioritising population nutrition and health. Furthermore, this study highlighted the need for greater transparency in food company reporting to strengthen accountability for improving population nutrition.
Supplementary information
Supplementary informationaccompanies this paper athttps://doi.org/10.
1186/s12992-020-00560-9.
Additional file 1 : Table S1.Domain Weightings by Sector. Weightings assigned for each domain according to manufacturer, quick service restaurant and retailer sectors.
Additional file 2 : Table S2.Indicators for BIA–Obesity Malaysia by Sector. Indicators adapted for BIA-Obesity Malaysia for each domain ac-cording to manufacturer, quick service restaurant and retailer sectors.
Additional file 3 : Table S3.Market Share of Companies by Food Category. Market share of selected companies by food category according to manufacturer, quick service restaurant and retailer sectors.
Additional file 4.Email Template for Industry Engagement. A sample of the email for industry engagement.
Additional file 5 : Table S4.Example of an Individual Scorecard. A preliminary scorecard [Ayamas Food Corporation Sdn. Bhd. - a selected
company] used in‘Stage III: Findings finalisation–Feedback of
preliminary findings to companies via email’..
Acknowledgements
The Economic Planning Unit, Prime Minister’s Department for providing
country clearance to conduct this research. The Federation of Malaysian Manufacturer provided the access to industry stakeholders.
Authors’contributions
Author names: SeeHoe Ng (SHN), Gary Sacks (GS), Bridget Kelly (BK), Heather Yeatman (HY), Ella Robinson (ER), Boyd Swinburn (BS), Stefanie Vandevijvere (SV), Karuthan Chinna (KC), Mohd Noor Ismail (MNI) & Tilakavati Karupaiah (TK). TK, BS, BK, and SHN designed the study. GS and KC contributed to methodological development for this study. SHN, TK and MNI were involved in the industry stakeholder engagement. SHN and TK performed data acquisition and consolidated the evidence. GS, SHN, ER, BK, and HY standardised the assessment protocol. SHN, KC, and SV contributed statistical analysis. All authors contributed to data interpretation. SHN and TK drafted the manuscript. The authors read and approved the final manuscript.
Funding
This study was funded by the International Development Research Centre
(IDRC), Canada (Grant No. 108176–001), a crown corporation under the
Canada’s government. In-kind contributions were supported by the School
of Healthcare Sciences, Faculty of Health Sciences, Universiti Kebangsaan
Malaysia (UKM), Malaysia; Centre for Research Management, Taylor’s
Univer-sity, Malaysia; Early Start, School of Health and Society, Faculty of Social Sci-ences, University of Wollongong; the Australian Government for a Research Training Programme Scholarship awarded to SHN.
Availability of data and materials
The dataset will be available upon request to the corresponding author,
excepting an individual company’s confidential information bound by
non-disclosure clauses.
Ethics approval and consent to participate
The study has received ethics approvals from the Research Ethics Committee of the National University of Malaysia (UKM PP1/111/8/JEP-2016-394); and the Social Science Human Research Ethics Committee of the University of Wollongong (HE16/297).
Consent for publication Not applicable.
Competing interests
The authors declare that they have no conflicts of interest.
Author details
1Early Start, School of Health and Society, University of Wollongong,
Northfields Avenue, Wollongong, NSW 2522, Australia.2Global Obesity Centre (GLOBE), Deakin University, 221 Burwood Highway, Burwood, VIC 3125, Australia.3School of Population Health, University of Auckland, 2 Morrin Road, Auckland 1072, New Zealand.4School of Medicine, Faculty of Health and Medical Sciences, Taylor’s University, 47500 Subang Jaya, Selangor, Malaysia.5Faculty of Social Sciences and Leisure Management, Taylor’s University, 47500 Subang Jaya, Selangor, Malaysia.6Dietetics Programme, School of Healthcare Sciences, Faculty of Health Sciences, Universiti Kebangsaan Malaysia, 50300 Kuala Lumpur, Malaysia.7School of Biosciences, Faculty of Health and Medical Sciences, Taylor’s University, 47500 Subang Jaya, Selangor, Malaysia.
Received: 21 November 2019 Accepted: 23 March 2020
References
1. Ng M, Fleming T, Robinson M, Thomson B, Graetz N, Margono C, et al.
Global, regional, and national prevalence of overweight and obesity in
children and adults during 1980–2013: a systematic analysis for the global
burden of disease study 2013. Lancet. 2014;384:766–81.
2. Institute for Public Health. National Health and Morbidity Survey. 2015:
Non-communicable diseases, Risk Factors & Other Health Problems. Kuala Lumpur: National Institutes of Health, Ministry of Health; 2015.
3. World Health Organization (WHO). Noncommunicable diseases country
profiles 2018. Geneva: WHO; 2018.
4. Institute for Health Metrics and Evaluation (IHME). GBD Compare Data
Visualization [Malaysia]. 2018.http://vizhub.healthdata.org/gbd-compare.
5. Baker P, Kay A, Walls H. Trade and investment liberalization and Asia’s noncommunicable disease epidemic: a synthesis of data and existing literature. Glob Health. 2014;10:66.
6. Baker P, Friel S. Food systems transformations, ultra-processed food markets
and the nutrition transition in Asia. Glob Health. 2016;12:88.
7. Monteiro CA, Moubarac JC, Cannon G, Ng SW, Popkin B. Ultra-processed
products are becoming dominant in the global food system. Obes Rev.
2013;14(Suppl 2):21–8.
8. Vandevijvere S, Jaacks LM, Monteiro CA, Moubarac JC, Girling-Butcher M,
Lee AC, et al. Global trends in ultraprocessed food and drink product sales and their association with adult body mass index trajectories. Obes Rev.
2019;20(S2):10–19.
9. Department of Statistics Malaysia. Population distribution and basic
demographic characteristic report 2010 (updated: 05/08/2011). 2015. https://www.dosm.gov.my/v1/index.php?r=column/ctheme&menu_id= L0pheU43NWJwRWVSZklWdzQ4TlhUUT09&bul_id=MDMxdHZjWTk1 SjFzTzNkRXYzcVZjdz09#. Accessed 11 Sept 2019.
10. Karupaiah T, Chuah KA, Chinna K, Pressman P, Clemens RA, Hates AW, et al.
A cross-sectional study on the dietary pattern impact on cardiovascular disease biomarkers in Malaysia. Sci Rep. 2019;9:13666.
11. Buse K, Tanaka S, Hawkes S. Healthy people and healthy profits? Elaborating
a conceptual framework for governing the commercial determinants of non-communicable diseases and identifying options for reducing risk exposure. Glob Health. 2017;13:34.
12. Kickbusch I. Addressing the commercial determinants is critical to emerging
economies. Ciênc Saúde Colet. 2015;20(4):969.
13. World Health Organization (WHO). Global Action Plan for the Prevention
and Control of Noncommunicable Diseases 2013-2020. Geneva: WHO; 2013.
14. World Health Organization (WHO). Report of the Commission on Ending
Childhood Obesity: implementation plan. Seventieth World Health
Assembly A70/31, 27 March 2017. 2017.http://apps.who.int/gb/ebwha/pdf_
files/WHA70/A70_31-en.pdf. Accessed 11 Nov 2019.
15. Economic Planning Unit (EPU). Eleventh Malaysia Plan 2016–2020:
Anchoring Growth on People. Putrajaya: EPU, Prime Minister’s Department;
2015.
16. National Coordinating Committee on Food and Nutrition (NCCFN). The
National Plan of Action for Nutrition of Malaysia (NPANM III) 2016–2025.
Putrajaya: NCCFN, MOH; 2016.
17. Ministry of Health (MOH). National Strategic Plan for Non-communicable
Diseases (NSP-NCD) 2010-2014. Putrajaya: Non-Communicable Disease Section, Disease Control Division, MOH; 2010.
18. Ministry of Health (MOH). National Strategic Plan for Non-communicable
Disease (NSP-NCD) 2016-2025. Putrajaya: Public Health Department, MOH; 2016.
19. Federation of Malaysian Manufacturers (FMM). Malaysian Food and
Beverage Industry Commits to Combating Non-communicable Diseases
(NCDs). 2015.http://www.fmm.org.my/Press_Releases-@-Malaysian_Food_
and_Beverage_Industry_Commits_To_Combating_Non-Communicable_ Diseases_(NCDs)_in_Partnership_with_the_Government.aspx#. Accessed 8 Mar 2019.
20. Federation of Malaysian Manufacturers (FMM). FMM press release (7
November 2018): FMM MAFMAG Responses on 2019 Budget
Announcement 2018.http://www.fmm.org.my/Press_Releases-@-FMM_
Press_Release-;_FMM_MAFMAG_Responses_on_2019_Budget_ Announcement.aspx#. Accessed 8 Mar 2019.
21. Food Industry Asia (FIA). Malaysian Food and Beverage Industry’s
“Responsible Advertising to Children”Initiative (The Malaysia Pledge). 2013.
https://ifballiance.org/uploads/regional/MALAYSIA_PLEDGE_FINAL_.pdf. Accessed 14 Sept 2017.
22. Sacks G, Swinburn B, Kraak V, Downs S, Walker C, Barquera S, et al. A
proposed approach to monitor private sector policies and practices related to food environments, obesity and non-communicable disease prevention.
Obes Rev. 2013;14(Suppl 1):38–48.
23. Swinburn BA, Kraak VI, Allender S, Atkins VJ, Baker PI, Bogard JR, et al. The
global Syndemic of obesity, Undernutrition, and climate change: the lancet
commission report. Lancet. 2019;393:791–846.
24. World Health Organization (WHO). Time to Deliver: Report of the WHO
Independent High-Level Commission on Noncommunicable Diseases. Geneva: WHO; 2018.
25. Access to Nutrition Foundation (ATNF). Access to Nutrition Index–Global
Index 2013. Netherlands: ATNF; 2013.
26. Access to Nutrition Foundation (ATNF). Access to Nutrition Index–Global
Index 2018. Netherlands: ATNF; 2018.
27. Sacks G, Vanderlee V, Robinson E, Vandevijvere S, Cameron AJ, Mhurchu CN,
et al. BIA-obesity (business impact assessment–obesity and
population-level nutrition): a tool and process to assess food company policies and commitments related to obesity prevention and population nutrition at the
national level. Obes Rev. 2019;20(S2):78–89.
28. Sacks G. Robinson E for INFORMAS. Inside our food and beverage
manufacturers: assessment of company policies and commitments related to obesity prevention and nutrition, Australia 2018. Melbourne: Deakin University; 2018.
29. Sacks G. Robinson E for INFORMAS. Inside our quick service restaurants:
assessment of company policies and commitments related to obesity prevention and nutrition, Australia 2018. Melbourne: Deakin University; 2018.
30. Sacks G, Robinson E. Cameron a for INFORMAS. Inside our supermarkets:
assessment of company policies and commitments related to obesity prevention and nutrition, Australia 2018. Melbourne: Deakin University; 2018.
31. Kasture A, Vandevijvere S, Robinson E, Sacks G, Swinburn B.
Benchmarking the commitments related to population nutrition and obesity prevention of major food companies in New Zealand. Int J
Public Health. 2019;64:1147–57.
32. Vanderlee L, Verger L, Sacks G, Robinson E, L’Abbé M. Food and beverage
manufacturers in Canada: policies and commitments to improve the food environment. Toronto: The University of Toronto; 2019.
33. Kraak V, Patiño SRG, Renukuntla D, Kim E. Progress evaluation for
transnational restaurant chains to reformulate products and standardize portions to meet healthy dietary guidelines and reduce obesity and
non-communicable disease risks, 2000–2018: a scoping and systematic review to
inform policy. Int J Environ Res Public Health. 2019;16(2732):1–31.
34. Euromonitor International. Packaged Food: Brand Shares–Local Latest
Owner. [Passport Statistics - Data Type: Retail Value RSP, Malaysia]. 2017. https://www.portal.euromonitor.com/portal/magazine/homemain. Accessed 7 Oct 2017.
35. Euromonitor International. RTE Cereal, Instant Noodles, Cheese, Drinking
Milk Products, Yoghurt and Sour Milk Products and Other Dairy: Brand
Shares–Local Latest Owner. [Passport Statistics - Data Type: Retail Value
RSP, Malaysia]. 2017.https://www.portal.euromonitor.com/portal/magazine/
homemain. Accessed 7 Oct 2017.
36. Euromonitor International. Carbonates, Concentrates, Juice, RTD Coffee, RTD
Tea, Sports and Energy Drinks and Asian Speciality Drinks: Company Shares
–National–Latest Owner. [Passport Statistics - Data Type: Retail Value RSP,
Malaysia]. 2017.https://www.portal.euromonitor.com/portal/magazine/
homemain. Accessed 15 Aug 2017.
37. Euromonitor International. Fast Food and Pizza Consumer Foodservice:
Brand Shares–Local–Latest Owner. [Passport Statistics - Data Type:
Foodservice Value RSP, Malaysia].2017https://www.portal.euromonitor.com/
portal/magazine/homemain. Accessed 30 July 2017.
38. Euromonitor International. Grocery Retailers: Company Shares–National–
Latest Owner. [Passport Statistics - Data Type: Retail Value RSP exclude Sales
Tax, Malaysia]. 2017.https://www.portal.euromonitor.com/portal/magazine/
homemain. Accessed 15 Aug 2017.
39. Bursa Malaysia Berhad (Bursa Malaysia). List of Companies (Main Market).
2019.
http://www.bursamalaysia.com/market/listed-companies/list-of-companies/main-market. Accessed 13 Oct 2019.
40. Vandevijvere S, Kasture A, Sacks G, Robinson E, Mackay S, Swinburn B.
Committing to health: food company policies for healthier food environments. Company assessments and recommendations using the business impact assessment on obesity and population nutrition (BIA-obesity) tool. New Zealand: The University of Auckland; 2018.
41. Baharad E, Ben-Yashar R, Nitzan S. Variable competence and collective
performance: unanimity vs. simple majority rule. Tokyo: Hitotsubashi Institute for Advanced Study, Hitotsubashi University; 2018.
42. World Health Organization (WHO). WHO nutrient profile model for the
Western Pacific Region 2016: a tool to protect children from food marketing. Manila: WHO, Regional Office for the Western Pacific; 2016.
43. World Health Organization (WHO). WHO Nutrient Profile Model for
South-East Asia Region. New Delhi: WHO, Regional Office for South-South-East Asia; 2017.
44. Cetthakrikul N, Phulkerd S, Jaichuen N, Sacks G, Tangcharoensathien V.
45. Sacks G, Mialon M, Vandevijvere S, Trevena H, Snowdon W, Crino M, et al. Comparison of food industry policies and commitments on marketing to children and product (re)formulation in Australia, New Zealand and Fiji. Crit
Public Health. 2015;25(3):299–319.
46. Bursa Malaysia Securities Berhad (Bursa Malaysia). Sustainability Reporting
Guide. 2nd ed. Kuala Lumpur: Bursa Malaysia; 2018.
47. Swinburn B, Kraak V, Rutter H, Vandevijvere S, Lobstein T, Sacks G, et al.
Strengthening of accountability systems to create healthy food
environments and reduce global obesity. Lancet. 2015;385(9986):2534–45.
48. Mialon M, Swinburn B, Sacks G. A proposed approach to systematically
identify and monitor the corporate political activity of the food industry with respect to public health using publicly available information. Obes Rev.
2015;16(7):519–30.
49. Collin J, Hill SE, Eltanani MK, Plotnikova E, Ralston R, Smith KE. Can public
health reconcile profits and pandemics? An analysis of attitudes to commercial sector engagement in health policy and research. PLoS One. 2017;12(9):e0182612.
50. Kraak VI, Harrigan PB, Lawrence M, Harrison PJ, Jackson MA, Swinburn B.
Balancing the benefits and risks of public-private partnerships to address the global double burden of malnutrition. Public Health Nutr. 2011;15(3):
503–17.
51. Moodie R, Stuckler D, Monteiro C, Sheron N, Neal B, Thamarangsi T, et al.
Profits and pandemics: prevention of harmful effects of tobacco, alcohol,
and ultra-processed food and drink industries. Lancet. 2013;381:670–9.
52. Draper AK, Adamson AJ, Clegg S, Malam S, Rigg M, Duncan S. Front-of-pack
nutrition labelling: are multiple formats a problem for consumers? Eur J Pub
Health. 2011;23(3):517–21.
53. Kelly B, Jewell J. Health evidence network (HEN) synthesis report 61: what is
the evidence on the policy specifications, development processes and effectiveness of existing front-of-pack food labelling policies in the WHO European Region? WHO regional Office for Europe: Copenhagen; 2018.
54. Federation of Malaysian Consumers Associations (FOMCA). Malaysian
Consumers Wishlist for the 13thGeneral Election. Petaling Jaya: FOMCA;
2012.
55. Nutrition Division. Nutrient criteria Healthier Choice Logo (HCL) Malaysia.
2017.http://myhcl.moh.gov.my/assets/doc/nutrient_criteria.pdf. Accessed 15
Aug 2019.
56. Ministry of Health of Brazil. Dietary guidelines for the Brazilian population.
2nd ed; 2014.
https://www.foodpolitics.com/wp-content/uploads/Brazilian-Dietary-Guidelines-2014.pdf. Accessed 20 Sept 2019.
57. WHO Western Pacific Region. Biregional workshop on restricting the
Marketing of Foods and non-alcoholic Beverages to children in the Western
Pacific and South-East Asia. 2016.https://iris.wpro.who.int/bitstream/
handle/10665.1/13373/RS_2015_GE_61_MYS_eng.pdf. Accessed 16 Sept 2019.
58. United Nations Committee on the Rights of the Child (UNCRC). General
comment no. 15 (2013) on the right of the child to the enjoyment of the highest attainable standard of health (art. 24), 17 April 2013, CRC/C/GC/15.
2013.https://www.refworld.org/docid/51ef9e134.html. Accessed 7 Mar 2019.
59. Ng SH, Swinburn B, Kelly B, Vandevijvere S, Yeatman H, Ismail MN, et al.
Extent of implementation of food environment policies by the Malaysian government: gaps and priority recommendations. Public Health Nutr. 2018;
21(18):3395–406.
60. Wootan MG, Almy J, Ugalde M, Kaminski M. How do nutrition guidelines
compare for industry to market food and beverage products to children? World Health Organization nutrient profile standards versus the US
Children’s food and beverage advertising initiative. Child Obes. 2019;15(3):
194–9.
61. Sacks G, Rayner M, Stockley L, Scarborough P, Snowdon W, Swinburn B.
Applications of nutrient profiling: potential role in diet-related chronic disease prevention and the feasibility of a core nutrient-profiling system. Eur
J Clin Nutr. 2011;65:298–306.
Publisher’s Note