Reference‑free determination of tissue
absorption coefficient by modulation transfer
function characterization in spatial frequency
domain
Weiting Chen
1, Huijuan Zhao
1,2*, Tongxin Li
1, Panpan Yan
1, Kuanxin Zhao
1, Caixia Qi
1and Feng Gao
1,2*Abstract
Background: Spatial frequency domain (SFD) measurement allows rapid and non-contact wide-field imaging of the tissue optical properties, thus has become a poten-tial tool for assessing physiological parameters and therapeutic responses during photodynamic therapy of skin diseases. The conventional SFD measurement requires a reference measurement within the same experimental scenario as that for a test one to calibrate mismatch between the real measurements and the model predictions. Due to the individual physical and geometrical differences among different tissues, organs and patients, an ideal reference measurement might be unavailable in clinical trials. To address this problem, we present a reference-free SFD determination of absorption coefficient that is based on the modulation transfer function (MTF) characterization. Methods: Instead of the absolute amplitude that is used in the conventional SFD approaches, we herein employ the MTF to characterize the propagation of the modulated lights in tissues. With such a dimensionless relative quantity, the measure-ments can be naturally corresponded to the model predictions without calibrating the illumination intensity. By constructing a three-dimensional database that portrays the MTF as a function of the optical properties (both the absorption coefficient μa and the reduced scattering coefficient µ′s) and the spatial frequency, a look-up table approach or a least-square curve-fitting method is readily applied to recover the absorption coef-ficient from a single frequency or multiple frequencies, respectively.
Results: Simulation studies have verified the feasibility of the proposed reference-free method and evaluated its accuracy in the absorption recovery. Experimental valida-tions have been performed on homogeneous tissue-mimicking phantoms with μa ranging from 0.01 to 0.07 mm−1 and
µ′s= 1.0 or 2.0 mm−1. The results have shown maximum errors of 4.86 and 7% for µ′s= 1.0 mm−1 and µ′s= 2.0 mm−1, respectively. We have also presented quantitative ex vivo imaging of human lung cancer in a subcu-taneous xenograft mouse model for further validation, and observed high absorption contrast in the tumor region.
Conclusions: The proposed method can be applied to the rapid and accurate determination of the absorption coefficient, and better yet, in a reference-free way. We believe this reference-free strategy will facilitate the clinical translation of the SFD
Open Access
© The Author(s) 2017. This article is distributed under the terms of the Creative Commons Attribution 4.0 International License (http://creativecommons.org/licenses/by/4.0/), which permits unrestricted use, distribution, and reproduction in any medium, provided you give appropriate credit to the original author(s) and the source, provide a link to the Creative Commons license, and indicate if changes were made. The Creative Commons Public Domain Dedication waiver ( http://creativecommons.org/publicdo-main/zero/1.0/) applies to the data made available in this article, unless otherwise stated.
RESEARCH
*Correspondence: [email protected]; [email protected]
1 College of Precision
Instrument and Optoelectronics Engineering, Tianjin University, Tianjin 300072, China
measurement to achieve enhanced intraoperative hemodynamic monitoring and personalized treatment planning in photodynamic therapy.
Keywords: Determination of absorption coefficient, Spatial frequency domain measurement, Modulation transfer function, Reference-free measurement
Background
Recently, the spatial frequency domain (SFD) measurement has attracted increasing interests since it allows rapid and non-contact wide-field imaging of tissue optical prop-erties [1–5]. Compared to the traditional near-infrared imaging modalities in epi-illumi-nation mode, the emerging modality features scan-free wide-field illumiepi-illumi-nation together with mesoscopic-scale detection, all benefiting from the implementation of the spatial modulated excitation. The advantages of the SFD mode lend itself well suited for imag-ing skin tissues durimag-ing photodynamic therapy [6–10]. Specifically, by measuring the tissue absorption coefficients at two or more wavelengths, quantitative mapping of the concentrations of the tissue chromophores (dominant by oxy- and deoxy-hemoglobins in the near-infrared window ~600–900 nm) is achieved [11–13], and thus hemodynamic and oxygenation status as well as vascular distribution for disease diagnosing, staging and therapeutic response assessment are obtained.
In 1998, Dognitz and Wagnières reported the first use of the SFD method for measur-ing the tissue optical properties [14]. A wide-field light source modulated with radially-varying square wave was employed and both the diffuse reflectivity and the modulation depth of the backscattering light were used to recover the optical properties at a single point in space. In 2005, Cuccia et al. proposed a single-frequency sinusoidal modulation based imaging, where images of the direct current (DC) and alternating current (AC) components of the modulated reflectance were simultaneously extracted using a phase-shifting demodulation technique, and pixel-by-pixel recovery of the optical properties was achieved from joint use of the AC and DC amplitudes [2, 15]. This approach has been a mainstream technique for SFD imaging. Since then, further studies on improved techniques such as the fast demodulation and depth-resolved recovery, etc., as well as clinical applications, have been comprehensively reported [16–23].
Nevertheless, to our knowledge, all the reported SFD methods require a reference measurement to calibrate the mismatch between the absolute intensity and the model predictions of the diffuse reflectance. According to the explanations in Ref. 15 (Eqs. (22) and (23)), a reference phantom with the known optical properties must be measured within the same experimental setup and physical condition as those for the test one. In practice, this consistency can be individually affected by the net incident fluence, which is relevant to both the optical reflectivity and geometrical morphology of sample sur-face, as well as by the system modulation transfer function (MTF), which varies with the object-image distance at each spatial location [24–26]. Therefore, it is usually difficult to prepare a universal reference measurement in clinical trials.
SFD measurements to the model predictions without the intensity calibration. Through the establishment of a database that links the MTF to the tissue optical properties (both the absorption coefficient μa and the reduced scattering coefficient µ′s) and the
modula-tion frequency (ranges from 0.05 to 0.30 mm−1), the optical properties can be
theoreti-cally retrieved using the SFD measurement at one or more frequencies.
It is widely believed that separating the scattering from the absorption in SFD requires at least one high-frequency modulation (typically at the spatial frequency of f > 0.5 mm−1), with the high-frequency response dominant by scattering and the
low-frequency response dominant by both absorption and scattering [1, 4, 27]. However, due to the low-pass feature of high-scattering media such as tissues, intensity of the mod-ulated diffuse reflectance attenuates severely as the modulation frequency increases, leading to great difficulties and complexities in detecting high-frequency modulated reflectance. In addition, the MTF, as a relative measure, also lacks the constraints on the absolute amplitude of the frequency response, and thus can further aggravate the inverse coupling between the absorption and scattering as the modulation frequency is not high enough. In view of the fact, we assume in the remainder of this manuscript a priori knowledge of the reduced scattering coefficient, and focus on the absorption-only deter-mination. The practicability of the assumption have been justified in some of the clinical applications such as intraoperative monitoring of tissue oxygenation, where tracking the dynamic variations in oxygen metabolism is a primary concern and requires fast and convenient determination of absorption coefficient, while the scattering background is reasonably regarded as a constant and easy to pre-determinate using the space- or time-resolved spectroscopy [28, 29].
Methods
Modulation transfer function
We begin with assuming a linear optical medium illuminated by a spatially modulated light in the x-direction of the Cartesian coordinate system. The SFD expression of the modulated source fluence is given as S(f)=AS(0)δ(f)+AS(fx)δ(f −fx), with A(S0) and A(fx)S
being the amplitude of the DC component and the amplitude of the AC component at the modulation frequency fx, respectively. The modulated source light gives rise to a reflected diffuse photon fluence modulated at the same frequency, with its SFD expres-sion correspondingly given as R(f)=A(R0)δ(f)+A(Rfx)δ(f −fx), with AR(0) and A(Rfx) being the DC and AC amplitudes, respectively.
By definition, the medium MTF at the modulation frequency is experimentally calcu-lated as the ratio of the modulation depth in reflected fluence to that in the source, i.e.,
where MS and MR denote the modulation depths of the source and reflected fluence, respectively, i.e., MS(fx)=AS(fx)/A(S0) and MR(fx)=AR(fx)/A(R0).
In the real spatial domain, the spatial response of medium to excitation of a high-contrast line beam, RLSFd (x), is defined as the line spread function (LSF), and specified in the SFD by its one-dimension (1-D) Fourier transformation, referred to as the sys-tem transfer function (STF), i.e., H
fx
=−∝+∝RLSFd (x)exp
−j2πfxx
dx. The SFD-STF (1) MTF(fx)= MR
can be simply calculated as the ratio of the output AC amplitude to the input one, i.e.,
H(fx)=AR(fx)/A(fSx). Accordingly, Eq. (1) can be also given in the form of the SFD-STF
Note that although it is physically meaningless to define the MTF for the DC case, it converges to 1 as fx approaches to 0 in terms of Eq. (2). This implies that the MTF cal-culation can be extended to include the scenario of zero modulation frequency when necessary. Equation (2) is the basis for the following three-dimension (3-D) database construction.
Construction of 3‑D MTF database
In terms of Eq. (2), the MTF is essentially calculated as the normalized Fourier series expansion of the real spatial domain LSF. Therefore, the conventional photon propaga-tion models, such as the Monte Carlo (MC) simulapropaga-tion, radiative transfer equapropaga-tion and its approximations, can be applied to predicting the MTF through the LSF calculation. Based on the reported optical properties of human skin and subcutaneous tissue [30,
31], and meanwhile taking into account the sensitivity of the prototype SFD measur-ing system, we calculate in this study the MTF in the spatial frequency range of 0.05 to 0.30 mm−1, for μ
a ranging from 0.005 to 0.100 mm−1 at a step of 0.005 mm−1 and µ′s
ranging from 0.4 to 2.2 mm−1 at a step of 0.2 mm−1, while keeping a constant anisotropy
factor of g = 0.9. The MTF values for all combinations of the 20 absorption coefficients and the 10 reduced scattering coefficients are obtained by the following steps: Firstly, the spatially resolved diffuse reflectance of tissue for a single-point incidence RPSFd
x,y
, referred to as the point spread function (PSF), is predicted at a spatial resolution of 0.1 mm, using the steady-state MC simulation, with 108 photons injected [32]. Secondly,
the LSF
RLSFd (x)
is deduced from convoluting the PSF with the distribution function of a line source that extends infinitely in y-direction, simply achieved by binning (summing up) the 2-D response along the y-direction. Thirdly, the MTF is calculated according to Eq. (2) in the frequency range of 0.05–0.3 mm−1 at a step of 0.01 mm−1, by Fourier
trans-forming RPSFd (x). Since our MC simulations have demonstrated that the intensity of the diffuse reflectance at a site 50 mm far from the source is below the shot noise level for all the above combinations of μa and µ′s, the LSF calculation is truncated to a data length of
999 for the Fourier transform. In this way, a database of the MTF curves that correspond to the all 200 pairs of the optical properties can be established. Finally the linear interpo-lation procedure is applied to the MTF curves on a finer μa-grid, to enhance the resolu-tion of the μa-determination to 0.001 mm−1.
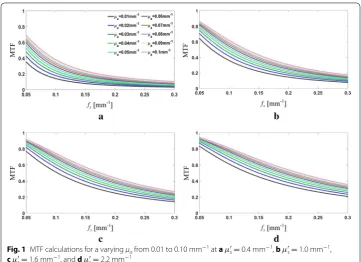
As examples, the MTF curves for varying μa are illustrated in Fig. 1, at four fixed µ′s
val-ues of 0.4, 1.0, 1.6 and 2.0 mm−1, respectively. The calculations manifest the low-pass
fil-tering effect of tissue on spatially modulated lights, where all the MTFs drop off with the increase in the spatial frequency but at a slowing-down slop as the scattering increases, and intuitively demonstrates the feasibility of using the MTF for the μa-determination. In addition, it is shown in Fig. 1 that the MTF curves shift up on whole with the increase in μa, indicating an increase in the modulation depth of the diffuse reflectance with the increase in μa, and thus inferring an more significant effect of μa on the DC attenuation
(2)
MTF(fx)= H (fx)
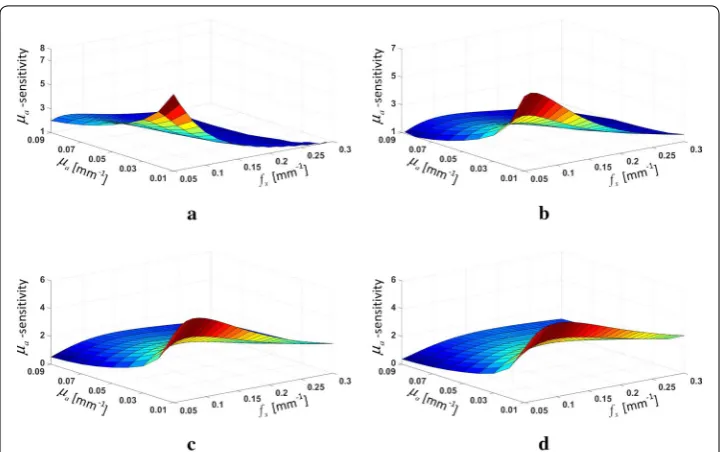
than the AC one. A further investigation, as shown in Fig. 2, analogously calculates the sensitivity of the MTF to the absorption coefficient (the μa-sensitivity), simply defined as the ratio of the MTF change to the absorption change, at the aforementioned set of µ′s.
It is shown that the μa-sensitivity trends to achieve a higher value at lower absorption, and decreases on whole with the maximum moving toward the direction of frequency increase as µ′s increases. This observations are implicitly in accordance with the past
findings that the low frequency component is more sensitive to variations in μa while the high frequency component is more sensitive to variations in µ′s , and could presage an
optimized selection of the working frequency according to the µ′s-range [1, 18, 27]. Inversion methods
As a priori µ′s is available, only one MTF measurement at a single frequency is sufficient
to determine μa from the established database simply by a look-up table method. To enhance the noise robustness, the inversion scheme can be generalized to the following least square optimization for multi-frequency measurements.
where MTFm
f(n)
x
and MTFµa,fx(n)
are the measured and model-predicted MTFs, respectively, with the latter rapidly calculated by interpolating the database; f(n)
x
(n=1, 2,. . .,N) is the n-th spatial frequency. Owing to the monotonic dependence
of the MTF on the absorption coefficient, the above minimization can be uniquely achieved when μa approaching to the true values. Obviously, by employing the multi-frequency optimization of the MTFs, the noise influence in the single measurement on
(3) min
µa
N
n=1
{MTFm[fx(n)] −MTF[µa,fx(n)]}2
Fig. 1 MTF calculations for a varying μa from 0.01 to 0.10 mm−1 at a µ′s= 0.4 mm−1, b µ′s= 1.0 mm−1, c µ′
the μa-determination can be greatly alleviated thanks to the averaging effect of the least-square fitting. While the multi-frequency optimization provides more robust determi-nation of μa than the look-up table method does, it is essential in practice to make a compromise between the determination accuracy and the measurement cost.
For homogeneous optical media, the diffuse reflectance will ideally maintain the mod-ulation frequency without spectrum broadening. In this case, a composited illumination of multi-frequency modulation patterns is employed and the MTFs at multiple frequen-cies are extracted from the single snapshot reflectance image using the Fourier fre-quency spectrum analysis, and determine the bulk μa using the least-square curve-fitting method. To reduce the truncation errors, the raw data is weighted by a Blackman win-dow function prior to the Fourier transform. The Blackman winwin-dow is widely believed to be excellent in estimating the amplitude-frequency characteristics but suffers from degraded spectral resolution. As a result, a minimal frequency spacing should be assured for reliably extracting the multiple frequency components from the raw data, according to the field of view (FOV) and the spatial resolution of the system.
For inhomogeneous optical medium, due to adverse effect of the frequency spectrum broadening of the diffuse reflectance on selection of the multiple modulation frequen-cies, a successive illumination of multi-frequency patterns is used to avoid the spectrum aliasing. To map the μa-distribution, the raw data successively measured at each fre-quency is then demodulated in a pixel-by-pixel fashion by employing the three-phase amplitude demodulation technique [2]
(4) A(fx)(xi)= 2
1/2
3 {[I1(xi)−I2(xi)] 2
+ [I2(xi)−I3(xi)]2+ [I3(xi)−I1(xi)]2}1/2
(5) A(0)(x
i)= 1
3[I1(xi)+I2(xi)+I3(xi)]
Fig. 2 The μa-sensitivity calculations at a µ′s= 0.4 mm−1, b µ′s= 1.0 mm−1, c µ′s= 1.6 mm−1, and d µ′
where xi is the position of the i-th pixel; I1, I2 and I3 are the measured reflectance images
at modulation frequency of fx with the phase offsets of 0, 2π/3 and 4π/3, respectively.
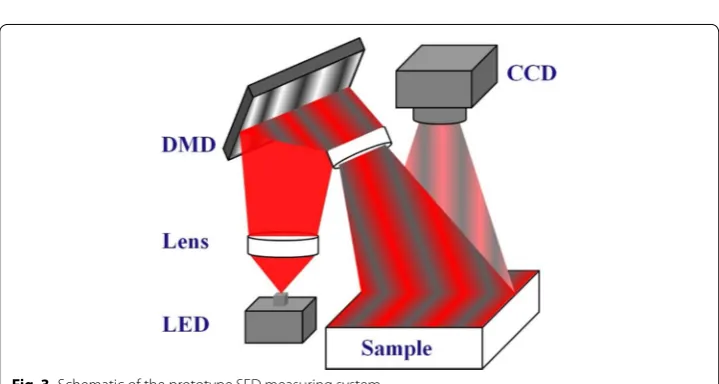
Prototype SFD system
The setup of the used prototype SFD measuring system is shown in Fig. 3. Light emit-ted from a light-emitting diode (LED) source at the wavelength of 660 nm (M660F1, Thorlabs, USA) is expanded and then coupled to a digital micromirror device (DMD) (LightCrafter 4500, Texas Instruments, USA) by a lens system. The spatial modulated patterns on the DMD are formed by assigning an 8-bit value (0–255) to each micromir-ror with customized control software. To reduce the specular reflection artifact, the spa-tially modulated light is projected onto a sample with a slight angle (≈3°) relative to the normal of the sample. Diffuse reflectance images of 51.2 mm × 51.2 mm are captured by a 16-bit, 512 × 512 pixel charge coupled device (CCD) camera (Rolera-MGi Plus, QIm-aging, Canada) placed right above the sample. This configuration leads to an approxi-mate sampling rate of 0.1 mm and a raw data length of 512, and accordingly, a minimum frequency spacing of 0.06 mm−1 should be assured as the composited illumination of
multi- frequency patterns is to be applied.
System calibration
In a realistic scenario, the overall MTF of the measurement is the combined contribu-tion from both the MTF of the sample, MTFsample(fx), and that of the measuring system (both the DMD and CCD), MTFsystem(fx). Thus, the modulation depth of the measured reflectance, MR(fx), is given by
where MI(fx) is the known modulation depths of the input to the DMD. To obtain
MTFsystem(fx), a BaSO4 plate which has been widely used as a 100% reflectance standard
is illuminated with the modulated source, and the modulation depth of its reflectance,
MP(fx), is measured. We then get
(6)
MR(fx)=MI(fx)·MTFsample(fx)·MTFsystem(fx)
(7) MTFsystem(fx)=MP(fx)/MI(fx)
Now, with MI(fx) and MTFsystem(fx) available, the genuine sample MTF required for the
μa-determination, MTFsample(fx), can be readily calculated from Eq. (6).
Results and discussion
To validate the proposed method, simulation, phantom and experimental investigations were performed.
Simulation validations
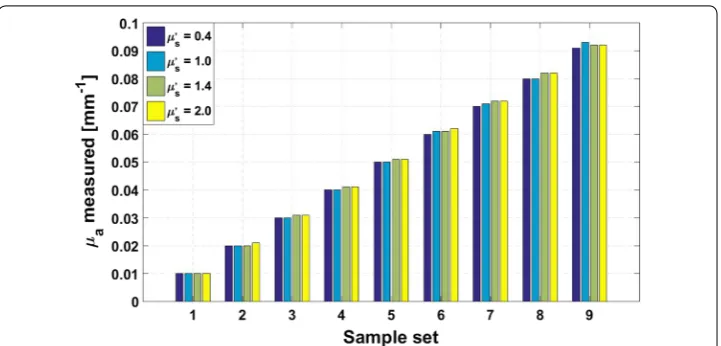
The simulation validation was conducted on a total of 36 homogeneous samples, with their optical properties coming from 36 combinations of μa = 0.01, 0.02, …, 0.09 mm−1
and µ′s = 0.4, 1.0, 1.4, 2.0 mm−1, are tested. A composited illumination of
multi-fre-quency modulation patterns at frequencies of 0.07, 0.13, 0.19, and 0.25 mm−1 was used.
The spatial domain diffuse reflectance for each sample was simulated with the following steps: Firstly, the LSF of each sample was generated following steps 1 and 2 in “ Con-struction of 3-D MTF database”, except that the number of the photons being run in the MC simulation was 106 for the purpose of increasing the shot noise level. Secondly, the
LSF was Fourier-transformed to extract the SFD responses at the DC and the four mod-ulation frequencies, from which the real spatial domain response to the four-frequency modulated source was recovered using the inverse Fourier transform. Thirdly, the recov-ered data was corrupted by a 20 dB Gaussian noise to emulate the realistic measurement. For the inversion, the Fourier frequency spectrum analysis was firstly employed, and then μa of each sample was extracted from the four measured MTFs using the least-square curve-fitting method, with a priori knowledge on µ′s. The results are shown in
Fig. 4, where samples are divided into 9 groups according to the true values of μa. It is observed that, with increase of μa, the discrepancy between the true and measured μa -values gradually increases, as a result of decreased μa-sensitivity, with a maximum of 0.003 mm−1 occurred at a sample case of μ
a = 0.09 mm−1 and µ′s = 1.0 mm−1.
The accuracy of the proposed MTF-characterization-based method for the μ a-determination is contingent on the measurement errors of MTFs as well as the error-tolerance of the inversion algorithm. We define the measurement error of the MTF as
where MTFM(µa,µ′s,f) and MTFT(µa,µ′s,f) are the measured and the true sample MTFs at the spatial frequency fx, respectively. To assess the influence of the measure-ment errors of the sample MTF on the look-up table scheme of the μa-determination, we define the up and down error tolerance
where µka is the k-th absorption coefficient in the μa-grid with µka< µka+1. It is inferred
from Fig. 1 that dU ≥ 0 and dD ≤ 0. Assuming that the MTFs for a fixed µ′s vary as a
lin-ear function of μa, the look-up table method can accurately determine μa provided that the condition dD(µa,µ′s,fx)/2≤e(µa,µs′,fx)≤dU(µa,µ′s,fx)/2 is satisfied. In this view,
we defined the interval [dD(µa,µ′s,fx)/2,dU(µa,µ′s,fx)/2] as the error-tolerance range (8) e(µa,µ′s,fx)= [MTFM(µa,µ′s,fx)−MTFT(µa,µ′s,fx)]/MTFT(µa,µ′s,fx)
(9) dU(µka,µ′s,fx)= [MTF(µka+1,µ′s,fx)−MTF(µka,µ′s,fx)]/MTF(µka,µ′s,fx)
(10)
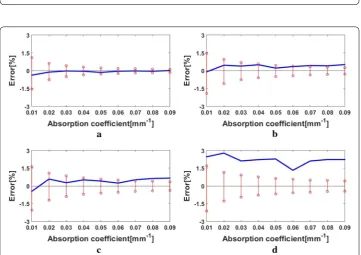
(ETR) of a measured MTF for the μa-determination. Figure 5 contrasts the MTF-ETRs with the measurement errors of the simulated MTFs for µ′s = 0.4, 1.0, 1.4, 2.0 mm−1 at
the spatial frequency of fx = 0.07 mm−1, and Fig. 6 compares the MTF-ETRs and the measurement errors of the simulated MTFs for µ′s = 1.4 mm−1 at the spatial frequencies
of fx = 0.07, 0.13, 0.19, 0.25 mm−1.
In Fig. 5, the MTF-ETRs decrease with the increase in µ′s, due to the decrease in the μa-sensitivity and the increase in the MTF value, and the measurement errors of the MTFs decrease conformably, indicating no clear correlation between µ′s and the
accu-racy of the μa-determination. It is noted that in our simulations, the SNR is set to be the same for all the measured reflectance without regard to µ′s. But in practice, the SNR of
the measured diffuse reflectance might increase with the increase in µ′s, owing to the
increased intensity of the diffuse reflectance. Therefore it is expected that accuracy of the μa-determination could be improved with increasing µ′s.
In Fig. 6, with the increase in the spatial frequency, it is observed that both the ETRs and the measurement errors of MTFs trend to increase. As the spatial frequency reaches 0.25 mm−1, the measurement errors of the MTFs are all beyond the corresponding
ETRs. This implies that a look-up-table-method-based retrieval of μa at this frequency would be inaccurate. A reason for the degraded performance with the increase in the spatial frequency is that the high frequency components account for little of the whole spatial response, and thus suffer from deteriorated SNRs. It is thus concluded that low frequency modulation is more preferable as the look-up table method is employed.
Phantom experiments
Experiments were conducted on liquid tissue-simulating phantoms consisting of deion-ized water as the diluent, India ink as the absorber and Intralipid-10% as the scatterer. According to the spectral absorbance of a pre-prepared diluted India ink measured by a spectrophotometer (UV2550, Shimadzu, Japan), and the reported scattering coef-ficient and the anisotropy of Intralipid-10% [33], a set of the optical properties were
obtained from 14 combinations of μa = 0.01, 0.02, 0.03, 0.04, 0.05, 0.06, 0.07 mm−1 and
µ′s = 1.0, 2.0 mm−1 for the phantoms. A semi-infinite plane geometry was realized by a
tank with a length of 120 mm, a width of 120 mm, and a height of 50 mm. The tank was painted black to reduce the wall reflection.
Fig. 5 Comparisons between the MTF-ETRs (red stem) for the μa-determination and the measurement errors
of the simulated MTFs (blue line) for the reduced scattering coefficients of a µ′
s= 0.4 mm−1, b µ′s= 1.0 mm−1, c µ′
s= 1.4 mm−1, and d µs′= 2.0 mm−1 at the spatial frequency of fx= 0.07 mm−1
Fig. 6 Comparisons between the MTF-ETRs (red stem) and the measurement errors of the simulated MTFs (blue line) for the reduced scattering coefficient of µ′
Each sample was illuminated by composited three-frequency modulation patterns with three frequency sets of fx,1 = {0.06, 0.14, 0.22 mm−1}, fx,2 = {0.08, 0.16, 0.24 mm−1}
and fx,3 = {0.10, 0.18, 0.26 mm−1}. The diffuse reflectance images corresponding to the
three frequency sets were captured successively, and then summed up along the y-direc-tion for 1-D Fourier transform along the x direcy-direc-tion. Finally, the MTFs of each sample at the 9 modulation frequencies were calculated by Eq. (9).
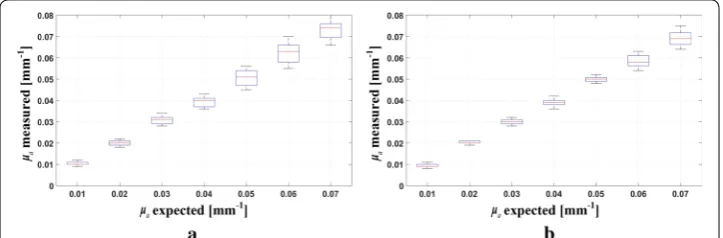
For the μa-determination, we recombined the 9 measured MTFs of each sample into three sets, i.e., the low-frequency set: LF = {MTF(f)|f = 0.06, 0.08, 0.10}, the middle-frequency set: MF = {MTF(f)|f = 0.14, 0.16, 0.18}, and the high-frequency set: HF = {MTF(f)|f = 0.22, 0.24, 0.26}, respectively. We thereafter retrieved 27 absorption coef-ficients using the least-square curve-fitting scheme, from 27 combinations of the three-frequency MTFs, with the MTFs in each combination coming from the LF, MF and HF, respectively. Boxplot graphs of the retrieved absorption coefficients are shown in Fig. 7a, b, for µ′s = 1.0 mm−1 and µ′s = 2.0 mm−1, respectively, with the relevant statistical and
error analyses listed in Table 1.
For the accuracy assessment of the μa-determination, the relative error between the expected absorption coefficient, µexpecta , and the mean of the measured absorption
coef-ficient, µmeana , is used in the above table, i.e., e=
µmeana −µexpecta
/µexpecta
.
Results in Table 1 demonstrate a maximum μa-determination error of 4.86% for
µ′s = 1.0 mm−1 and 7.00% for µ′s = 2.0 mm−1. A gradually increasing trend of the
vari-ance is observed as μa increases. This is probably due to the fact that as μa increase, the
μa-sensitivity decreased while the measurement errors of the MTFs increased. In con-trast, as µ′s increases, decreased variance is observed in Table 1, which might be a result
of the decreased measurement errors of the MTFs.
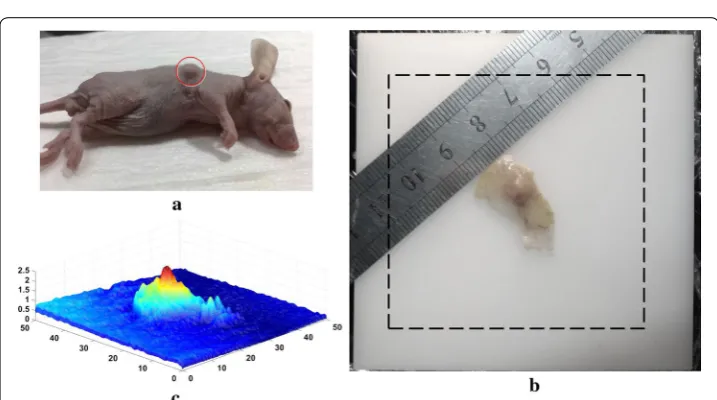
Ex‑vivo imaging of a subcutaneous tumor
A subcutaneous xenograft model of human lung cancer (ATCC number: CCL-185) in a 4-week-old female nude mouse was investigated, as shown in Fig. 8. To obtain a reason-ably flat sample, a specimen consisting of tumor, vessels, skin and subcutaneous tissues was cut out from the mouse and put on the upper surface of a solid tissue-mimicking phantom made from polyformaldehyde. The phantom was 80 mm in length, 80 mm in width and 40 mm in height, with μa = 0.0038 mm−1 and µ′s = 1.0 mm−1 according to the
product manual. The size of the tumor was ~7 mm in largest dimension. The 3-D surface
Fig. 7 Boxplot graphs of the retrieved absorption coefficients for a µ′
profile of the specimen was measured using the prototype system with the upper surface of the phantom being taken as the reference. The surface height map is reconstructed using a phase-shifting profilometry, and shown in Fig. 8c, with the maximum height of the tumor being approximated 2.4 mm [34].
To achieve spatially resolved imaging of the specimen, the sample was sequentially illuminated three times at the same modulation frequency of fx = 0.06 mm−1 with the different phase offsets of 0, 2π/3, 4π/3, and the diffuse reflectance images were captured with the CCD camera in full 512 × 512 resolution. Profile corrections of the reflectance intensity using a multi-height calibration approach along with a Lambertian model were firstly conducted [35]. Then the corrected images were put into Eqs. (4) and (5) to extract both the DC and the AC modulated reflectance images, from which the MTF was calculated pixel-by-pixel. Finally, pixel-by-pixel μa-determination is achieved using the look-up table method, with the assumption of µ′s = 1.0 mm−1 over the whole FOV.
The reconstructed image is shown in Fig. 9.
Table 1 Statistical and error analyses of the retrieved absorption coefficients
Expected absorption coefficient (µexpecta ) [mm−1]
Mean (µmeana ) [mm−1] Variance [mm−2] Error (e) [%]
µ′s = 1.0 µ′s = 2.0 µ′s = 1.0 µ′s = 2.0 µ′s = 1.0 µ′s = 2.0
0.0100 0.0104 0.0093 7.2 × 10⁻⁷ 6.8 × 10⁻⁷ 4.00 7.00 0.0200 0.0200 0.0203 1.9 × 10⁻⁶ 5.1 × 10⁻⁷ 0.00 1.50 0.0300 0.0310 0.0297 3.7 × 10⁻⁶ 1.7 × 10⁻⁶ 3.33 1.00 0.0400 0.0397 0.0388 6.0 × 10⁻⁶ 2.8 × 10⁻⁶ 0.75 3.00 0.0500 0.0507 0.0498 1.5 × 10⁻⁵ 1.3 × 10⁻⁶ 1.04 0.40 0.0600 0.0626 0.0584 2.3 × 10⁻⁵ 7.2 × 10⁻⁶ 4.33 2.67 0.0700 0.0734 0.0691 2.2 × 10⁻⁵ 1.0 × 10⁻⁵ 4.86 1.29
In Fig. 9, we recognize an extremely high absorption region which is basically coinci-dent with the tumor bulge observed in the surface height map, demonstrating the high absorption contrast of the tumor to the surrounding tissue as a result of tumor angio-genesis [36]. The circumambient high absorption region near the tumor suggests poten-tial tumor invasion that is invisible to naked eyes, implying that the method may serve as a powerful tool for identifying tumor margins. It should be noted that up to now SFD imaging still suffers from degraded quantitation and spatial resolution, known as the partial volume effect, because the data acquired by each detector (i.e., each pixel on the CCD array) is analyzed independently of all the other detectors. As a result, in Fig. 9, the absorption coefficient of the specimen might be underestimated due to the averaging of the background, and image of the tumor target is slightly blurred due to the averaging of the neighboring volumes. Cuccia et al. have illustrated well about the lateral and depth-dependent partial volume effects in SFD imaging [15]. To solve the problem, we will work on the development of an accurate SFD forward model for inhomogeneous optical medium as well as a reconstruction method that employs rigorous sensitivity function of detector in the future.
Conclusions
In summary, we have developed a novel approach based on the MTF characterization to achieve the reference-free determination of absorption coefficients. A 3-D database that depicts the MTF as a function of the absorption coefficient, the reduced scatter-ing coefficient and the spatial frequency have been established, enables the inversion methods of both the least-square curve-fitting and the look-up table being adopted for μa-determination. Simulation results have verified the feasibility of the method as well as evaluated its performance in μa-determination. Experimental performance have been evaluated for μa ranging from 0.01 to 0.07 mm−1, and the maximum errors in μa -determination are 4.86% for µ′s = 1.0 mm−1 and 7.00% for µ′s = 2.0 mm−1. The results
suggest that the proposed method can be applied to the accurate determination of the
bulk absorption coefficient of tissue, and better yet, in a reference-free way. We have also presented quantitative ex vivo imaging of human lung cancer in a subcutaneous xeno-graft mouse model, and the result indicates that this reference-free method will facilitate the clinical translation of SFD measurement toward the diagnosis, staging and prognosis of those diseases that are accompanied by significant changes in optical absorption, such as non-melanoma skin cancer and port-wine stain.
Abbreviations
SFD: spatial frequency domain; MTF: modulation transfer function; DC: direct current; AC: alternating current; LSF: line spread function; 1-D: one-dimension; STF: system transfer function; MC: Monte Carlo; PSF: point spread function; FOV: field of view; LED: light-emitting diode; DMD: digital micromirror device; CCD: charge coupled device; ETR: error-toler-ance range.
Authors’ contributions
WC carried out the design of the algorithms, performed the simulations and drafted the manuscript, and also partici-pated in the experimental design and operation. TL and CQ built the prototype system and performed the surface profile extraction and correction. PY and KZ contributed to the implementation of the experiments. HZ and FG directed the design of the algorithm and the experiments. All authors read and approved the final manuscript.
Author details
1 College of Precision Instrument and Optoelectronics Engineering, Tianjin University, Tianjin 300072, China. 2 Tianjin Key
Laboratory of Biomedical Detecting Techniques and Instruments, Tianjin 300072, China. Acknowledgements
Not applicable. Competing interests
The authors declare that they have no competing interests. Availability of data and materials
The datasets used and/or analyzed during the current study are available from the corresponding author on reasonable request.
Consent for publication Not applicable.
Ethics approval
Animal experiments were conducted under a protocol approved by the institutional ethical committee, and the proce-dures were in accordance with institutional guidelines.
Funding
The authors acknowledge the funding supports from the National Natural Science Foundation of China (61475116, 81371602, 61575140, 81671728, 81401453, 81571723), the Tianjin Municipal Government of China (17JCZDJC32700, 17JCQNJC12700, 15JCZDJC31800) and the “111” Project of the Ministry of Education of China (B07014).
Publisher’s Note
Springer Nature remains neutral with regard to jurisdictional claims in published maps and institutional affiliations.
Received: 11 March 2017 Accepted: 4 August 2017
References
1. O’Sullivan TD, Cerussi AE, Cuccia DJ, Tromberg BJ. Diffuse optical imaging using spatially and temporally modulated light. J Biomed Opt. 2012;17:071311.
2. Cuccia DJ, Bevilacqua F, Durkin AJ, Tromberg BJ. Modulated imaging: quantitative analysis and tomography of turbid media in the spatial-frequency domain. Opt Lett. 2005;30:1354–6.
3. Erickson TA, Mazhar A, Cuccia DA, Durkin AJ, Tunnell JW. Lookup-table method for imaging optical properties with structured illumination beyond the diffusion theory. J Biomed Opt. 2010;15:036013.
4. Kanick SC, McCiatchy DM 3rd, Krishnaswarny V, Elliott JT, Paulsen KD, Pogue BW. Sub-diffusive scattering parameter maps recovered using wide-field high-frequency structured light imaging. Biomed Opt Express. 2014;5:3376–90. 5. McClatchy ШDM, Rizzo EJ, Wells WA, Cheney PP, Hwang JC, Paulsen KD, Pogue BW, Kanick SC. Wide-field quantitative
imaging of tissue microstructure using sub-diffuse spatial frequency domain imaging. Optica. 2016;3:613–21. 6. Rohrbach DJ, Zeitouni NC, Muffoletto D, Saager R, Tromberg BJ, Sunar U. Characterization of nonmelanoma skin
7. Saager RB, Cuccia DJ, Saggese S, Kelly KM, Durkin AJ. A Light emitting diode (LED) based spatial frequency domain imaging system for optimization of photodynamic therapy of nonmelanoma skin cancer: quantitative reflectance imaging. Laser Surg Med. 2013;45:207–15.
8. Mazhar A, Sharif SA, Cuccia DJ, Nelson SJ, Kelly KM, Durkin AJ. Spatial frequency domain imaging of port wine stain biochemical composition in response to laser therapy: a pilot study. Laser Surg Med. 2012;44:611–21.
9. Konecky SD, Rice T, Tromberg BJ, Owen CM, Valdés PA, Roberts DW, Kolste K, Leblond F, Paulsen KD, Wilson BC. Spa-tial frequency domain tomography of protoporphyrin IX fluorescence in preclinical glioma models. J Biomed Opt. 2012;17:056008.
10. Sunar U, Rohrbach DJ, Morgan J, Zeitouni N, Henderson BW. Quantifiation of PpIX concentration in basal cell carcinoma and squamous cell carcinoma models using spatial frequency domain imaging. Biomed Opt Express. 2013;4:531–7.
11. Ponticorvo A, Taydas E, Mazhar A, Scholz T, Kim HS, Rimler J, Evans GR, Cuccia DJ, Durkin AJ. Quantitative assessment of partial vascular occlusion in a swine pedicle flap model using spatial frequency domain imaging. Biomed Opt Express. 2013;4:298–306.
12. Mazhar A, Dell S, Cuccia DA, Gioux S, Durkin AJ, Frangioni JV, Tromberg BJ. Wavelength optimization for rapid chromophore mapping using spatial frequency domain imaging. J Biomed Opt. 2010;15:061716.
13. Doornbos RM, Lang R, Aalders MC, Cross FW, Sterenborg HJ. The determination of in vivo human tissue optical properties and absolute chromophore concentrations using spatially resolve diffuse reflectance spectroscopy. Phys Med Biol. 1999;44:967–81.
14. Dögnitz N, Wagnières G. Determination of tissue optical properties by steady-state spatial frequency-domain reflec-tometry. Lasers Med Sci. 1998;13:55–65.
15. Cuccia DJ, Bevilacqua F, Durkin AJ, Ayers FR, Tromberg BJ. Quantitation and mapping of tissue optical properties using modulated imaging. J Biomed Opt. 2009;14:024012.
16. Vervandier J, Gioux S. Single snapshot imaging of optical properties. Biomed Opt Express. 2013;4:2938–44. 17. Nadeau KP, Durkin AJ, Tromberg BJ. Advanced demodulation technique for the extraction of tissue optical
proper-ties and structural orientation contrast in the spatial frequency domain. J Biomed Opt. 2014;19:056013. 18. Bodenschatz N, Krauter P, Liemert A, Wiest J, Kienle A. Model-based analysis on the influence of spatial frequency
selection in spatial frequency domain imaging. Appl Opt. 2015;54:6725–31.
19. Weber JR, Cuccia DJ, Durkin AJ, Tromberg BJ. Noncontact imaging of absorption and scattering in layered tissue using spatially modulated structured light. J Appl Phys. 2009;105:102028.
20. Nadeau KP, Rice TB, Durkin AJ, Tromberg BJ. Multifrequency synthesis and extraction using square wave projection patterns for quantitative tissue imaging. J Biomed Opt. 2015;20:116005.
21. Nandy S, Mostafa A, Kumavor PD, Sanders M, Brewer M, Zhu Q. Characterizing optical properties and spatial hetero-geneity of human ovarian tissue using spatial frequency domain imaging. J Biomed Opt. 2016;21:101402. 22. Tabassum S, Zhao Y, Istfan R, Wu J, Waxman DJ, Roblyer D. Feasibility of spatial frequency domain imaging (SFDI) for
optically characterizing a preclinical oncology model. Biomed Opt Express. 2016;7:4154–70.
23. Baruch D, Abookasis D. Multimodal optical setup based on spectrometer and cameras combination for biological tissue characterization with spatially modulated illumination. J Biomed Opt. 2017;22:046007.
24. Sandby-moller J, Poulsen T, Wulf HC. Epidermal thickness at different body sites: relationship to age, gender, pig-mentation, blood content, skin type and smoking habit. Acta Derm Venereol. 2003;83:410–3.
25. Bhandari A, Hamre B, Frette O, Stamnes K, Stamnes JJ. Modeling optical properties of human skin using Mie theory for particles with different size distributions and refractive indices. Opt Express. 2011;15:14549–67.
26. Bashkatov AN, Genina EA, Tuchin VV. Optical properties of skin, subcutaneous, and muscle tissues: a review. J Innov Opt Health Sci. 2011;4:9–38.
27. Krishnaswamy V, Elliott JT, McClatchy DM, Barth RJ Jr, Wells WA, Pogue BW, Paulsen KD. Structured light scatteros-copy. J Biomed Opt. 2014;19:070504.
28. Yücel MA, Aasted CM, Petkov MP, Borsook D, Boas DA, Becerra L. Specificity of hemodynamic brain responses to painful stimuli: a cunctional near-infrared spectroscopy study. Sci Rep. 2015;5:9469.
29. Foschum F, Kienle A. Broadband absorption spectroscopy of turbid media using a dual step steadystate method. J Biomed Opt. 2012;17:037009.
30. Bashkatov AN, Genina EA, Kochubey VI, Tuchin VV. Optical properties of human skin, subcutaneous and mucous tissues in the wavelength range from 400 to 2000 nm. J Phys D Appl Phys. 2005;38:2543–55.
31. Jacques SL. Optical properties of biological tissues: a review. Phys Med Biol. 2013;58:R37–61.
32. Wang L, Jacques SL, Zheng L. MCML—Monte Carlo modeling of light transport in multi-layered tissues. Comput Methods Progr Biomed. 1995;47:131–46.
33. van Staveren HJ, Moes CJ, van Marle J, Prahl SA, van Gemert MJ. Light scattering in Intralipid-10% in the wavelength range of 400–1100nm. Appl Opt. 1991;30:4507–14.
34. Gioux S, Mazhar A, Cuccia DJ, Tromberg BJ, Frangioni JV. Three-dimensional surface profile intensity correction for spatially modulated imaging. J Biomed Opt. 2009;14:034045.
35. van de Giessen M, Angelo JP, Gioux S. Real-time, profile-corrected single snapshot imaging of optical properties. Biomed Opt Express. 2015;6:4051–62.