www.geosci-model-dev.net/3/257/2010/
© Author(s) 2010. This work is distributed under the Creative Commons Attribution 3.0 License.
Geoscientific
Model Development
Simulating emission and chemical evolution of coarse sea-salt
particles in the Community Multiscale Air Quality (CMAQ) model
J. T. Kelly1,*, P. V. Bhave1, C. G. Nolte1, U. Shankar2, and K. M. Foley1
1Atmospheric Modeling and Analysis Division, National Exposure Research Laboratory, Office of Research and
Development, US Environmental Protection Agency, RTP, NC, USA
2Institute for the Environment, University of North Carolina, Chapel Hill, NC, USA
*now at: Planning and Technical Support Division, Air Resources Board, California Environmental Protection Agency,
Sacramento, CA, USA
Received: 18 November 2009 – Published in Geosci. Model Dev. Discuss.: 4 December 2009 Revised: 23 March 2010 – Accepted: 25 March 2010 – Published: 8 April 2010
Abstract. Chemical processing of sea-salt particles in coastal environments significantly impacts concentrations of particle components and gas-phase species and has implica-tions for human exposure to particulate matter and nitrogen deposition to sensitive ecosystems. Emission of sea-salt par-ticles from the coastal surf zone is known to be elevated com-pared to that from the open ocean. Despite the importance of sea-salt emissions and chemical processing, the US EPA’s Community Multiscale Air Quality (CMAQ) model has tra-ditionally treated coarse sea-salt particles as chemically in-ert and has not accounted for enhanced surf-zone emissions. In this article, updates to CMAQ are described that enhance sea-salt emissions from the coastal surf zone and allow dy-namic transfer of HNO3, H2SO4, HCl, and NH3 between
coarse particles and the gas phase. Predictions of updated CMAQ models and the previous release version, CMAQv4.6, are evaluated using observations from three coastal sites dur-ing the Bay Regional Atmospheric Chemistry Experiment (BRACE) in Tampa, FL in May 2002. Model updates im-prove predictions of NO−3, SO24−, NH+4, Na+, and Cl− con-centrations at these sites with only a 8% increase in run time. In particular, the chemically interactive coarse particle mode dramatically improves predictions of nitrate concentration and size distributions as well as the fraction of total nitrate in the particle phase. Also, the surf-zone emission parameteri-zation improves predictions of total sodium and chloride con-centration. Results of a separate study indicate that the model updates reduce the mean absolute error of nitrate predictions
Correspondence to: J. T. Kelly ([email protected])
at coastal CASTNET and SEARCH sites in the eastern US. Although the new model features improve performance rela-tive to CMAQv4.6, some persistent differences exist between observations and predictions. Modeled sodium concentration is biased low and causes under-prediction of coarse particle nitrate. Also, CMAQ over-predicts geometric mean diameter and standard deviation of particle modes at the BRACE sites. These over-predictions may cause too rapid particle dry de-position and partially explain the low bias in sodium predic-tions. Despite these shortcomings, the updates to CMAQ en-able more realistic simulations of chemical processes in envi-ronments where marine air mixes with urban pollution. The model updates described in this article are included in the public release of CMAQv4.7 (http://www.cmaq-model.org).
1 Introduction
large contribution of sea salt to atmospheric particulate mat-ter (PM), the emission and chemical evolution of sea-salt par-ticles must be represented accurately by models.
The diameter of sea-salt particles spans several orders of magnitude, but the peak in the mass distribution is usu-ally in the coarse size range (aerodynamic diameter,Daero, >2.5 µm) (e.g., Keene et al., 2007). Uptake of gaseous species by coarse sea-salt particles reduces their availability for condensation on fine particles and can potentially reduce the mass concentration of PM2.5(PM withDaero≤2.5 µm).
Uptake by coarse sea salt can also significantly reduce the concentration of nitric acid in environments where the for-mation of particulate ammonium nitrate is unfavorable (e.g., ammonia-limited or high-temperature). Associations be-tween coarse particle nitrate and sea salt have been observed in both coastal (e.g., Hsu et al., 2007) and rural (e.g., Lee et al., 2008) areas.
Sea-salt emissions are enhanced in the coastal surf zone compared to the open ocean and result in elevated concentra-tions near the coast (de Leeuw et al., 2000). During advec-tion toward land, sea salt is often exposed to anthropogenic emissions from shipping lanes (Osthoff et al., 2008; Simon et al., 2009) and coastal urban centers (Nolte et al., 2008). Considering that many coastal areas are densely populated (Nicholls and Small, 2002), chemical modification of sea-salt particles by acidic gases could result in significant human exposure to anthropogenic PM10(PM withDaero≤10 µm) in
coastal environments. This exposure is a concern in light of associations between increases in coarse particle concentra-tions and adverse health effects (Brunekreef and Forsberg, 2005; Sandstrom et al., 2005; Volckens et al., 2009).
Despite the significance of sea-salt emissions and chemi-cal transformations, some prominent air quality models have not treated sea-salt particles (e.g., Bessagnet et al., 2004; Grell et al., 2005). Other models have included emissions of sea-salt particles, but have not simulated their chemi-cal interactions with gas-phase species (e.g., Foltescu et al., 2005; Smyth et al., 2009). The US EPA’s Community Mul-tiscale Air Quality (CMAQ) model has included online cal-culation of sea-salt emissions from the open ocean since ver-sion 4.5, but has not accounted for enhanced emisver-sions from the coastal surf zone and has treated coarse sea-salt particles as dry and chemically inert (Sarwar and Bhave, 2007).
Studies that have simulated the chemical evolution of sea-salt particles have used alternative models to CMAQ (e.g., Ja-cobson, 1997; Lurmann et al., 1997; Meng et al., 1998; Sun and Wexler, 1998b; Sartelet et al., 2007; Athanasopoulou et al., 2008; Pryor et al., 2008) or variants of CMAQ such as CMAQ-MADRID (Zhang et al., 2004). These studies of-ten suffered from simple estimates of sea-salt emissions or did not evaluate model results against measurements of size-segregated PM composition (i.e., size-composition distribu-tions). Spyridaki et al. (2006) did evaluate size-composition distributions, but did not account for enhanced emissions of sea salt from the coastal surf zone. Kleeman and Cass
(2001) modeled surf-zone emissions, but only evaluated size-composition distributions for particles withDaero<1.8 µm.
A recent example of a CMAQ variant that treats chemical processing of sea salt is CMAQ-UCD (Zhang and Wexler, 2008). This model was developed for application in the Bay Regional Atmospheric Chemistry Experiment (BRACE) (Nolte et al., 2008). Although CMAQ-UCD performed well in that study, the model is not suitable for many applications because its run speed is about 8–10 times slower than the standard version of CMAQ used for regulatory applications. Despite the numerous modeling efforts described above, a need exists for a computationally-efficient treatment of sea-salt emissions and chemical evolution in a model where re-sults capture the size-composition distributions observed in coastal environments.
The BRACE study was conducted to (1) improve estimates of atmospheric nitrogen deposition to Tampa Bay, FL, (2) ap-portion nitrogen deposition to local and non-local sources, and (3) assess the impact of utility controls on nitrogen de-position to Tampa Bay (Atkeson et al., 2007). Excessive ni-trogen addition to waterways from the atmosphere and land can produce eutrophic conditions detrimental for aquatic life (e.g., low dissolved O2and high opacity). In 2004, 65% of
assessed systems in the continental US had moderate to high eutrophic conditions (Bricker et al., 2007). Due to the differ-ent deposition velocities of gases and particles, condensation of HNO3 and NH3on coarse sea salt can alter nitrogen
de-position to sensitive ecosystems (Pryor and Sorensen, 2000; Evans et al., 2004). Studies that apportion nitrogen depo-sition to potentially controllable sources could benefit from models that accurately and efficiently calculate the chemical processing and deposition of sea salt.
Air quality models require good predictions of particle size distributions to accurately predict dry deposition. Ac-curate size distributions are also important to the ongoing development of an inline photolysis module for CMAQ (Fo-ley et al., 2010) and the coupled meteorology and chemistry model, WRF-CMAQ (Pleim et al., 2008), which calculate the impact of atmospheric particles on radiative transfer and clouds. Lung dosimetry models also require information on particle size, because deposition patterns in the lung depend strongly on particle diameter in addition to flow variables and lung morphometry (Asgharian et al., 2001). Due to the reg-ulatory emphasis on mass-based PM concentrations, particle size distributions from the CMAQ model are rarely evaluated against observations. In cases where they have been evalu-ated (Elleman and Covert, 2009; Park et al., 2006; Zhang et al., 2006), the focus has been on number or volume distribu-tions of fine particles. The availability of size-resolved PM composition measurements from the BRACE campaign that span two-orders of magnitude (0.18< Daero<18 µm)
pro-vides an opportunity to evaluate CMAQ predictions of size-composition distributions in a coastal urban environment.
from the coastal surf zone and a chemically interactive coarse particle mode that enables dynamic transfer of HNO3,
H2SO4, HCl, and NH3between coarse particles and the gas
phase. The updated version of CMAQ is applied to the Tampa Bay region, and predictions of size-composition dis-tributions and gas-particle partitioning are evaluated against measurements from the BRACE campaign in May 2002. Results from the updated model are compared with results from CMAQv4.6 to demonstrate the model improvements and computational efficiency. Comparisons with observa-tions are used to identify areas for future model development.
2 Modeling
2.1 Aerosol modeling
A brief description of CMAQ’s aerosol module is given here; see Binkowski and Roselle (2003) for further details. CMAQ represents the atmospheric particle distribution as the super-position of three log-normal modes. The ISORROPIAv1.7 thermodynamic model (Nenes et al., 1998) is used to equili-brate inorganic components of the two fine modes with their gaseous counterparts. In CMAQv4.6 and prior model ver-sions, the coarse particle mode is treated as dry and chemi-cally inert with a fixed geometric standard deviation (GSD) of 2.2. These assumptions have been relaxed in the updates for CMAQv4.7 described in this paper. In the remainder of Sect. 2.1, the dynamically interactive coarse particle mode used in CMAQv4.7 is described along with changes to the treatment of particle-distribution GSDs. The parameteriza-tion of sea-salt emissions from the coastal surf zone used in CMAQv4.7 is described in Sect. 2.2. Additional scientific updates to CMAQ that were released in version 4.7 are de-scribed by Foley et al. (2010).
2.1.1 Dynamically interactive coarse particle mode
Wexler and Seinfeld (1990) demonstrated that time scales for gas-particle equilibration are long compared to those of other processes for certain atmospheric conditions. Allen et al. (1989) and Wexler and Seinfeld (1992) found evidence of departures from equilibrium, possibly due to mass-transfer limitations, in field studies of gas and particle systems. Meng and Seinfeld (1996) calculated that submicron particles in the atmosphere rapidly attain equilibrium with the gas phase, but that coarse particles generally exist in non-equilibrium transition states. Evidence from these and other studies sug-gests that models of coarse sea-salt chemistry must simulate gas-particle mass transfer rather than assuming instantaneous gas-particle equilibrium.
Simulating the dynamics of gas-particle mass transfer is challenging, because some components of the system equi-librate significantly faster than others and require small in-tegration steps to be used for the entire system (i.e., the
condensation-evaporation equations are stiff). Since compo-nent vapor pressures must be determined at each step using a computationally-intensive thermodynamic module, small time steps make the integration impractical for many air qual-ity applications. A number of studies have proposed approx-imate techniques for expediting this integration: e.g., Sun and Wexler (1998a), Capaldo et al. (2000), Jacobson (2005), Zhang and Wexler (2006), and Zaveri et al. (2008). The “hybrid approach” of Capaldo et al. (2000) and Pilinis et al. (2000) is adopted in CMAQv4.7, since it has been used with success in a number of previous studies (e.g., Gaydos et al., 2003; Koo et al., 2003; Zhang et al., 2004; Sartelet et al., 2006, 2007; Athanasopoulou et al., 2008).
Two main sources of stiffness must be overcome when integrating the condensation-evaporation equations. First, fine particles equilibrate relatively quickly with the gas phase compared to coarse particles due in part to the higher surface area-to-volume ratios of fine particles. Second, the hydrogen ion concentration changes faster than concentrations of other components because the flux of hydrogen ion is determined by the sum of the fluxes of H2SO4, HNO3, HCl, and NH3,
and the hydrogen ion concentration is relatively small (Sun and Wexler, 1998a; Zaveri et al., 2008). To minimize stiff-ness, two key assumptions are made in the hybrid approach of CMAQv4.7: (1) fine particle modes are in instantaneous equilibrium with the gas phase (Capaldo et al., 2000), and (2) condensation (evaporation) of HNO3, HCl, and NH3 to
(from) the coarse particle mode is limited such that the flux of hydrogen ion is a maximum of 10% of the current hydro-gen ion concentration per second (Pilinis et al., 2000).
The first assumption can introduce error into calculations when the fine modes are not in equilibrium with the gas phase. However, CMAQ’s fine modes largely describe sub-micron particles with equilibration time scales comparable to those of typical gas/particle dynamics and often shorter than an operator step of 5–10 min (Meng and Seinfeld, 1996; Dassios and Pandis, 1999). The partitioning algorithm for the fine modes involves a bulk equilibrium calculation for the combined modes and a subsequent apportioning of mass to each mode using weighting factors based on the modal trans-port moments (Pandis et al., 1993; Binkowski and Shankar, 1995). Combining modes for the bulk equilibrium calcula-tion produces error when the modes have different composi-tion. While this source of error may be important for finely resolved sectional models, it is not significant in CMAQ, where the overwhelming proportion of fine mass resides in a single mode (i.e., the accumulation mode). Error may also be introduced into calculations by the decoupling of interactions between the gas phase and the fine and coarse modes over the operator time step. Capaldo et al. (2000) reported that error due to this decoupling became important for a 10-min opera-tor step when a large spike of NH3was emitted during a
inorganic salts is not modeled in CMAQ, CMAQ’s aerosol calculations are much less sensitive to decoupling time than are calculations of the more detailed model of Capaldo et al. (2000).
Pilinis et al. (2000) performed sensitivity runs to evaluate the impact of the flux limit for the hydrogen ion (i.e., as-sumption (2) above). They reported that varying the limiter from 1% s−1to 100% s−1had little impact on results. To en-sure the soundness of the approach, we confirmed that our predictions converge to the ISORROPIA equilibrium values after long integration times and agree with results based on a simplified version of the Jacobson (2005) method. Based on this evidence and the success of previous studies mentioned above, the artificial flux limitation of Pilinis et al. (2000) ap-pears to be a reasonable method for maintaining numerical stability while performing integrations at long time step in air quality models. CMAQv4.7 uses a constant time step of 90 s for integrating the condensation-evaporation equations for coarse-mode particles.
2.1.2 Particle distribution geometric standard deviations
In CMAQv4.6, the GSD of the coarse particle mode is fixed at 2.2 and sulfate is the only component to influence GSDs of the fine modes during condensation and evaporation. In CMAQv4.7, the GSD of all three modes is variable; however, a constraint is imposed such that GSDs do not change dur-ing condensation and evaporation calculations. Except for the variable GSD of the coarse mode and the condensation-evaporation constraint, GSDs are calculated in CMAQv4.7 the same way as in previous CMAQ versions (Binkowski and Roselle, 2003). The constraint on GSDs during condensation and evaporation calculations is a temporary patch required to achieve stable GSD predictions, and its implications are dis-cussed in Sect. 4.2.
2.1.3 Modeling chloride displacement from sea salt
In CMAQv4.7, HNO3, HCl, and NH3 condense and
evap-orate from the coarse particle mode and H2SO4condenses.
The primary advantage of the chemically-active coarse mode is that displacement of chloride by nitrate can be simulated in environments where sea-salt particles interact with pollutants from urban areas. Displacement of nitrate and chloride by sulfate is also simulated for coarse particles in CMAQv4.7; however, sulfate preferentially resides in the fine modes due to its negligible vapor pressure and the large surface area of the fine modes.
For solid NaCl particles exposed to HNO3at low relative
humidity (RH), the replacement of chloride by nitrate is often expressed by the following heterogeneous reaction:
NaCl(s)+HNO3(g)→NaNO3(s)+HCl(g) (R1)
(Beichert and Finlayson-Pitts, 1996). However, sea salt gen-erally contains highly hygroscopic salts such as calcium and
magnesium chloride in addition to sodium chloride. These salts have low deliquescence RHs (∼33% for MgCl2.6H2O
and∼28% for CaCl2.6H2O at 298 K, compared to∼75% for
NaCl), and so the mutual deliquescence RH of the sea-salt mixture should be about 30% for typical coastal conditions (e.g., see Figs. 10–12 of Kelly and Wexler, 2006). Also, elec-trodynamic balance studies indicate that NaCl-MgCl2 and
CaCl2particles exist as supersaturated solutions at RHs well
below their deliquescence RH under laboratory conditions (Cohen et al., 1987; Chan et al., 2000). Therefore, sea-salt particles are likely to contain an aqueous electrolyte solution at RH conditions typical of coastal environments, and the dis-placement of chloride by nitrate will often occur via solution thermodynamics rather than Reaction (R1).
Although CMAQ does not directly treat calcium or mag-nesium salts, inorganic particle components are assumed to exist in aqueous solution at all RHs using the “metastable” branch of the ISORROPIA model. The pathway for ni-trate replacement of chloride in sea-salt particles in CMAQ is similar to that described by Jacobson (1997). As nitric acid condenses on a sea-salt particle to maintain equilibrium with the gas phase, the particle solution concentrates. The solution may concentrate further if the ambient RH subse-quently decreases. For typical compositions, the activity co-efficient of dissolved HCl increases dramatically compared to that of dissolved HNO3with increasing ionic strength
(Ja-cobson, 1997; Dasgupta et al., 2007). Increases in activ-ity cause the chemical potential of dissolved HCl to exceed that of gas-phase HCl, and some HCl evaporates to main-tain equilibrium. Evaporation of HCl leads to lower ionic strength and enables nitrate to remain in solution. The over-all change in particle composition for this process resembles that of (R1); however, chloride replacement in CMAQ is re-versible and driven by solution thermodynamics rather than being a kinetically-limited forward reaction.
2.2 Parameterization of sea-salt emissions
Beginning with version 4.5, CMAQ has included online cal-culation of sea-salt emissions from the open ocean using the method of Gong (2003), who extended the parameterization of Monahan et al. (1986) to submicron sizes. This approach is based on the whitecap method, where the emission flux scales linearly with the fraction of ocean area covered by whitecaps. Over the open ocean, whitecap coverage is de-termined as a function of wind speed using the empirical relation of Monahan et al. (1986). The size distribution of emitted sea salt is adjusted to local RH before mixing it with the ambient particle modes (Zhang et al., 2005).
In CMAQ, primary sea-salt particles are speciated into three components (weight % by dry mass): Na+ (38.56%), Cl− (53.89%), and SO2−
4 (7.55%). This speciation
Moya et al. (2001) demonstrate that this approach is a good approximation when using thermodynamic aerosol models that do not include all crustal elements (e.g., see Fig. 2 of Moya et al., 2001). To recover the sodium fraction of sea-salt cations for comparison with observations, the modeled sodium concentration (i.e., sodium plus non-sodium sea-salt cations) is multiplied by a factor of 0.78 during post-processing.
To account for enhanced sea-salt emission from the surf zone, Nolte et al. (2008) used the flux parameterization of de Leeuw et al. (2000). That treatment yielded rela-tively unbiased model results for total sodium when com-pared with observations at three BRACE sites. How-ever, recent improvements to the spatial allocation of surf-zone grid cells resulted in several cells close to BRACE sampling sites being reclassified as surf-zone cells (see article supplement (http://www.geosci-model-dev.net/3/257/ 2010/gmd-3-257-2010-supplement.pdf) for details on surf-zone allocation). In preliminary simulations based on the de Leeuw et al. (2000) parameterization with the newly grid-ded surf zone, large over-predictions of sodium and chloride were found at the coastal Azalea Park site. Therefore a dif-ferent approach was needed in this study. Surf-zone emis-sions are strongly dependent on local features such as wave height and bathymetry (de Leeuw et al., 2000; Lewis and Schwartz, 2004), but the de Leeuw et al. (2000) parame-terization was based on measurements along the California coast and may not be suitable for the Florida coast. For in-stance, Petelski and Chomka (1996) observed significantly lower mass fluxes for the Baltic coast than were observed by de Leeuw et al. (2000) for California (see discussion in de Leeuw et al., 2000). However, de Leeuw et al. (2000) demon-strated compatibility between their surf-zone source function and several open-ocean source functions by assuming 100% whitecap coverage for the surf zone.
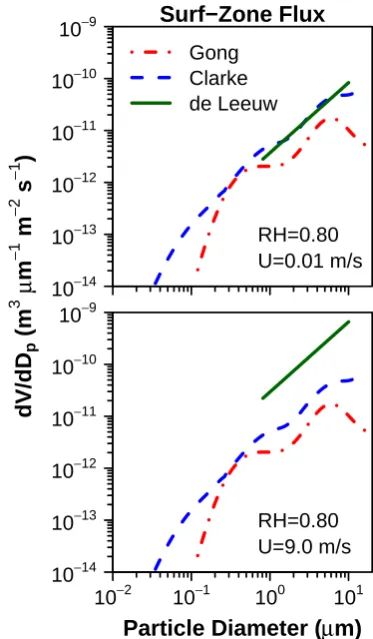
In CMAQv4.7, surf-zone emission fluxes are calculated using the open-ocean source function of Gong (2003) with a fixed whitecap coverage of 100% and a 50-m-wide surf zone. In Fig. 1, this flux is compared with the surf-zone source function of de Leeuw et al. (2000) and the Clarke et al. (2006) function based on 100% whitecap coverage. The Clarke et al. (2006) source function was developed for use in both open-ocean and coastal surf-zone environments and is based on observations of emissions from waves breaking on a Hawaiian shore. All three source functions yield sim-ilar order of magnitude for a 10-m wind speed of 0.01 m/s (Fig. 1, top); however, the de Leeuw et al. (2000) emission flux is much larger than the others for a 10-m wind speed of 9 m/s (Fig. 1, bottom). Note that the Gong (2003) and Clarke et al. (2006) curves do not depend on wind speed in Fig. 1, because the whitecap coverage is fixed. Considering the limitations of surf-zone emission estimates (e.g., Lewis and Schwartz, 2004, Sect. 4.3.5) and the similarity of the Gong (2003) flux with that derived from the surf measure-ments of Clarke et al. (2006), our treatment of sea-salt
emis-Surf−Zone Flux
Gong Clarke de Leeuw
10−14 10−13 10−12 10−11 10−10 10−9
RH=0.80 U=0.01 m/s
10−2 10−1 100 101 10−14
10−13 10−12 10−11 10−10 10−9
RH=0.80 U=9.0 m/s
Particle Diameter (
μ
m)
dV/dD
p
(m
3
μ
m
−
1
m
−
2
s
−
1
)
Fig. 1. Comparison of sea-salt emission size distributions at 80% RH with 10-m wind speed (U) of (a) 0.01 m/s and (b) 9 m/s. Clarke et al. (2006) and Gong (2003) source functions are based on 100% whitecap coverage; the magnitude of the de Leeuw et al. (2000) source function is wind-speed dependent.
sion from the coastal surf-zone in CMAQv4.7 is reasonable. However, we will revisit this topic in the future as new ap-proaches become more established.
2.3 Model application: Tampa, FL, May 2002
Table 1. Differences in CMAQ model versions used in this study.
Modela Sea-salt emissionsb Coarse particle
modec
Fine-mode GSDd Coarse-mode GSDd
CMAQv4.6 Open-ocean only Dry, chemically inert Variable, influenced by condensation of H2SO4
2.2
CMAQv4.6b Open-ocean and coastal surf-zone Dry, chemically inert Variable, influenced by condensation of H2SO4
2.2
CMAQv4.6c Open-ocean and coastal surf-zone Wet, dynamic mass transfer of HNO3, H2SO4, HCl, NH3 between gas and particle phases
Variable, doesn’t change during condensation or evaporation
Variable, doesn’t change during condensation or evaporation
aCMAQv4.6 is a standard release version; CMAQv4.6b and CMAQv4.6c are non-standard versions created for this study to evaluate the
updated sea-salt emission and coarse-particle chemistry parameterizations developed for CMAQv4.7.
bOpen-ocean parameterization is that of Gong (2003); the coastal surf-zone parameterization uses the source function of Gong (2003) with
100% whitecap coverage and a 50-m-wide surf zone (Sect. 2.2).
cDynamic mass transfer is calculated using the hybrid method of Capaldo et al. (2000) (Sect. 2.1.1). dParticle distribution geometric standard deviations are discussed in Sect. 2.1.2.
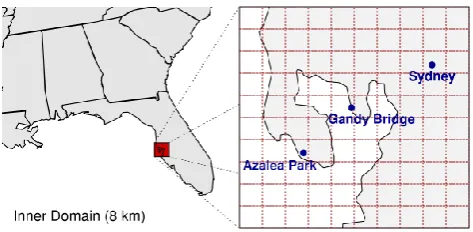
Fig. 2. Inner modeling domain (8 km×8 km) centered on Tampa, FL. Markers indicate land-based observational sites.
An overview of CMAQ equations and algorithms is given by Byun and Schere (2006). For our study, CMAQ was con-figured to use the SAPRC99 gas-phase chemical mechanism (Carter, 2000) and the Euler Backward Iterative solver. The modeling period (21 April–3 June 2002) and nested domains match those of Nolte et al. (2008). Specifically, the outer domain uses a 32 km×32 km horizontal grid and covers the continental US, with temporally invariant vertical concentra-tion profiles at the boundaries (Byun and Ching, 1999). The inner domain uses a 8 km×8 km horizontal grid that cov-ers the Southeast US. The inner domain is shown in Fig. 2 with markers for three BRACE observational sites. Initial and boundary conditions for the inner domain were created from simulations on the outer domain. CMAQ-ready emis-sion files containing information on area, point, mobile, and biogenic sources (i.e., all sources except sea salt) were taken from Nolte et al. (2008) – see that study for details on emis-sion inventories and uncertainty estimates.
2.4 CMAQ model versions
Three versions of CMAQ are used in this study: CMAQv4.6, CMAQv4.6b, and CMAQv4.6c. CMAQv4.6 is a stan-dard release version and is configured as described above. CMAQv4.6b is identical to CMAQv4.6 except that v4.6b incorporates the surf-zone emission parameterization devel-oped for v4.7 and described in Sect. 2.2. The impact of surf-zone emissions of sea salt on predictions is evaluated by comparing results of CMAQv4.6b with those of CMAQv4.6. CMAQv4.6c is identical to CMAQv4.6b except that v4.6c in-corporates the dynamically interactive coarse particle mode and GSD treatments developed for v4.7 and described in Sects. 2.1.1 and 2.1.2. The impact of the interactive coarse mode and GSD treatments are evaluated by comparing re-sults of CMAQv4.6c with those of CMAQv4.6b. CMAQv4.7 is not used in this study because it contains numerous model updates in addition to those under consideration (Foley et al., 2010). CMAQv4.6b and CMAQv4.6c are used here to isolate the impacts of the new treatment of sea-salt emissions and the dynamically interactive coarse particle mode. These model versions are available from the authors upon request. Note that the coarse particle mode is dry, chemically inert, and has a fixed GSD of 2.2 in both CMAQv4.6 and CMAQv4.6b. Table 1 summarizes differences of the model versions used here.
3 Observations
All Sites
v4.6
v4.6b
0 1 2 3 4
0 1 2 3 4
Na
+0 1 2 3 4 5 6
0 1 2 3 4 5 6
Cl
−Observed Total (μg m−3)
Predicted Total (
μ
g m
−
3
)
Fig. 3. Modeled total sodium and chloride particle concentrations vs. 23-h impactor observations at three Tampa-area sites for 5 sam-pling days (6 at Azalea Park) during 2–15 May 2002. “v4.6” indi-cates CMAQv4.6; “v4.6b” indiindi-cates CMAQv4.6b; see Table 1 for version description. For reference, the dashed line represents 1:1 ratio.
the dataset are available in Nolte et al. (2008), Arnold et al. (2007), Dasgupta et al. (2007), and Evans et al. (2004). Briefly, size-resolved measurements of inorganic PM con-centration were made with four micro-orifice cascade im-pactors, which operated for 23 h per sample (Evans et al., 2004). Impactors had 8–10 fractionated stages ranging from 0.056 to 18 µm in Daero, and two impactors were
collo-cated at the Sydney site. Samples were collected during 23-h periods on 15 days (14 at Sydney) during 2 May– 2 June 2002. The sampling dates are given on figures in the supplement (http://www.geosci-model-dev.net/3/257/ 2010/gmd-3-257-2010-supplement.pdf). At the Sydney site, total (i.e., Daero 50% cut ∼12.5 µm) nitrate was measured
with 15-min resolution using a soluble particle collector and an ion chromatograph (Dasgupta et al., 2007) and nitric acid was measured continuously by denuder difference (Arnold et al., 2007).
4 Results
4.1 Predicted and measured total PM concentrations
CMAQv4.6 and CMAQv4.6b predictions of 23-h average to-tal concentration (summed over all modes) of sodium and chloride are compared with 23-h average total observed con-centration (summed over all impactor stages) in Fig. 3 for observation days in the time period 2–15 May 2002. Grid-cell average predictions are compared with point measure-ments at the BRACE sites in this study. The results in Fig. 3 demonstrate the impact of the surf-zone emission parame-terization developed for CMAQv4.7. When surf-zone emis-sions are neglected (i.e., CMAQv4.6), the normalized mean bias (NMB) is −85% for sodium and −76% for chloride over all sites. When surf-zone emissions are added to the model (i.e., CMAQv4.6b), the sodium and chloride concen-trations increase by a factor of 2.8. Despite this improve-ment, model predictions still fall below the observed sodium and chloride concentrations (NMB=−58% and −34% for sodium and chloride, respectively). This result suggests that sea-salt emissions are significantly underestimated and/or the deposition of coarse-mode particles is too rapid in CMAQ.
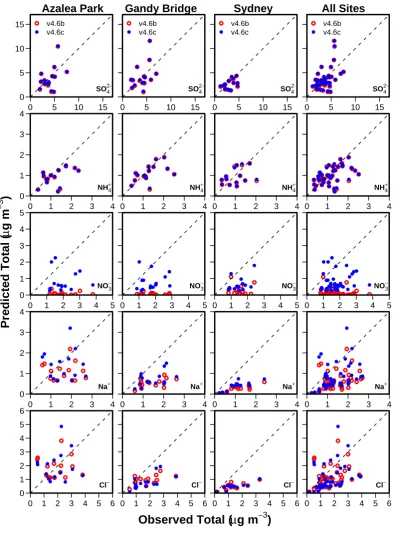
In Fig. 4, CMAQv4.6b and CMAQv4.6c predictions of 23-h average total concentration of SO24−, NH+4, NO−3, Na+, and Cl− are compared with 23-h average observed concen-trations at three sites for the time period 2 May–2 June 2002. Summary statistics for these comparisons are provided in Table 2. Differences in predictions for CMAQv4.6b and CMAQv4.6c are due to the different treatments of coarse-particle chemistry and modal GSDs described above. The largest difference in performance between the models is for nitrate concentration. Across all sampling sites and dates, nitrate is underestimated by about a factor of 10 in CMAQv4.6b (NMB=−92%) and only a factor of two in CMAQv4.6c (NMB=−56%). This substantial improvement is due to the treatment of coarse particles as chemically ac-tive in v4.6c but not v4.6b. The remaining under-prediction of nitrate by CMAQv4.6c is comparable to that of sodium (NMB=−56% and −40% for nitrate and sodium, respec-tively). Since sodium is the predominant cation in the coarse particles, further improvement in nitrate predictions may require improvements in sea-salt emissions and/or deposi-tion treatment. Despite the shortcomings of the predicdeposi-tions, CMAQv4.6c estimates for total nitrate and sodium concen-tration are a clear improvement over those of CMAQv4.6b.
Table 2. Mean observed (summed over all impactor stages) and model-predicted (summed over all modes) inorganic particle concentrations (µg m−3)at three sites near Tampa, FL.
Species Obs.a Modv4.6bb Modv4.6c Rv4.6bc Rv4.6c NMBv4.6bd NMBv4.6c NMEv4.6be NMEv4.6c RMSEv4.6bf RMSEv4.6c
Azalea Park
sulfate 4.03 3.71 3.82 0.45 0.45 −7.9 −5.3 40 39 2.1 2.1
ammonium 1.23 0.93 0.94 0.51 0.51 −24 −24 33 33 0.6 0.6
nitrate 1.96 0.09 0.81 −0.07 0.04 −96 −59 96 69 2.0 1.5
sodium 1.62 1.09 1.40 −0.06 −0.01 −33 −13 49 49 0.9 1.0
chloride 1.93 1.89 1.98 −0.04 0.09 −1.8 2.5 49 57 1.2 1.3
Gandy Bridge
sulfate 4.08 4.21 4.28 0.44 0.43 3.2 5.1 43 42 2.3 2.3
ammonium 1.30 1.10 1.11 0.52 0.53 −15 −14 28 28 0.5 0.5
nitrate 1.74 0.06 0.82 −0.14 0.11 −96 −53 96 60 1.8 1.2
sodium 1.46 0.54 0.73 0.52 0.47 −63 −50 63 50 1.1 0.9
chloride 1.72 0.93 0.80 0.57 0.65 −46 −53 49 54 1.1 1.1
Sydney
sulfate 3.13 2.59 2.66 0.47 0.46 −17 −15 30 30 1.2 1.2
ammonium 1.04 0.94 0.95 0.33 0.34 −8.8 −8.0 41 41 0.5 0.5
nitrate 1.51 0.30 0.65 −0.08 0.40 −80 −57 81 60 1.3 1.0
sodium 1.14 0.29 0.40 0.77 0.77 −75 −65 75 65 1.0 0.9
chloride 1.31 0.49 0.46 0.77 0.86 −63 −65 63 65 1.0 1.1
All Sites
sulfate 3.76 3.52 3.61 0.49 0.48 −6.3 −4.1 39 38 1.9 1.9
ammonium 1.19 0.99 1.00 0.47 0.48 −17 −16 34 33 0.5 0.5
nitrate 1.74 0.15 0.77 −0.17 0.16 −92 −56 92 63 1.7 1.2
sodium 1.41 0.65 0.86 0.35 0.34 −54 −40 60 54 1.0 0.9
chloride 1.66 1.12 1.09 0.34 0.38 −33 −34 52 58 1.1 1.2
aObserved mean concentration (µg m−3)
bModeled mean concentration (µg m−3)for CMAQv4.6b cPearson correlation coefficient for CMAQv4.6b predictions
dNormalized mean bias (%) for CMAQv4.6b predictions; NMB=PCmod−Cobs
P
Cobs
×100%, whereCis concentration eNormalized mean error (%) for CMAQv4.6b predictions; NME=P|Cmod−Cobs|
P
Cobs
×100%
fRoot mean square error (µg m−3)for CMAQv4.6b predictions; RMSE=
r 1
. nP
(Cmod −Cobs)2, wherenis the number of samples
of GSD for the coarse particle mode. The slightly higher (and better) predictions of total sulfate concentration by CMAQv4.6c are also attributable to the different coarse-mode GSD treatments, because coarse sea-salt particles con-tain a small amount of primary sulfate (7.6% by dry mass in CMAQ). Predictions of total ammonium concentration are essentially the same for CMAQv4.6b and CMAQv4.6c, and predictions of total chloride concentration are strongly bi-ased low for both models at the Gandy Bridge and Sydney sites (Table 2). Due to the low bias in chloride predictions, replacement of chloride by nitrate in CMAQv4.6c results in slightly worse total chloride predictions for v4.6c than v4.6b at these sites. However, compared to standard CMAQv4.6, which does not account for the enhanced emission of sea salt from the surf zone, CMAQv4.6c predictions of chlo-ride concentration are an improvement (e.g., see Table S1 in the supplement: http://www.geosci-model-dev.net/3/257/ 2010/gmd-3-257-2010-supplement.pdf).
Comparing results across sites in Fig. 4, one notices that sodium predictions are increasingly biased low with distance
from the Gulf of Mexico. Error in transport and deposition of sea-salt particles from the gulf could be responsible for this behavior. A related possibility is that relatively fine-scale coastal processes are not adequately captured with the 8-km horizontal resolution used in this study. Also, error in sea-salt emissions from the bay, which are calculated according to the open-ocean algorithm, could potentially lead to spa-tial differences in performance. For instance, bay emissions would impact the Gandy Bridge site most due to its bayside location (Fig. 2) and would influence the Sydney and Azalea Park sites differently for flows to and away from the gulf.
0 5 10 15 0
5 10 15
SO42− v4.6b
v4.6c
0 1 2 3 4
0 1 2 3 4
NH4+
0 1 2 3 4 5
0 1 2 3 4 5
NO3−
0 1 2 3 4
0 1 2 3 4
Na+
0 1 2 3 4 5 6
0 1 2 3 4 5 6
Cl−
0 5 10 15
SO42− v4.6b
v4.6c
0 1 2 3 4
NH4+
0 1 2 3 4 5
NO3−
0 1 2 3 4
Na+
0 1 2 3 4 5 6
Cl−
0 5 10 15
SO42− v4.6b
v4.6c
0 1 2 3 4
NH4+
0 1 2 3 4 5
NO3−
0 1 2 3 4
Na+
0 1 2 3 4 5 6
Cl−
0 5 10 15
SO42− v4.6b
v4.6c
0 1 2 3 4
NH4+
0 1 2 3 4 5
NO3−
0 1 2 3 4
Na+
0 1 2 3 4 5 6
Cl−
Observed Total (
μ
g m
−3)
Predicted Total (
μ
g m
−
3
)
Azalea Park Gandy Bridge Sydney All Sites
Fig. 4. Modeled total inorganic particle concentrations vs. 23-h impactor observations at three Tampa-area sites for 15 sampling days (14 at Sydney) during 2 May–2 June 2002. “v4.6b” indicates CMAQv4.6b; “v4.6c” indicates CMAQv4.6c; see Table 1 for version description. For reference, the dashed line represents 1:1 ratio. See Table 2 for summary statistics.
4.2 Predicted and measured particle size distributions
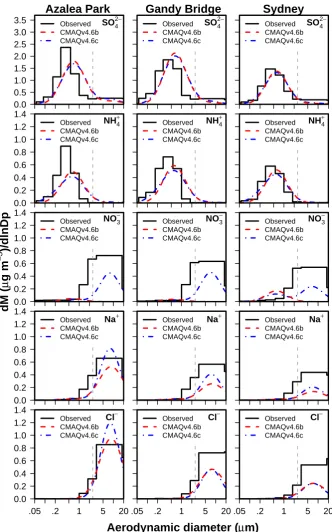
Size distributions of SO24−, NH+4, NO−3, Na+, and Cl− pre-dicted by CMAQv4.6b and CMAQv4.6c are compared with speciated impactor measurements averaged over all sampling
days in Fig. 5. Modeled diameters were converted toDaero
0.0 0.5 1.0 1.5 2.0 2.5 3.0
3.5 SO
4
2−
Observed CMAQv4.6b CMAQv4.6c
0.0 0.2 0.4 0.6 0.8 1.0 1.2 1.4
NH4+
Observed CMAQv4.6b CMAQv4.6c
0.0 0.2 0.4 0.6 0.8 1.0 1.2 1.4
NO3−
Observed CMAQv4.6b CMAQv4.6c
0.0 0.2 0.4 0.6 0.8 1.0 1.2 1.4
Na+
Observed CMAQv4.6b CMAQv4.6c
.05 .2 1 5 20 0.0
0.2 0.4 0.6 0.8 1.0 1.2 1.4
Cl−
Observed CMAQv4.6b CMAQv4.6c
SO42−
Observed CMAQv4.6b CMAQv4.6c
NH4+
Observed CMAQv4.6b CMAQv4.6c
NO3−
Observed CMAQv4.6b CMAQv4.6c
Na+
Observed CMAQv4.6b CMAQv4.6c
.05 .2 1 5 20 Cl−
Observed CMAQv4.6b CMAQv4.6c
SO42−
Observed CMAQv4.6b CMAQv4.6c
NH4+
Observed CMAQv4.6b CMAQv4.6c
NO3−
Observed CMAQv4.6b CMAQv4.6c
Na+
Observed CMAQv4.6b CMAQv4.6c
.05 .2 1 5 20 Cl−
Observed CMAQv4.6b CMAQv4.6c
Aerodynamic diameter (
μ
m)
dM (
μ
g m
−
3
)/dlnDp
Azalea Park Gandy Bridge Sydney
Fig. 5. Observed and predicted size distributions of inorganic particle components at three Tampa-area sites averaged over 15 sampling days (14 at Sydney) during 2 May–2 June 2002. Vertical dashed line indicatesDaeroof 2.5 µm.
stages) impactor for this figure. A figure similar to Fig. 5, but with CMAQ distributions mapped to the 8-stage size grid, is given in the supplement (Fig. S1). Comparisons of model predictions with observations at the original impactor reso-lutions for individual sampling days are also available in the supplementary material (Figs. S2–S15).
fine mode GSDs to vary during sulfate condensation cal-culations, whereas CMAQv4.6c does not. Condensational growth narrows a size distribution, because the diameters of small particles increase relatively quickly compared to those of large particles due to the higher surface area-to-volume ratios of small particles. Therefore CMAQv4.6b predicts slightly narrower fine particle modes and higher size distri-bution peaks than does CMAQv4.6c: the average GSD of the accumulation mode is 2.02 for CMAQv4.6b and 2.05 for CMAQv4.6c over all sites and sampling days. Another po-tential reason for higher peaks in the ammonium and sul-fate distributions of CMAQv4.6b is that small amounts of ammonia and sulfuric acid condense on coarse particles in CMAQv4.6c reducing their availability for condensation on fine particles. However, the mass of ammonium in the coarse mode is on average only 3% of that in the fine modes, and so uptake of ammonia by the coarse mode does not signif-icantly impact the fine particle distribution. Similarly, the mass of sulfate in the coarse mode is small and due in part to primary emissions of sulfate in coarse sea-salt particles.
The largest difference in the size-distribution predictions of CMAQv4.6b and CMAQv4.6c is for nitrate. The chem-ically active coarse mode enables CMAQv4.6c to correctly predict that nitrate predominantly resides in coarse parti-cles (Fig. 5). CMAQv4.6b does not allow the formation of coarse particle nitrate and cannot realistically simulate the nitrate size distribution at these three coastal observation sites. Despite the better performance of CMAQv4.6c for ni-trate, under-prediction of sodium, the primary coarse parti-cle cation, leads to under-prediction of coarse nitrate. At the Sydney site, the models under-predict sodium and nitrate in the coarse mode and over-predict nitrate in the accumulation mode (Fig. 5). The prediction of significant accumulation-mode nitrate at Sydney (but not the other sites) is primar-ily due to concentrations of ammonia in excess of those re-quired to fully neutralize aqueous sulfuric acid at Sydney. The average predicted molar ratio of total ammonia (i.e., NH3+NH+4) to non-sea-salt SO
2−
4 is greater than four at the
Sydney site and only about two at Azalea Park and Gandy Bridge. Ammonia ratios greater than two exceed that of neu-tral (NH4)2SO4and facilitate nitric acid condensation by
en-abling significant neutralization of aqueous nitric acid. Over-prediction of accumulation-mode nitrate is more pronounced for CMAQv4.6b than CMAQv4.6c, because CMAQv4.6b does not have a pathway for coarse-mode nitrate formation.
Both models correctly predict that sodium and chloride re-side predominantly in coarse particles (see bottom two panels of Fig. 5). However, CMAQv4.6c predicts higher concentra-tions of sodium than does CMAQv4.6b in better agreement with the measurements. Averaged over all sites and sampling days, the sodium concentration predicted by CMAQv4.6c is 32% greater than that predicted by CMAQv4.6b. Since emissions of sea salt are based on the same parameteriza-tion in CMAQv4.6b and CMAQv4.6c, differences in sodium predictions are attributable to differences in advective
trans-Fraction of Total Nitrate in Particle Phase
01 02 03 04 05 06 07 08 09 10 11 12 13 14 15 16 17 Day (May 1−17, 2002)
0.0 0.2 0.4 0.6 0.8
1.0 Observed CMAQv4.6b CMAQv4.6c
17 18 19 20 21 22 23 24 25 26 27 28 29 30 31 01 02 Day (May 17 − June 2, 2002)
0.0 0.2 0.4 0.6 0.8 1.0
Fig. 6. Time series of observed and modeled fraction of total nitrate in the particle phase [i.e., NO−3.(HNO3+NO−3)] at the Sydney, FL site from 1 May–2 June 2002. Tick marks represent 00:00 local standard time on each day.
port and deposition. The combined effect of these pro-cesses differs for the models largely because CMAQv4.6b uses a fixed GSD of 2.2 for the coarse particle mode, while CMAQv4.6c uses a variable coarse-mode GSD, which has an average value of 2.06 during the observation period. The lower coarse-mode GSD for CMAQv4.6c appears to result in lower dry deposition and in better predictions of coarse sodium concentration by v4.6c than v4.6b.
0.0 0.2 0.4 0.6 0.8 1.0
NO3− Na+
Observed CMAQv4.6b CMAQv4.6c
0.0 0.2 0.4 0.6 0.8 1.0 1.2
1.4 Cl− Na+
0.0 0.5 1.0
1.5 SO4
2− Na+
1 2 5 10 18 0.0
0.5 1.0 1.5 2.0 2.5
NH4+ Na+
NO3− Na+
Observed CMAQv4.6b CMAQv4.6c
Cl− Na+
SO42− Na+
1 2 5 10 18
NH4+ Na+
NO3− Na+
Observed CMAQv4.6b CMAQv4.6c
Cl− Na+
SO42− Na+
1 2 5 10 18
NH4+ Na+
Aerodynamic diameter (
μ
m)
Molar Ratio
Azalea Park Gandy Bridge Sydney
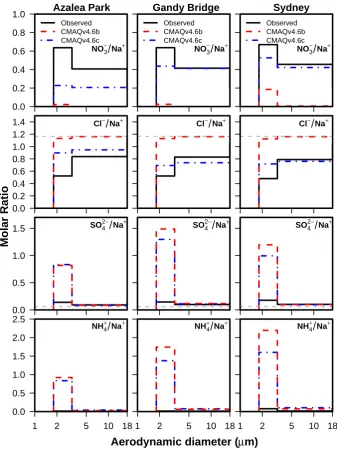
Fig. 7. Observed and modeled molar ratios of average inorganic ion concentration to average sodium ion concentration at three Tampa-area sites for 15 sampling days (14 at Sydney) during 2 May–2 June 2002. Horizontal dashed lines indicate average Cl−
Na+and SO24−.Na+ ratios in seawater.
Since fine and coarse particles have different sources, the over-prediction of GMD is not easily attributable to an in-correct emission size distribution. Modal GMD is diagnosed from the zeroth, second and third moments of the particle size distribution in CMAQ, and so the cause of the diame-ter over-prediction is not obvious. Zhang et al. (2006) re-ported similar over-prediction of volume mean diameter by CMAQ for a site in Atlanta in summer, and Elleman and Covert (2009) reported that CMAQ size distributions are shifted to larger sizes compared with observations at Lan-gley, Bristish Columbia in August. Therefore the problem
of diameter over-prediction is not confined to conditions of the BRACE campaign. Note that PM2.5 predictions would
increase slightly if over-predictions of GMD were corrected, because a larger fraction of the accumulation mode would fall below 2.5 µm (Jiang et al., 2006). Also note that predic-tions ofDaerofor coarse particle modes by CMAQv4.6b and
CMAQv4.6c are similar even though the coarse mode does not contain water in v4.6b. In the calculation ofDaero, the
4.3 Predictions and measurements of nitrate partitioning
Predictions of the mass fraction of nitrate in the parti-cle phase [i.e., NO−3(HNO3+NO−3)] are compared with
highly time-resolved measurements made at the Sydney site in Fig. 6. The average value of the particle fraction of nitrate over the observation period is 0.51 for the measurements, 0.35 for CMAQv4.6c, and 0.13 for CMAQv4.6b. Therefore the chemically-active coarse particle mode greatly improves predictions of nitrate partitioning by CMAQ. Despite this im-provement, CMAQv4.6c generally under-predicts the parti-cle fraction of nitrate. Also, although the timing of many peaks in the observed time series is correctly predicted, the diurnal amplitude of the measurements is not adequately cap-tured by the model. However, CMAQv4.6c is a clear im-provement over CMAQv4.6b, which incorrectly predicts that the particle fraction of nitrate is negligible for many time pe-riods. CMAQv4.6c also provides better predictions of ab-solute concentrations of HNO3 and HCl than CMAQv4.6b
(e.g., see Figs. S16 and S17 in http://www.geosci-model-dev. net/3/257/2010/gmd-3-257-2010-supplement.pdf).
The under-prediction of the fraction of nitrate in the par-ticle phase by CMAQv4.6c could be due to the under-prediction of sodium ion discussed above. To investigate this possibility, the average molar ratios of the inorganic ions to the sodium ion are examined for the two highest fraction-ated stages (1.8–3.2 and 3.2–18 µm; Fig. 7). CMAQ predic-tions were mapped to these stages by integrating the distribu-tions in Fig. 5 over the impactor size ranges. The measured ammonium-to-sodium ratios are negligible for these stages and suggest that sodium is the dominant cation forDaero>
3.2 µm. In contrast to the observations, both CMAQv4.6b and CMAQv4.6c predict amounts of ammonium and sulfate comparable to that of sodium in the lower of the two size bins (Fig. 7, bottom two rows). This behavior is attributable to the over-prediction of GMD, and possibly GSD, by CMAQ (Figs. 5 and S1). The error in CMAQv4.6c predictions of the molar ratios of nitrate and chloride to sodium for the lower stage (Fig. 7, top two rows) may reflect a limitation of using a single mode to represent all coarse particles.
Since the models correctly predict that the ammonium-to-sodium ratios are negligibly small for the highest stage, the influence of sodium on nitrate partitioning predictions can be evaluated by focusing on this stage. If prediction of nitrate is primarily a consequence of under-prediction of sodium, the nitrate-to-sodium ratios should be in reasonable agreement with the observations. For the Gandy Bridge and Sydney sites, CMAQv4.6c predictions of the nitrate-to-sodium ratio agree well with observations de-spite the large under-prediction of absolute nitrate concen-tration. The nitrate-to-sodium molar ratio is under-predicted by CMAQv4.6c by only 0.5% at Gandy Bridge and by only 7.5% at Sydney, whereas absolute nitrate concentration is under-predicted by 53% at Gandy Bridge and 57% at
Syd-ney. The molar ratios of the other inorganic ions are also in reasonable agreement with measurements at these sites. Therefore the under-prediction of nitrate and particle frac-tion of nitrate by CMAQv4.6c is largely attributable to the under-prediction of sodium ion. This finding suggests that the dynamically interactive coarse particle mode is function-ing properly, but that emissions, transport, and deposition of sodium are not adequately captured by the model for the Tampa domain. In contrast to the good predictions for the Gandy Bridge and Sydney sites, the nitrate-to-sodium mo-lar ratio is under-predicted by 49% by CMAQv4.6c at Aza-lea Park. The AzaAza-lea Park site is located in a grid cell with surf-zone emissions of sea salt, and so the error in the mod-eled nitrate-to-sodium ratio at this site may reflect the poor representation of the mixing of marine and continental air masses in the grid cell. However, the good predictions of the nitrate-to-sodium ratio at the inland (Sydney) and non-surf-zone bay site (Gandy Bridge) indicate that the sea-salt chemical-processing calculations are reliable.
4.4 Model timing
Computational efficiency is a key aspect of the model devel-opments described here. Models that are significantly slower than CMAQv4.6 are not suitable for conducting the numer-ous long-term simulations required for developing State Im-plementation Plans for the annual PM2.5standard. The run
time of CMAQv4.6c is only about 8% longer than that of CMAQv4.6. This increase is modest considering the sig-nificantly better predictions of CMAQv4.6c at the coastal BRACE sites. The primary cause of the longer run time for CMAQv4.6c is the additional calls to the ISORROPIA ther-modynamic module used in simulating dynamic mass trans-fer of coarse-particle components in CMAQv4.6c.
5 Closing remarks
This study focuses on evaluating parameterizations of sea-salt emissions from the coastal surf zone and the dynamic transfer of HNO3, H2SO4, HCl, and NH3 between coarse
particles and the gas phase in CMAQ. The methods described above improve predictions of inorganic particle components and nitrate partitioning at sites near Tampa Bay, FL and are included in the public release of CMAQ version 4.7. While the updates to CMAQ clearly improve predictions for condi-tions of the BRACE campaign, several areas for future model development were identified.
by CMAQ. Considering that Zhang et al. (2006) and Elle-man and Covert (2009) also report over-prediction of diame-ter by CMAQ and that this discrepancy may influence PM2.5
predictions, the source of the error should be investigated in future work.
Another area for future model development is on improv-ing the simulation of sea-salt emissions from the coastal surf zone. The surf-zone emission parameterization developed for CMAQv4.7 improves predictions of sodium and chloride concentration in the Tampa area. Yet predictions of sodium are increasingly biased low with distance from the Gulf of Mexico. This behavior was not observed in the Nolte et al. (2008) study and could be due to inadequate sea-salt emis-sions in addition to the over-predictions of GMD and GSD, which could yield too rapid particle deposition rates. The Clarke et al. (2006) parameterization (Fig. 1) produces higher sea-salt emissions than the modified Gong (2003) function used in CMAQv4.7 and could improve predictions for the Tampa domain. However, emissions of sea salt from the surf zone are dependent on local features, and the ideal parame-terization for Tampa may not be suitable for other locations where CMAQ is applied. Possibly, a parameterization could be developed that adapts to local features, or multiple param-eterizations could be incorporated into CMAQ and applied separately in different parts of the domain.
In addition to the emission parameterization, error in sodium and chloride predictions can be attributed to using 8 km×8 km horizontal grid cells for simulating relatively fine-scale coastal processes. Athanasopoulou et al. (2008) recently used 2 km×2 km horizontal grid cells in a nested portion of their domain to capture fine-scale processes near the coast. Predictions were not evaluated quantitatively in that study, because measurements are not available during the simulation period. Using higher grid resolution and tun-ing sea-salt emission from the surf zone could result in better predictions of the BRACE observations. However, the goal of our development is a model that can be applied generally by CMAQ users, who are often constrained to coarse grid resolutions and do not focus on the Tampa area.
While the model updates are evaluated here for condi-tions of Tampa, a separate study (Foley et al., 2010) sug-gests that the updates improve model performance in several coastal environments. In that study, CMAQv4.7 simulations with and without the new model features are performed for the eastern US with 12-km horizontal resolution, and pre-dictions are compared with observations from nine coastal CASTNET (Clarke et al., 1997) and four coastal SEARCH (Hansen et al., 2003) sites. For the CASTNET sites, the updated sea-salt emissions and coarse particle processes de-crease the mean absolute error (MAE) for nitric acid predic-tions by 36% in January and by 33% in August 2006, while MAE for total particle nitrate decreases by 10% in January and by 1% in August 2006. For the SEARCH sites, the model updates decrease MAE for coarse particle nitrate by 45% in January and by 52% in August 2006, while MAE for
fine particle nitrate decreases by 0.5% in January and by 11% in August 2006. These simulations are thoroughly discussed by Foley et al. (2010). The comparisons with coastal CAST-NET and SEARCH observations build confidence that the modeling approaches described here improve CMAQ predic-tions across a range of coastal condipredic-tions. However, accurate prediction of fine-scale coastal processes probably requires using higher grid resolution and a surf-zone emission param-eterization tailored to local conditions.
Acknowledgements. We kindly thank the following individuals for
their assistance in conducting this study: W. Benjey, R. Dennis, A. Eyth, E. Kinnee, R. Mathur, S. Pandis, T. Pierce, G. Pouliot, S. Roselle, K. Sartelet, K. Schere, and M. Wilson.
Disclaimer. The United States Environmental Protection Agency through its Office of Research and Development funded and managed the research described here. It has been subjected to the Agency’s administrative review and approved for publication.
Edited by: O. Boucher
References
Allen, A. G., Harrison, R. M., and Erisman, J. W.: Field-measurements of the dissociation of ammonium-nitrate and ammonium-chloride aerosols, Atmos. Environ., 23(7), 1591– 1599, 1989.
Arnold, J. R., Hartsell, B. E., Luke, W. T., Ullah, S. M. R., Das-gupta, P. K., Huey, L. G., and Tate, P.: Field test of four meth-ods for gas-phase ambient nitric acid, Atmos. Environ., 41(20), 4210–4226, 2007.
Asgharian, B., Hoffman, W., and Bergmann, R.: Particle deposi-tion in a multiple-path model of the human lung, Aerosol Sci. Technol., 34, 332–339, 2001.
Athanasopoulou, E., Tombrou, M., Pandis, S. N., and Russell, A. G.: The role of sea-salt emissions and heterogeneous chemistry in the air quality of polluted coastal areas, Atmos. Chem. Phys., 8, 5755–5769, 2008,
http://www.atmos-chem-phys.net/8/5755/2008/.
Atkeson, T., Greening, H., and Poor, N.: Bay Region At-mospheric Chemistry Experiment (BRACE), Atmos. Environ., 41(20), 4163–4164, 2007.
Beichert, P. and Finlayson-Pitts, B. J.: Knudsen cell studies of the uptake of gaseous HNO3 and other oxides of nitrogen on solid NaCl: The role of surface-adsorbed water, J. Phys. Chem., 100(37), 15218–15228, 1996.
Bessagnet, B., Hodzic, A., Vautard, R., Beekmann, M., Cheinet, S., Honor´e, C., Liousse, C., and Rouil, L.: Aerosol modeling with CHIMERE – preliminary evaluation at the continental scale, Atmos. Environ., 38(18), 2803–2817, 2004.
Binkowski, F. S. and Roselle, S. J.: Models-3 community multi-scale air quality (CMAQ) model aerosol component – 1. Model description, J. Geophys. Res., 108(D6), 4183–4201, 2003. Bricker, S., Longstaff, B., Dennison, W., Jones, A., Boicourt, K.,
Program Decision Analysis Series No. 26, National Centers for Coastal Ocean Science, Silver Spring, MD, 2007.
Binkowski, F. and Shankar, U.: The Regional Particulate Matter Model 1. Model description and preliminary results, J. Geophys. Res., 100(D12), 26191–26209, 1995.
Brunekreef, B. and Forsberg, B.: Epidemiological evidence of ef-fects of coarse airborne particles on health, European Respiratory J., 26(2), 309–318, 2005.
Byun, D. and Ching, J. K. S.: Science algorithms of the EPA Models-3 Community Multiscale Air Quality (CMAQ) modeling system, Tech. Rep. EPA-600/R-99/030, US Government Printing Office, US Environmental Protection Agency, Washington, D.C., 1999.
Byun, D. and Schere, K. L.: Review of the governing equations, computational algorithms, and other components of the Models-3 Community Mulitiscale Air Quality (CMAQ) modeling sys-tem, Appl. Mech. Rev., 59, 51–77, 2006.
Capaldo, K. P., Pilinis, C., and Pandis, S. N.: A computationally efficient hybrid approach for dynamic gas/aerosol transfer in air quality models, Atmos. Environ., 34(21), 3617–3627, 2000. Carter, W. P. L.: Implementation of the SAPRC-99 chemical
mechanism into the Models-3 framework, Tech. Rep., U.S. En-vironmental Protection Agency, URL: http:/www.cert.ucr.edu/
∼carter/absts.htm#s99mod3, 2000.
Chan, C. K., Ha, Z. Y., and Choi, M. Y.: Study of water activities of aerosols of mixtures of sodium and magnesium salts, Atmos. Environ., 34(28), 4795–4803, 2000..
Clarke, J. F., Edgerton, E. S., and Martin, B. E.: Dry deposition calculations for the clean air status and trends network, Atmos. Environ., 31(21), 3667–3678, 1997.
Clarke, A. D., Owens, S. R., and Zhou, J. C.: An ultrafine sea-salt flux from breaking waves: Implications for cloud condensation nuclei in the remote marine atmosphere, J. Geophys. Res., 111, D06202, doi:10.1029/2005JD006565, 2006.
Cohen, M. D., Flagan, R. C., and Seinfeld, J. H.: Studies of concen-trated electrolyte-solutions using the electrodynamic balance.1. Water activities for single-electrolyte solutions, J. Phys. Chem., 91(17), 4563–4574, 1987.
Dasgupta, P. K., Campbell, S. W., Al-Horr, R. S., Ullah, S. M. R., Li, J. Z., Amalfitano, C., and Poor, N. D.: Conversion of sea salt aerosol to NaNO3and the production of HCl: analysis of tempo-ral behavior of aerosol chloride/nitrate and gaseous HCl/HNO3, Atmos. Environ., 41(20), 4242–4257, 2007.
Dassios, K. G. and Pandis, S. N.: The mass accommodation co-efficient of ammonium nitrate aerosol, Atmos. Environ., 33(18), 2993–3003, 1999.
de Leeuw, G., Neele, F. P., Hill, M., Smith, M. H., and Vignati, E.: Production of sea spray aerosol in the surf zone, J. Geophys. Res., 105(D24), 29397–29409, 2000.
Evans, M. S. C., Campbell, S. W., Bhethanabotla, V., and Poor, N. D.: Effect of sea salt and calcium carbonate interactions with nitric acid on the direct dry deposition of nitrogen to Tampa Bay, Florida, Atmos. Environ., 38(29), 4847–4858, 2004.
Elleman, R. A. and Covert, D. S.: Aerosol size distribution modeling with the Community Multiscale Air Quality mod-eling system (CMAQ) in the Pacific Northwest: 1. Model comparison to observations, J. Geophys. Res., 114, D11206, doi:10.1029/2008JD010791, 2009.
Foley, K. M., Roselle, S. J., Appel, K. W., Bhave, P. V., Pleim, J.
E., Otte, T. L., Mathur, R., Sarwar, G., Young, J. O., Gilliam, R. C., Nolte, C. G., Kelly, J. T., Gilliland, A. B., and Bash, J. O.: Incremental testing of the Community Multiscale Air Quality (CMAQ) modeling system version 4.7, Geosci. Model Dev., 3, 205–226, 2010.
Foltescu, V. L., Pryor, S. C., and Bennet, C.: Sea salt generation, dispersion and removal on the regional scale, Atmos. Environ., 39(11), 2123–2133, 2005.
Gard, E. E., Kleeman, M. J., Gross, D. S., Hughes, L. S., Allen, J. O., Morrical, B. D., Fergenson, D. P., Dienes, T., Galli, M. E., Johnson, R. J., Cass, G. R., and Prather, K. A.: Direct observa-tion of heterogeneous chemistry in the atmosphere, Science, 279, 1184–1187, 1998.
Gaydos, T. M., Koo, B., Pandis, S. N., and Chock, D. P.: De-velopment and application of an efficient moving sectional ap-proach for the solution of the atmospheric aerosol conden-sation/evaporation equations, Atmos. Environ., 37(23), 3303– 3316, 2003.
Gong, S. L.: A parameterization of sea-salt aerosol source function for sub- and super-micron particles, Global Biogeochem. Cycles, 17(4), 1097, doi:10.1029/2003GB002079, 2003.
Grell, G., Dudhia, J., and Stauffer, D.: A description of the fifth-generation Penn State/NCAR mesoscale model (MM5), Tech. Rep. NCAR/TN-398+STR, National Center for Atmospheric Re-search, Boulder, CO, 1994.
Grell, G. A., Peckham, S. E., Schmitz, R., McKeen, S. A., Frost, G., Skamarock, W. C., and Eder, B.: Fully coupled “online” chem-istry within the WRF model, Atmos. Environ., 39(37), 6957– 6975, 2005.
Hansen, D. A., Edgerton, E .S., Hartsell, B. E., Jansen, J. J., Kan-dasamy, N., Hidy, G. M., and Blanchard, C. L.: The southeastern aerosol research and characterization study: Part 1-Overview, J. Air Waste Manag. Assoc., 53(12), 1460–1471, 2003.
Hopkins, R. J., Desyaterik, Y., Tivanski, A. V., Zaveri, R. A., Berkowitz, C. M., Tyliszczak, T., Gilles, M. K., and Laskin, A.: Chemical speciation of sulfur in marine cloud droplets and parti-cles: Analysis of individual particles from the marine boundary layer over the California current, J. Geophys. Res., 113, D04209, doi:10.1029/2007JD008954, 2008.
Hsu, S.-C., Liu, S. C., Kao, S.-J., Jeng, W.-L., Huang, Y.-T., Tseng, C.-M., Tsai, F., Tu, J.-Y., and Yang, Y.: Water-soluble species in the marine aerosol from the northern South China Sea: High chloride depletion related to air pollution, J. Geophys. Res., 112, D19304, doi:10.1029/2007JD008844, 2007.
Jacobson, M. Z.: Development and application of a new air pollu-tion modeling system.3. Aerosol-phase simulapollu-tions, Atmos. En-viron., 31(4), 587–608, 1997.
Jacobson, M. Z.: A solution to the problem of nonequilibrium acid/base gas-particle transfer at long time step, Aerosol Sci. Technol., 39(2), 92–103, 2005.
Jiang, W., Smyth, S., Giroux, ´E, Roth, H., and Yin, D.: Differences between CMAQ fine mode particle and PM2.5 concentrations and their impact on model performance evaluation in the lower Fraser valley, Atmos. Environ., 40(26), 4973–4985, 2006 Keene W. C., Stutz, J., Pszenny, A. A. P., Maben, J. R., Fischer,
Kelly, J. T. and Wexler, A. S.: Water uptake by aerosol: Water ac-tivity in supersaturated potassium solutions and deliquescence as a function of temperature, Atmos. Environ., 40(24), 4450–4468, 2006.
Kleeman, M. J. and Cass, G. R.: A 3D Eulerian source-oriented model for an externally mixed aerosol, Environ. Sci. Technol., 35, 4834–4848, 2001.
Koo, B., Gaydos, T. M., and Pandis, S. N.: Evaluation of the equilibrium, dynamic, and hybrid aerosol modeling approaches, Aerosol Sci. Technol., 37(1), 53–64, 2003.
Lee, T., Yu, X. Y., Ayres, B., Kreidenweis, S. M., Malm, W. C., and Collett, J. L.: Observations of fine and coarse particle nitrate at several rural locations in the United States, Atmos. Environ., 42(11), 2720–2732, 2008.
Lewis, E. R. and Schwartz, S. E.: Sea-Salt Aerosol Production: Mechanisms, Methods, Measurements, and Models – A Critical Review, American Geophysical Union, Washington, D.C., 2004. Lurmann, F. W., Wexler, A. S., Pandis, S. N., Musarra, S., Kumar, N., and Seinfeld, J. H.: Modelling urban and regional aerosols.2. Application to California’s South Coast Air Basin, Atmos. Envi-ron., 31(17), 2695–2715, 1997.
McInnes, L. M., Covert, D. S., Quinn, P. K., and Germani, M. S.: Measurements of chloride depletion and sulfur enrichment in individual sea-salt particles collected from the remote marine boundary-layer, J. Geophys., 99(D4), 8257–8268, 1994. Meng, Z. Y., Dabdub, D., and Seinfeld, J. H.: Size-resolved and
chemically resolved model of atmospheric aerosol dynamics, J. Geophys. Res., 103(D3), 3419–3435, 1998.
Meng, Z. Y. and Seinfeld, J. H.: Time scales to achieve atmospheric gas-aerosol equilibrium for volatile species, Atmos. Environ., 30(16), 2889–2900, 1996.
Monahan, E. C., Spiel, D. E., and Davidson, K. L.: A model of marine aerosol generation via whitecaps and wave disruption, in: Oceanic Whitecaps, edited by: Monahan, E. C. and MacNiocaill, G., D. Reidel Publishing Company, Norwell, Mass., pp. 167– 174, 1986.
Moya, M., Ansari, A. S., and Pandis, S. N.: Partitioning of nitrate and ammonium between the gas and particulate phases during the 1997 IMADA-AVER study in Mexico City, Atmos. Environ., 35, 1791–1804, 2001.
Nenes, A., Pandis, S. N., and Pilinis, C.: ISORROPIA: A new ther-modynamic equilibrium model for multiphase multicomponent inorganic aerosols, Aquatic Geochem., 4(1), 123–152, 1998. Nicholls, R. J. and Small, C.: Improved estimates of coastal
popu-lation and exposure to hazards released, EOS Transactions, July, 83(28), 301 & 305, 2002.
Nolte, C. G., Bhave, P. V., Arnold, J. R., Dennis, R. L., Zhang, K. M., and Wexler, A. S.: Modeling urban and regional aerosols – Application of the CMAQ-UCD Aerosol Model to Tampa, a coastal urban site, Atmos. Environ., 42(13), 3179–3191, 2008. Osthoff, H. D., Roberts, J. M., Ravishankara, A. R., Williams, E. J.,
Lerner, B. M., Sommariva, R., Bates, T. S., Coffman, D., Quinn, P. K., Dibb, J. E., Stark, H., Burkholder, J. B., Talukdar, R. K., Meagher, J., Fehsenfeld, F. C., and Brown, S. S.: High levels of nitryl chloride in the polluted subtropical marine boundary layer, Nature Geosci., 1(5), 324–328, 2008.
Pandis, S. N., Wexler, A. S., and Seinfeld, J. H.: Secondary or-ganic aerosol formation and transport.2. predicting the ambi-ent secondary organic aerosol-size distribution, Atmos. Environ.,
27(15), 2403–2416, 1993.
Park, S. K., Marmur, A., Kim, S. B., Tian, D., Hu, Y. T., McMurry, P. H., and Russell, A. G.: Evaluation of fine particle number concentrations in CMAQ, Aerosol Sci. Technol., 40(11), 985– 996, 2006.
Petelski, T. and Chomka, M.: Marine aerosol fluxes in the coastal zone–BAEX experimental data, Oceanologia, 38, 469–484, 1996.
Pierce, J. R. and Adams, P. J.: Global evaluation of CCN formation by direct emission of sea salt and growth of ultrafine sea salt, J. Geophys. Res., 111, D06203, doi:10.1029/2005JD006186, 2006. Pilinis, C., Capaldo, K. P., Nenes, A., and Pandis, S. N.: MADM – A new multicomponent aerosol dynamics model, Aerosol Sci. Technol., 32(5), 482–502, 2000.
Pleim, J., Wong, D., Mathur, R., Young, J., Otte, T., Gilliam, R., Binkowski, F., and Xiu, A.: Development of the coupled 2-way WRF-CMAQ system, 7th Annual CMAS Conference, 6–8 Octo-ber, Chapel Hill, NC, http://www.cmascenter.org, 2008. Pryor, S. C., Barthelmie, R. J., Schoof, J. T., Binkowski, F. S., Delle
Monache, L., and Stull, R.: Modeling the impact of sea-spray on particle concentrations in a coastal city, Sci. Tot. Environ., 391, 132–142, 2008.
Pryor, S. C. and Sorensen, L. L.: Nitric acid-sea salt reactions: Im-plications for nitrogen deposition to water surfaces, J. Appl. Me-teorol., 39(5), 725–731, 2000.
Sandstrom, T., Nowak, D., and van Bree, L.: Health effects of coarse particles in ambient air: messages for research and decision-making, European Respiratory J., 26(2), 187–188, 2005.
Sartelet, K. N., Hayami, H., Albriet, B., and Sportisse, B.: De-velopment and preliminary validation of a modal aerosol model for tropospheric chemistry: MAM, Aerosol Sci. Technol., 40(2), 118–127, 2006.
Sartelet, K. N., Hayami, H., and Sportisse, B.: Dominant aerosol processes during high-pollution episodes over Greater Tokyo, J. Geophys. Res., 112, D14214, doi:10.1029/2006JD007885, 2007. Sarwar, G. and Bhave, P. V.: Modeling the effect of chlorine emis-sions on ozone levels over the eastern United States, J. Appl. Meteorol. Climatol., 46(7), 1009–1019, 2007.
Seinfeld, J. H. and Pandis, S. N.: Atmospheric Chemistry and Physics: From Air Pollution to Climate Change, John Wiley & Sons, Inc., New York, 1998.
Simon, H., Kimura, Y., McGaughey, G., Allen, D. T., Brown, S. S., Osthoff, H. D., Roberts, J. M., Byun, D., and Lee, D.: Modeling the impact of ClNO2 on ozone formation in the Houston area, J. Geophys. Res., 114, D00F03, doi:10.1029/2008JD010732, 2009.
Smyth, S. C., Jiang, W. M., Roth, H., Moran, M. D., Makar, P. A., Yang, F. Q., Bouchet, V. S., and Landry, H.: A comparative performance evaluation of the AURAMS and CMAQ air-quality modelling systems, Atmos. Environ., 43(5), 1059–1070, 2009. Spyridaki, A., Lazaridis, M., Eleftheriadis, K., Smolik, J.,
Mi-halopoulos, N., and Aleksandropoulou, V.: Modelling and eval-uation of size-resolved aerosol characteristics in the eastern Mediterranean during the SUB-AERO project, Atmos. Environ., 40, 6261–6275, 2006.
8069, 2007.
Sun, Q. and Wexler, A. S.: Modeling urban and regional aerosols – Condensation and evaporation near acid neutrality, Atmos. Env-iron., 32(20), 3527–3531, 1998a.
Sun, Q. and Wexler, A. S.: Modeling urban and regional aerosols near acid neutrality – Application to the 24–25 June SCAQS episode, Atmos. Environ., 32(20), 3533–3545, 1998b.
Tang, I., Tridico, A., and Fung, K.: Thermodynamic and opti-cal properties of sea salt aerosols, J. Geophys. Res., 102(D19), 23269–23275, 1997.
Volckens, J., Dailey, L., Walters, G., and Devlin, R. B.: Di-rect particle-to-cell deposition of coarse ambient particulate mat-ter increases the production of inflammatory mediators from cultured human airway epithelial cells, Environ. Sci. Technol., 43(12), 4595–4599, 2009.
Wexler, A. S. and Seinfeld, J. H.: The distribution of ammonium-salts among a size and composition dispersed aerosol, Atmos. Environ., 24(5), 1231–1246, 1990.
Wexler, A. S. and Seinfeld, J. H.: Analysis of aerosol ammonium-nitrate – departures from equilibrium during SCAQS, Atmos. En-viron., 26(4), 579–591, 1992.
Zaveri, R. A., Easter, R. C., Fast, J. D., and Peters, L. K.: Model for Simulating Aerosol Interactions and Chemistry (MOSAIC), J. Geophys. Res., 113, D13204, doi:10.1029/2007JD008782, 2008.
Zhang, K. M., Knipping, E. M., Wexler, A. S., Bhave, P. V., and Tonnesen, G. S.: Size distribution of sea-salt emissions as a func-tion of relative humidity, Atmos. Environ., 39(18), 3373–3379, 2005.
Zhang, K. M. and Wexler, A. S.: An asynchronous time-stepping (ATS) integrator for atmospheric applications: Aerosol dynam-ics, Atmos. Environ., 40(24), 4574–4588, 2006.
Zhang, K. M. and Wexler, A. S.: Modeling urban and regional aerosols – Development of the UCD Aerosol Module and im-plementation in CMAQ model, Atmos. Environ., 42(13), 3166– 3178, 2008.
Zhang, Y., Liu, P., Pun, B., and Seigneur, C.: A comprehensive performance evaluation of MM5-CMAQ for the summer 1999 southern oxidants study episode – Part III: diagnostic and mech-anistic evaluations, Atmos. Environ., 40(26), 4856–4873, 2006. Zhang, Y., Pun, B., Vijayaraghavan, K., Wu, S. Y., Seigneur, C.,