Iranian Journal of Fisheries Sciences 11(4) 876-891 2012
Cyanobacterial community patterns as water quality
Bioindicators
Soltani N.
1; Khodaei K.
2, *; Alnajar N.
1; Shahsavari A.
2; Ashja Ardalan A.
3Received: March 2012 Accepted: July 2012
Abstract
The main goal of this study was to examine the use of cyanobacteria for evaluating the quality of running water. Accordingly epilithic cyanobacterial communities were collected in Dez River and Ojeyreb drain in south of Iran. Samples were collected in two seasons: autumn and spring. Effective physical and chemical factors on the structure of cyanobacterial communities and the dispersion of the species in relation with them were determined using PCA and CCA analyses. The Shannon-wiener biodiversity index was used to define the species diversity. The concentration of Nitrate as main nutrient had significant increase in Drain stations. A decline in species richness was observed associated with these increases in nutrient load in both seasons in different cyanobacterial community structure. The results indicated that order Oscillatoriales had higher proportion of cyanobacteria species at Drain.
The species Oscillatoria chlorina, Chroococcus minor, Phormidium tenue and Lyngbya
kuetzingii S had the most positive correlation with nutrient factor. Species Lyngbya infixa and
Lyngbya mesotrichia had the most negative correlation with nitrate. Our results confirm the using of cyanobacteria species as indicators for monitoring eutrophication in rivers and define them as water eutrophication bioindicators.
Keywords: Cyanobacteria, Drainage, Eutrophication, River, Water quality, PCA
__________________
1- Research Institute of applied Science, ACECR, Shahid Beheshti University, Tehran, Iran.
2- Dept. Geology, Institute of applied Science, ACECR, Shahid Beheshti University, Evin, Tehran, Iran. 3- Dept. Marine Biology, Islamic Azad University, Tehran-North Branch, Tehran, Iran.
*Corresponding Author's email: [email protected]
877 Soltani et al., Cyanobacterial community patterns as water quality Bioindicators
Introduction
Monitoring of eutrophication in running waters caused by anthropogenic activities in these ecosystems, is the first step to define an efficient water management
program for preservation of these
ecosystems. The analysis of microflora
community structure and defined
bioindicators of water quality is an
important tool in environmental
monitoring programs. First record of using biological methods to monitor river water quality was introduced by Kolkwitz and Marsson (1908). Many of methods have been defined to monitor rivers water
quality include employing algae,
bryophytes, macro invertebrates and fishes (Whitton and Kelly, 1995). However,
more recent investigations have
demonstrated that water quality and nutrient concentration in the river waters
had the greater effect on the
photosynthetic organisms as algae (Kelly and Whitton, 1998). With this respect algae such as diatom communities have
been widely used as bioindicators
(Whitton and Rott, 1996; Prygiel et al., 1999), and defined as biotic indices such as IBD index (based on diatoms) in the rivers water quality monitoring programs. It has been found that in special ecosystem of some rivers, cyanobacterial dominance and cyanotoxic effect on the studied communities would have lower values than expected (Aboal et al., 2002). These
results highlight the necessity of
incorporating corrections in biotic indices definitions and monitoring programs and also to consider the cyanobacterial communities. In recent studies it is shown that the structure of cyanobacterial
communities have changed from upstream to downstream of the rivers with physical and chemical conditions and nutrient load in the water (Perona et al., 1998; Aboal et al., 2002; Douterelo et al., 2004;
Maldonado et al., 2011). Such
investigations led to define the
cyanobacteria as water quality
bioindicators.
In this study cyanobacterial
community’s structure in Dez River and Ojeyreb Drain, in Khuzestan province (Iran) is described in two seasons: autumn and spring. Although the quality of Dez river are measured in a few papers (Khodaie et al., 2006; Khodaie and Shahsavari, 2003) this study is the first
record on Iranian river epilithic
cyanobacterial communities and the
relationship between the diversity of cyanobacterial species and physical and chemical conditions of water to determine water quality indicators and compared with universal patterns.
Materials and methods
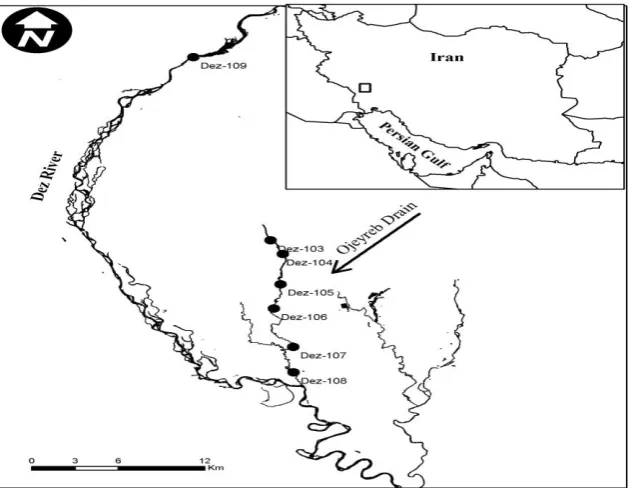
Sampling sites were selected in order to include locations above and below human settlements and agricultural centers. The research was carried out on seven sites, including the first site at Dez river branch (Dez108) and the other six sites along Ojeyreb drain at the end of Dez river to downstream point of this drain nearby the Persian Gulf (Dez103-Dez107, Fig. 1). Samples were collected two times in 2009, including the end of autumn and the end of spring. Dissolved oxygen, temperature, pH and electric conductivity (EC) were measured in situ in each sampling site
Iranian Journal of Fisheries Sciences, 11(4), 2012 878
using portable Multi 350i WTW
(Germany).
Water samples were taken in each station. Two polyethylene bottles of water per station were considered for chemical analysis. Nutrient chemical concentrations
(NO3-, Cl-, SO42-, PO43-) were analyzed
according to Standard Methods For Examination of Water and Wastewater,
(APHA) (1995); by chromatography
technique methods, respectively.
Figure 1: Geographical position of sampling sites
For sampling of cyanobacterial
communities in each sampling sites two stones were collected from a submerged part of the river bank. The attached algae were removed by brushing in 5 ml of medium. Aliquots were transferred on Petri dishes with different solid culture media (BBM, BG11 and Chu; Andersen, 2006). Another aliquot was fixed with
formaldehyde 4% for microscopic
examination. Cyanobacteria taxonomy and nomenclature is primarily classified based on the methods of Prescott (1962), Desikachary (1959), John et al. (2003). Their abundance in epilithon samples was evaluated by counting the presence of each species (as cells in filament or equal
number of individual cells) in alternate
transects in 16 cm2 surface on
semipermanent slides by light microscopy. The Shannon-Wiener biodiversity index (Margalef, 1957) was used to define the species diversity of algae inhabiting different types of habitats.
Data were subjected to multivariate statistical analysis. Environment data were ordinated using a correlation - based principal component analysis (PCA).
Relationship between cyanobacterial
abundance and environmental variables of sampling periods were analyzed with canonical correspondence analysis (CCA). Statistical analysis performed with Past and SPSS 16 software. In addition, cluster
879 Soltani et al., Cyanobacterial community patterns as water quality Bioindicators
analysis was carried out by ward's method at Euclidian scale by PAST software.
Results
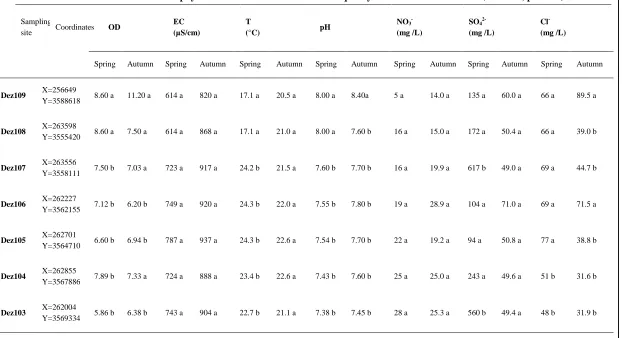
OD and pH in Dez River are higher than drain sites water. No significant difference between different drain sampling sites was found. However, EC had no significant difference in all sites, but it had higher
level in the autumn. Greater amount of Cl
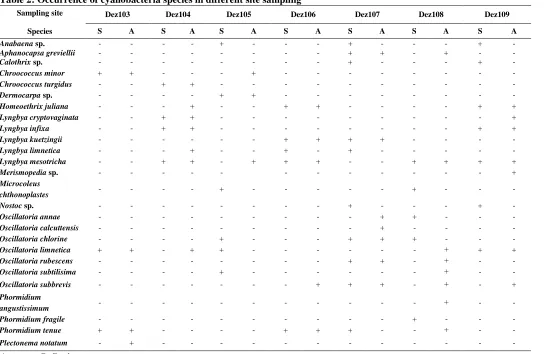
-were detected in the river than drain sites especially in the autumn. Amount of sulfate at the autumn was same in all sites but in the spring it shows high decrease in river water. Phosphate had very low amount in all sampling sites (not shown). These results show high variation in physical condition and nutrient content in the river water and drain sites (Table 1). Table 2 describes the occurance of species in different sampling sites. The dominant community of cyanobacteria of these stations is created by 35 species belonging
to 13 genera. Oscillatoria (7 species),
Lyngbya (5 species), Phormidium (3
species), Chroococcus (2 species) and
Anabaena, Aphanocapsa, Merismopedia , Microcoleus, Nostoc, Plectonema each with one species were present in sampling sites. Dominant species in first sampling
were Phormidium angustissimum West et
G.S. West, Homeothrix juliana and
Oscillatoria annae in Dez 108, 107 and
106 sites, respectively, L.mesotrichia in
Dez 105, 104, 103 sites and Oscillatoria
limentica in Dez 109 sampling site. The dominant species in the spring changed to
Microcoleus chthonoplastes (Vaucher)
Gomont, Oscillatoria subbrevis Schmidle
and L. mesotrichia in Dez 108,107 and
106, Lyngbya limnetica Lemmermann in
Dez 105 and 103, L.infixa in Dez104 and
L.mesotrichia in Dez 109 (Fig. 2). In other
view the dominant filamentous
cyanobacteria species in two sampling
seasons were L.mesotrichia,
P.angustissimum, O.annae, O.limnetica, O.subbrevis, H.juliana, L.infixa and M.chthonoplastese that the dominance of
two species O.limnetica and L.mesotrichia
were observed in Dez River and the others were in Ojeyreb drain sites, also
non-filamentous dominant species were
Chroococcus turgidus (Kuetz.) Naegeli, Ch.minor and Dermocarpa sp.. The dominance of this species just observed in Drain sampling sites. The most abundant filamentous species were observed is
L.mesotrichia in Dez109 in the spring and
Dermocarpa sp. as non-filamentous
species in Dez105 at the autumn.
I ran ian J o u rn al o f Fi sh er ies S cien ce s, 1 1 (4 ), 2 0 1 2 8 80
Table 1: Variation of the chemical and physical variables associated with the quality of waters in two seasons (ANOVA, p<0.001)
Cl
-(mg /L) SO42-
(mg /L) NO3
-(mg /L) pH T (°C) EC (µS/cm) OD Coordinates Sampling site Autumn Spring Autumn Spring Autumn Spring Autumn Spring Autumn Spring Autumn Spring Autumn Spring 89.5 a 66 a 60.0 a 135 a 14.0 a 5 a 8.40a 8.00 a 20.5 a 17.1 a 820 a 614 a 11.20 a 8.60 a X=256649 Y=3588618 Dez109 39.0 b 66 a 50.4 a 172 a 15.0 a 16 a 7.60 b 8.00 a 21.0 a 17.1 a 868 a 614 a 7.50 a 8.60 a X=263598 Y=3555420 Dez108 44.7 b 69 a 49.0 a 617 b 19.9 a 16 a 7.70 b 7.60 b 21.5 a 24.2 b 917 a 723 a 7.03 a 7.50 b X=263556 Y=3558111 Dez107 71.5 a 69 a 71.0 a 104 a 28.9 a 19 a 7.80 b 7.55 b 22.0 a 24.3 b 920 a 749 a 6.20 b 7.12 b X=262227 Y=3562155 Dez106 38.8 b 77 a 50.8 a 94 a 19.2 a 22 a 7.70 b 7.54 b 22.6 a 24.3 b 937 a 787 a 6.94 b 6.60 b X=262701 Y=3564710 Dez105 31.6 b 51 b 49.6 a 243 a 25.0 a 25 a 7.60 b 7.43 b 22.6 a 23.4 b 888 a 724 a 7.33 a 7.89 b X=262855 Y=3567886 Dez104 31.9 b 48 b 49.4 a 560 b 25.3 a 28 a 7.45 b 7.38 b 21.1 a 22.7 b 904 a 743 a 6.38 b 5.86 b X=262004 Y=3569334 Dez103
8 81 So ltan i et al ., C y a n o b ac ter ial co m m u n it y p atter n s a s w ater q u al it y B io in d icato rs
Table 2: Occurrence of cyanobacteria species in different site sampling
Dez109 Dez108 Dez107 Dez106 Dez105 Dez104 Dez103 Sampling site
Species S A S A S A S A S A S A S A
- + - - - + - - - + - - - -
Anabaena sp.
- - + - + + - - - - - - - - Aphanocapsa greviellii - + - - - + - - - - - - - -
Calothrix sp.
- - - - - - - - + - - - + + Chroococcus minor - - - - - - - - - - + + - - Chroococcus turgidus - - - - - - - - + + - - - -
Dermocarpa sp.
+ + - - - - + + - - + - - - Homeoethrix juliana + - - - - - - - - - + + - - Lyngbya cryptovaginata + + - - - - - - - - + + - - Lyngbya infixa - - - - + + + + - - - - - - Lyngbya kuetzingii - - - - - + - + - - + - - - Lyngbya limnetica + + + + - - + + + - + + - - Lyngbya mesotricha + - - - - - - - - - - - -
Merismopedia sp.
- - - + - - - - - + - - - - Microcoleus chthonoplastes - + - - - + - - - - - - - -
Nostoc sp.
- - - + + - - - - - - - - - Oscillatoria annae - - - - + - - - - - - - - - Oscillatoria calcuttensis - - - + + + - - - + - - - - Oscillatoria chlorine + + + - - - - - - + + - + + Oscillatoria limnetica - - + - + + - - - - - - - - Oscillatoria rubescens - - + - - - - - - + - - - - Oscillatoria subtilisima + - + - + + + - - - - - - - Oscillatoria subbrevis - - + - - - - - - - - - - - Phormidium angustissimum - - - + - - - - - - - - - - Phormidium fragile - - + - - + + + - - - - + + Phormidium tenue - - - - - - - - - - - - + - Plectonema notatum
A: Autumn, S: Spring
Iranian Journal of Fisheries Sciences, 11(4), 2012 882
Figure2: Variability of the abundunce of dominant cyanobacteria species in two sampling seasons.
Table 3: Shannon-Wiener and Dominance indices
Shanon-Wiener indices Site
Autumn spring
0.479 0.346
Dez103
0.664 0.430
Dez104
0.185 0.368
Dez105
0.309 0.964
Dez106
0.756 0.178
Dez107
0.322 0.732
Dez108
0.273 0.221
Dez109
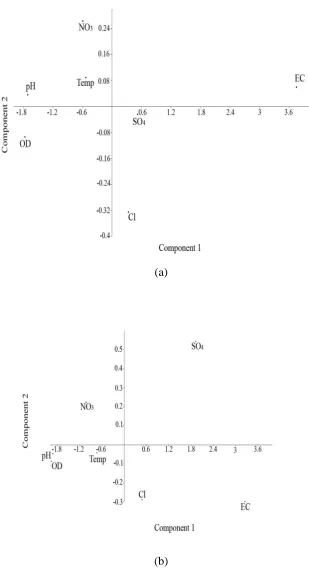
Maximum species diversity was observed in autumn in Dez 106 and 108 sampling sites and so the minimum diversity was in Dez 107 in spring. Increases in the diversity Ordination of environmental data by PCA showed a clear pattern. In the autumn sampling the first two components explained 98% of the data variance (pc1=3.5, pc 2=0. 03) on component 1, high positive values were associated to EC
(then SO42-) and pH, OD (then
temperature) were related to high negative
values. Positive and negative values on
second component were associated to NO3
-and Cl- concentrations, respectively. At the
spring sampling as above, the first two components explained 96% of the data variance (pc1=3.9, pc2= 0.08). Positive values on first component were associated
to EC and SO42- and negative values were
associated to pH, OD and NO3
-concentration. Cl- concentration is
associated to negative values on the second component (Fig. 3).
883 Soltani et al., Cyanobacterial community patterns as water quality Bioindicators
(a)
(b)
Figure 3: PCA analysis of environmental data obtained in (a) autumn and (b) spring
Iranian Journal of Fisheries Sciences, 11(4), 2012 884
(a)
(b)
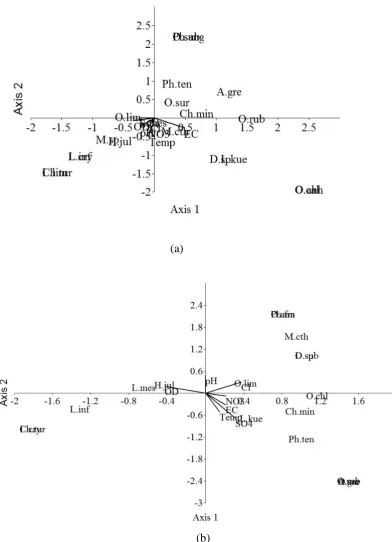
Figure 4: CCA ordination plot in (a) autumn and spring (b)
885 Soltani et al., Cyanobacterial community patterns as water quality Bioindicators …
(a)
(b)
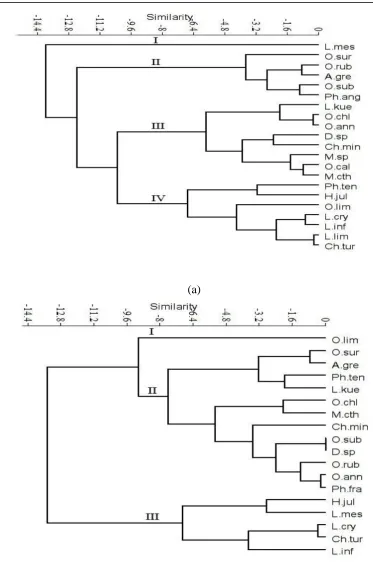
Figure 5: Dendrograms of the Cyanobacterial communities groups based on environmental factors of sampling sites (a) autumn, (b) spring
Iranian Journal of Fisheries Sciences, 11(4), 2012 886
The preliminary cyanobacteria CCA
analysis was carried out on the basis of
seven variables in two sampling seasons:
autumn and spring, shown in table 1, to
show the species- environment correlation.
Aphanocapsa greviellii (Hassall)
Rabenhorst, O.rubescens (de Candol)
Gomont, O.subbrevis and Ch.minor in
autumn showed the highest direct
correlation to EC and another hand the
species L.mesotrichia, M.sp., H.juliana
and O.limnetica have the highest
correlation to OD and SO42-, and
L.mesotrichia and H.galiana in the spring
samplings showed the highest direct
correlation to OD and SO42-. O.chlorina,
C.minor, L.kuetzingii, P.tenue have the
highest positive and L.mesotricha,
C.turgidus and H.juliana have the highest
negative association to NO3- and SO42- as
nutrient water ions (Fig. 4). Cluster
analysis was performed to separate the
species to distinct groups based on
environmental factors, with the help of
CCA analysis results (Fig. 5).In autumn
sampling, 4 groups of species could be
distinguished from the dendrogram based
on hierarchical cluster:
I. A species with highest direct
correlation just to OD.
II. Species with direct positive
correlation to EC and negative
correlation to temperature.
III. Species with direct positive
correlation to EC and
temperature
IV. species with direct positive
correlation to OD, SO4-2 and
pH
The dissimilarity between groups was
higher than -9.6. The CCA analysis results
revealed that EC, OD and SO4-2 are the
main factors influencing the
cyanobacterial species communities in the
autumn. Three groups of species could be
distinguished from the dendrogram of the
cluster analysis the spring sampling:
I. A species with highest positive
correlation to Cl-2.
II. Species with positive direct
correlation to NO3- , EC and SO4-2.
III. Species with highest positive
direct correlation to OD.
The dissimilarity between groups
was higher than -8.0 the CCA analysis
results confirmed that EC, SO4-2, NO3- and
OD are the main factors influencing the
cyanobacterial species communities in the
spring.
Discussion
Our results revealed great difference in
physical condition and nutrient content
between river and Drain water, that led to
different cyanobacterial community
structures in this locations, so we can
define two different zones: The fresh water
of the river and also second station in the
887 Soltani et al., Cyanobacterial community patterns as water quality Bioindicators …
Drain water where subjected to a
particularly wide variety of perturbations
as domestic waters and due to agricultural
practices. In describing of water chemical
content a distinction can be drawn between
conservative chemical factors as pH, SO4
2-, Cl-, etc. that closely associated with
lithological composition of river basin and
determine the mineralization of the water
and non-conservative component such as
nutrient whose concentrations depend on
local conditions (Sabater et al., 1990).
There are many records confirmed that the
cyanobacteria community responds to
changes in fresh water quality and there is
not always a general response for all
cyanobacteria as group, since the
responses of single species can be quite
different. So changes in cyanobacterial
communities or single species can be used
as water quality bioindicators (Douterelo
et al., 2004).
In this study PCA analysis results
showed that physical parameters such as
OD, EC and pH have the most important
effect on describing the patterns of
cyanobacterial species diversity that have
higher level in the river water than drain
sites. There are a few results about the
effect of physical water conditions on the
cyanobacterial communities.
In previous studies the use of
epilithic diatoms as acidity indicators
(Coring, 1996) and the negative effect of
OD on richness of cyanobacterial
communities in high level of dissolved
oxygen were shown in fresh waters
(Whitton, 1992). Our results showed the
highest direct correlation between OD and
abundance of two species L.mesotrichia
and H.juliana. Abundance of some species
such as A. greviellii, O.rubbescens,
O.subbrevis and O.limnetica also
correlated with this factor.
It has described an increase in
prevalence of cyanobacteria in response to
different types of fluvial pollutions such as
eutrophication (Shaji and Patel, 1991),
high level of organic pollution (Necchi et
al., 1994) and high relative abundance of
filamentous cyanobacteria with increasing
fecal coliform concentration or urban
wastewater (Vis et al., 1998). At least it
had confirmed that epilithic cyanobacterial
communities are suitable eutrophication
bioindicators in the rivers (Perona et al.,
1998). Our results showed less nitrate level
in the river than drain water, whereas the
phosphate concentration had very low
level in both. CCA analysis results showed
the highest negative correlation with NO3
-concentration and species L.infica and
L.mesotrichia abundance. Also C.turgidus,
L.mesotrichia and H.juliana have
significant decreases in abundance at sites
with high level of NO3-. C.minor has the
most positive correlation with NO3
-concentration. Increase of NO3- level in the
water has direct effect on the abundance of
O.chlorine, L.kuetzingii and P.tenue
8 Iranian Journal of Fisheries Sciences, 11(4), 2012 88
species. In subsequent reviews
(Fjerdingstad, 1964; Sladeček, 1973; Rott
et al., 1997) several species of genera
Oscillatoria emerged as organically
polluted waters. However, Oscillatoria
species such as O.limosa and O.boryana
(Rott and Fister, 1988; Aboal, 1989)
became more abundant in enriched waters;
species belonging to Oscillatoriales were
associated with highly eutrophic media.
Douterelo (2004) defined greater number
of Oscillatoria species at the downstream
sites of the rivers that had high trophic
levels. Also, our study confirmed the
relationship between water entrophication
and Oscillatoria abundance.
In addition, this study suggested that
C.minor and then O.chlorina, P.tenue and
L.kuetzingiias can be as indicators of
eutrophic waters. In the other hand, some
genera such as Nostoc (Sabater 1983;
Aboal, 1988), Chamaespihon (Sabater,
1983; Aboal, 1988), Calothrix and
Scytonema (Fernandez-pinas et al., 1991)
are commonly associated with low level
nutrient waters and upstream sites. Our
results also suggested the presence of two
Lyngbya species L.mesotrichia and
L.infixa and other species H.juliana and
Chroococcus turgidus as low influenced
environment or unpolluted waters
indicators.
Totally, these results showed the
replacement of sensitive species in cleaned
waters to resistant species in the drain as
polluted water in agreement with previous
suggestions (Perona et al., 1999). Results
also confirm that cyanabacteria
community responds to changes in fresh
water quality and can be used as
bioindicators in environmental studies of
quality of these ecosystems.
The present study clearly
illustrated the response of cyanobacterial
species and structure of their communities
to fresh water quality and replacement of
sensitive species in cleaned waters to
resistant species in the drain as polluted
water. In confirmation of previous reports
this study showed that most abundant
species in eutrophic water of the drain
belonged to Family Oscillatoriaceae,
besides in this study the frequent presence
of Chroococcus minor, O. chlorina,
P.tenue and L.kuetzingii were reported in
the drain water. On the other hand the
abundance of species L.mesotrichia,
L.infixa, H.juliana and Chroococcus
turgidus in the river indicates how
influenced or unpolluted waters. So these
species can be considered as bioindicators
in the environmental monitoring programs.
The results of such studies could be led to
define a universal freshwater quality index
based on cyanobacterial community
structures.
Acknowledgements
889 Soltani et al., Cyanobacterial community patterns as water quality Bioindicators …
This work was supported by the grant No.
1427-55 from the research council of
ACECR, Tehran, Iran.
References
Aboal, M., 1988. Aportacio´n al
conocimiento de las algas
epicontinentales del sudeste de
Espana. III: Cianoficeas
(Cyaniphyceas Schaffner 1909).
Anales del Jardin Botanico de
Madrid, 45, 3-46.
Aboal, M., 1989. Epilithic algal
communities from River Saegure
Basin, southeastern Spain. Archive für
Hydrobiology, 116, 113-124.
Aboal, M., Puig, M. A., Mateo, P. and
Perona, E., 2002. Implication of
cyanophyte toxicity on biological
monitoring of calcareous streams in
north-east Spain. Journal of Applied
Phycology, 14, 49-56.
American Public Health Association,
1995. Standard methods for
examination of water and wastewater.
19th Ed., Washington, DC., USA.
Andersen, R. A., 2006. Algal culturing
techniques, Elsevier Academic Press.
Coring, E., 1996. Use of diatoms for
monitoring acidification in small
mountain rivers in Germany with
special emphasis on "Diatom
Assemblage Type Analysis" (DATA).
In: Whitton, B.A. and Rott, E. (Eds.),
Use of algae for monitoring rivers II,
Institüte fur Botanik, Universität
Innsbruke, Austria. pp. 7-16.
Desikachary, T. V., 1959. Cyanophyta.
Indian council of agricultural research,
New Delhi.
Douterelo, I., Perona, E. and Mateo, P.,
2004. Use of cyanobacteria to assess
water quality in running waters.
Environmental Pollution, 127,
377-384.
Fernandez-piñas, F., Leganés, F.,
Mateo, P. and Bonilla, I., 1991. Use
of algae for monitoring Rivers. Institut
fur Botanik, Universitat Innsbruck ,
Innsbruck, Austria. pp. 151-156.
Fjerdingstad, E., 1964. Pollution of
streams estimated by benthal
phytomicro-organisms. I. A saprobic
system based on communities of
organism and ecological factors.
International Review of Hydrobiology,
99, 63-131.
John, D. M., Whitton, B. A. and Brook,
A. J., 2003. The freshwater algal flora
of the British Isles, an identification
guide to freshwater and terrestrial
algae. Cambridge University Press,
London. Pages.
Kelly, M. G. and Whitton, B. A., 1998.
Biological monitoring of
eutrophication in rivers.
Hydrobiologia, 384, 55-67.
Khodaie, K. and Shahsavari, A., 2003.
Hydroclimatological balance of
9 Iranian Journal of Fisheries Sciences, 11(4), 2012 8 0
Dezful/Andimesh aquifer. Research
Institute of Applied Science.
Khodaie, K., Shahsavari, A. and
Asadian, F., 2006. Integrated
modeling of groundwater/surface
water in Dezule/Andimeshk aquifer.
Research Institute of Applied Science.
Kolkwitz, R. and Marsson, M., 1908.
Ökologie der flanzliche saprobien.
Berichte der Deutschen Botanischen
Gesellschaft, 26, 505-519.
Margalef, R., 1957. Information theory in
ecology. Genes and Genetic Systems,
3, 36–7.
Maldonado J., Solé A., Puyen ZM. and
Esteve I., 2011. Selection of
bioindicators to detect lead pollution
in Ebro Delta microbial mats, using
high-resolution microscopic
techniques. Aquatic Toxicology,
104(1-2), 135-44.
Necchi, O. Jr., Branco, L. H. and Dip,
M. R., 1994. Uso de macroalgas para
avaliaçãö da poluçião organica no Rio
Preto , noroeste do estado de
Sãopaulo. Anais da Academia
Brasileira de Ciencias, 66, 359-371.
Perona, E., Bonilla, I. and Mateo, P.,
1998. Epilithic cyanobacterial
communities and water quality: an
alternative tool for monitoring
eutrophication in the Alberche River
(Spain). Journal of Applied
Phycology, 10,183-191.
Perona, E., Bonilla, I. and Mateo, P.,
1999. Use of benthic cyanobacteria to
monitor water quality in a Spanish
river. In: Prygiel, J., Whitton, B.A.,
Bukowska, J., (Eds.). Use of algae for
monitoring rivers III. pp. 216-223.
Prescott, G. W., 1962. Algae of the
western great lake area. W.M.C.
Brown Company Publication.
Prygiel, J., Whitton, B. A. and
Budowska, J., 1999. Use of Algae for
Monitoring Rivers III. Agence de L’Eau Artors-Picardie, Douai, France.
Rott, E., Hofmann, G., Pall, k., Pfister,
P. and Pipp, E., 1997.
Indikationslisten für Aufwuchsalgen
In Österrechischen Fliessgewässern
Teil 1: Saprobielle Indikation.
Bundesministerium für land-und
Forstwirtschaft, Austria.
Rott, E. and Pfister, P., 1988. Natural
epilithic algal communities in fast
flowing mountain streams and rivers
and some man-iduced changes.
Verhandlungen des Internationalen
Verein Limnologie, 23, 1320-1324.
Sabater, F., Sabater, S. and Armegol,
J., 1990. Chemical characteristics of a
Mediterranean river as influenced by
land uses in the water shed. Water
Research, 24, 143-155.
Sabater, S., 1983. Distribución
espacio-termal de las poblicaiones de algas del arroto de 1’Avenco (Barcelona). Actas
1
89 Soltani et al., Cyanobacterial community patterns as water quality Bioindicators …
del primer congreso Español de
Limnología. España.
Shaji, C. and Petal, R. J., 1991.
Chemical and Biological evaluation of
pollution in the River Sabarmati at
Ahmadabad, Gujrat. Phykos, 30,
91-100.
Sladeček, V., 1973. System of water
quality from the biological point of
view. Archive für Hydrobiology, 7,
1-218.
Vis, C., Hudon, C., Caaneo, A. and
Pinel-Alloul, B., 1998. Periphyton as
indicator of water quality in the St.
Lawevece River. Quebec, Canadá.
Environmental Pollution 101, 13-24.
Whitton, B. A., 1992. Diversity, ecology
and taxonomy of the cyanobacteria.
In: Carr, N.G. and Mann, N.H. (Eds.).
Phytosynthetic prokaryotes. Plenum
Press. New York, pp. 1-51.
Whitton, B. A. and Kelly, M. G., 1995.
Use of algae and other plants for
monitoring rivers. Australian Journal
of Ecology, 20, 56-95.